
EB Daily Market Report - Tuesday, September 22, 2026
Executive Summary
- Futures were higher overnight and our major indices gapped up
- The Dow Jones has retreated, is losing ground currently, and has lagged the other indices; 6 of the 7 top-weighted stocks in the Dow are lower today
- Meanwhile, the NASDAQ 100 ($NDX) is threatening an all-time high breakout
- Materials (XLB, +1.77%) is today's leading sector; technology (XLK, +0.74%) is having another strong session
- Energy (XLE, -1.02%) is among today's worst-performing sectors, as crude oil ($WTIC, -0.60%) falls further from its recent high of $106 per barrel
- Cryptocurrencies are mostly flat after a solid run higher, though XRP is up more than 5% today
- The 10-year treasury yield ($TNX) is slightly higher to 4.97%, still threatening that key 19-year high at 5.00%
- Semiconductors (SOXX, +2.23%) are gaining momentum again, with Sandisk (SNDK, +7.29%) and Micron Technology (MU, +4.83%) among the S&P 500 leaders
Market Outlook
I talk a lot about "primary" and "secondary" signals. For me, there is NOTHING more important than actual price and volume action. And I like to use the benchmark S&P 500 and then compare everything else to it.
Right now, the S&P 500 is trending up again, but we do still need to clear important price resistance established during August:
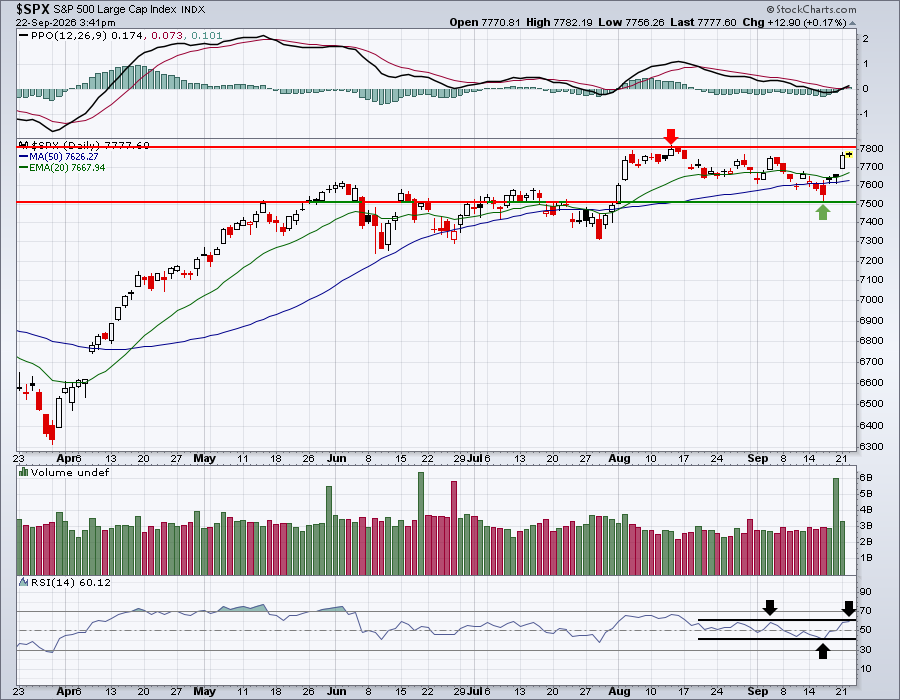
Resistance has not been cleared, so we remain range bound between price support at 7507 and price resistance at 7807. The action this week has felt bullish, but we've seen no breakout. Recently, the action felt bearish, but we remained above the lows established in June and July. The low last Wednesday now establishes another key level of price support, in my opinion.
Note also the behavior of the RSI. During uptrends, the range is usually from 40 to 70+. During downtrends, the range is usually 30 and below up to 60. The black arrows mark tops at 60 and bottoms at 40. The RSI can't make up its mind if we're in an uptrend or downtrend. I'm treating it as sideways consolidation, until proven otherwise.
Sectors/Industries
I've been watching a few of the interest-rate-sensitive areas since the Fed rate hike announcement last Wednesday. If Wall Street believed this was a "one and done" rate hike, I think we'd have seen a very bullish reaction in small caps (IWM), regional banks (KRE), homebuilders (XHB), and transports (IYT). Instead, what we've seen is further deterioration in the relative strength of each of these areas:
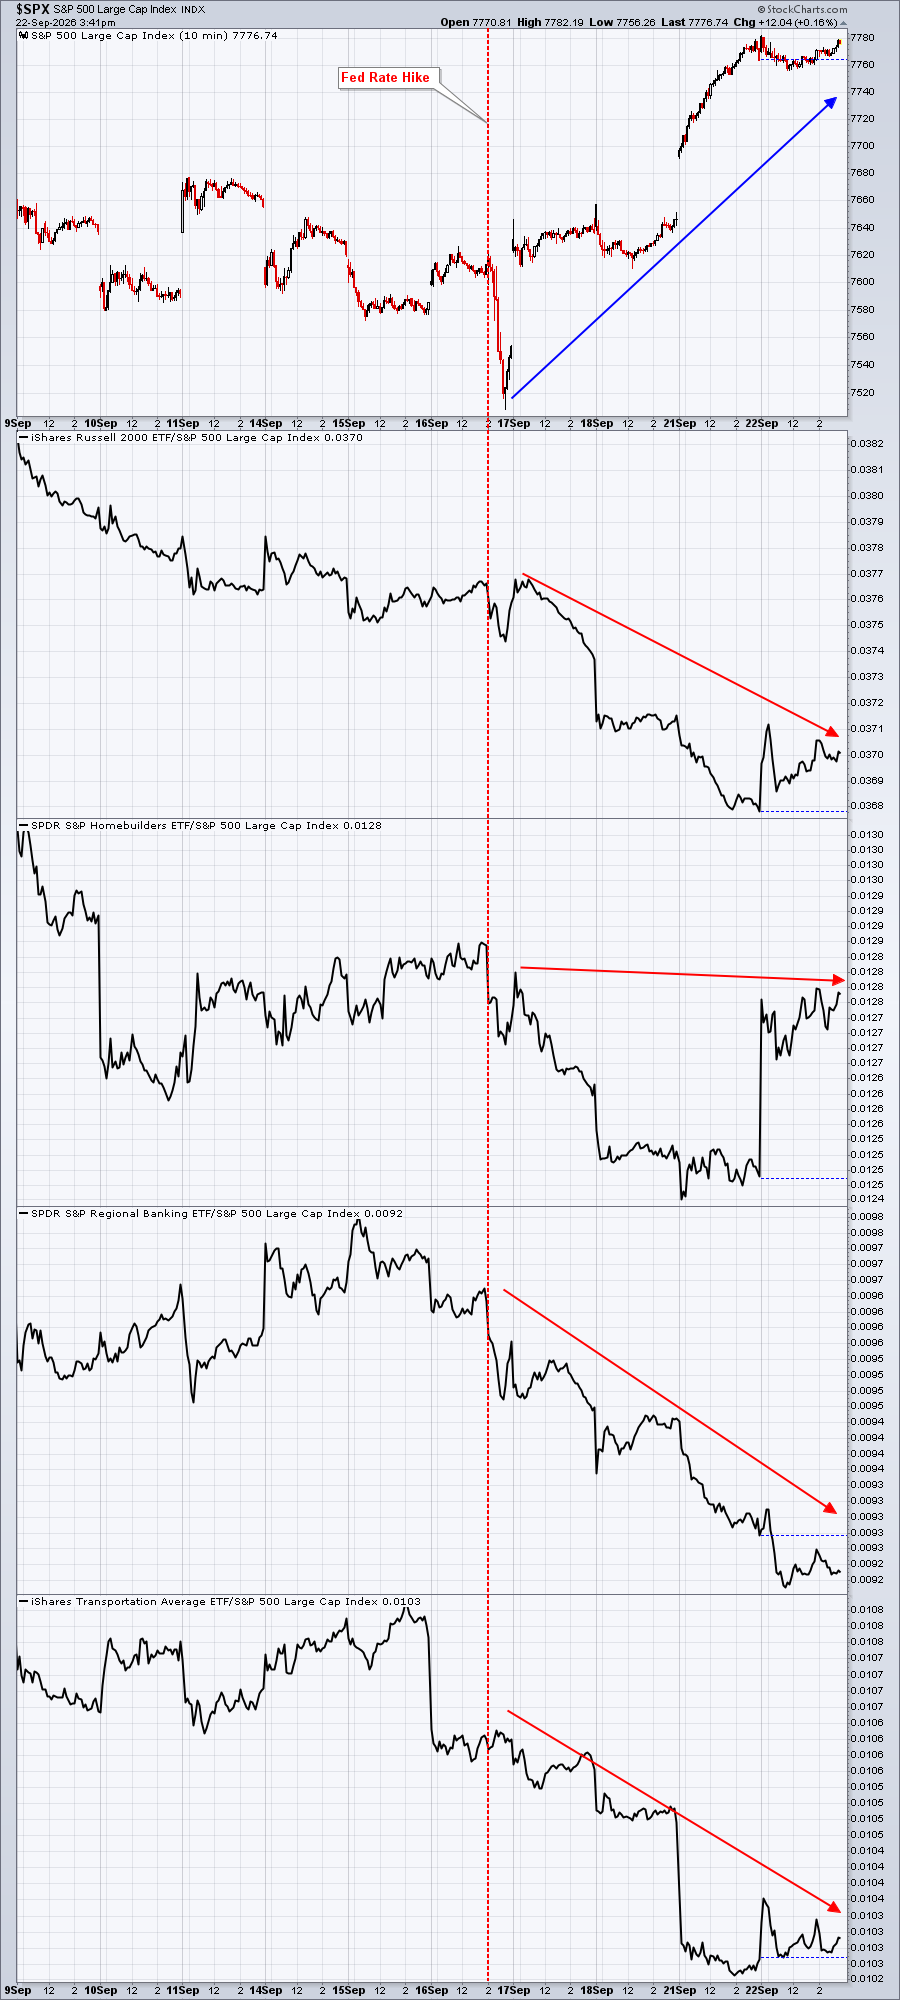
Based on this chart alone, I'd say there's a very good chance that we're going to see at least one more rate hike. When money begins to rotate heavily into these groups, there's a much better chance that we'll get better news ahead on the interest rate front.
ChartLists and Trading Strategies
The technical signals since the Fed rate hike last Wednesday have been very encouraging. Money has rotated in mostly "risk on" fashion, which suggests that it's very unlikely that we'll see any type of extended selling, if we see any at all. Interest-rate-sensitive areas of the market remain under performers, but that's to be expected when rates are raised and expected to go even higher.
As always, I'd focus on minimizing risk. That could mean trading ETFs instead of individual stocks. It could also mean being more vigilant about only buying stocks at or very near support. It could mean smaller position sizes.
While not a primary indicator, I still do worry this time of year, given the long-term tendency for market weakness in late summer into early autumn.
I ran a scan against Raised Guidance ChartList (RGCL) using RSI between 39 and 44 and a SCTR score > 75. It returned the following stocks:
CNC, FA, SPT, INTA, JHX, BOX, CPAY, VAC, BAX, EAT, SJM, SLG, PRGS, RS, CSCO
A few of these are testing their 50-day SMAs, like SPT, INTA, BOX, SJM. Here's a chart of the first two:
SPT
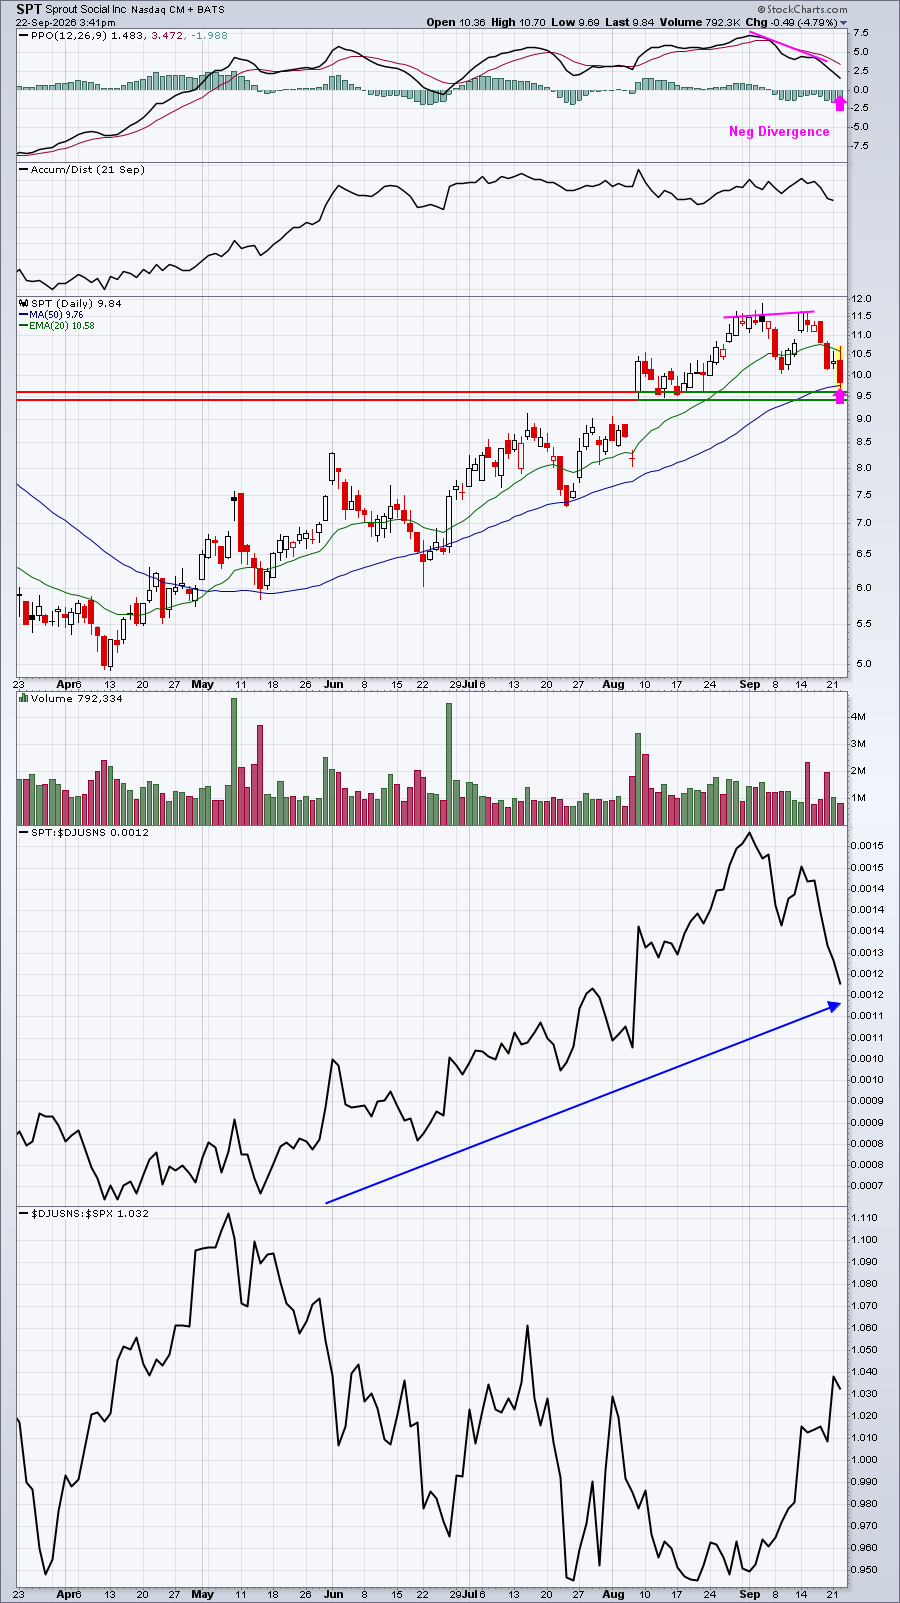
A recent negative divergence warned of slowing momentum and so I'd typically look for a 50-day EMA test, which is what we're getting today. I've drawn two gap/price support lines as well.
INTA
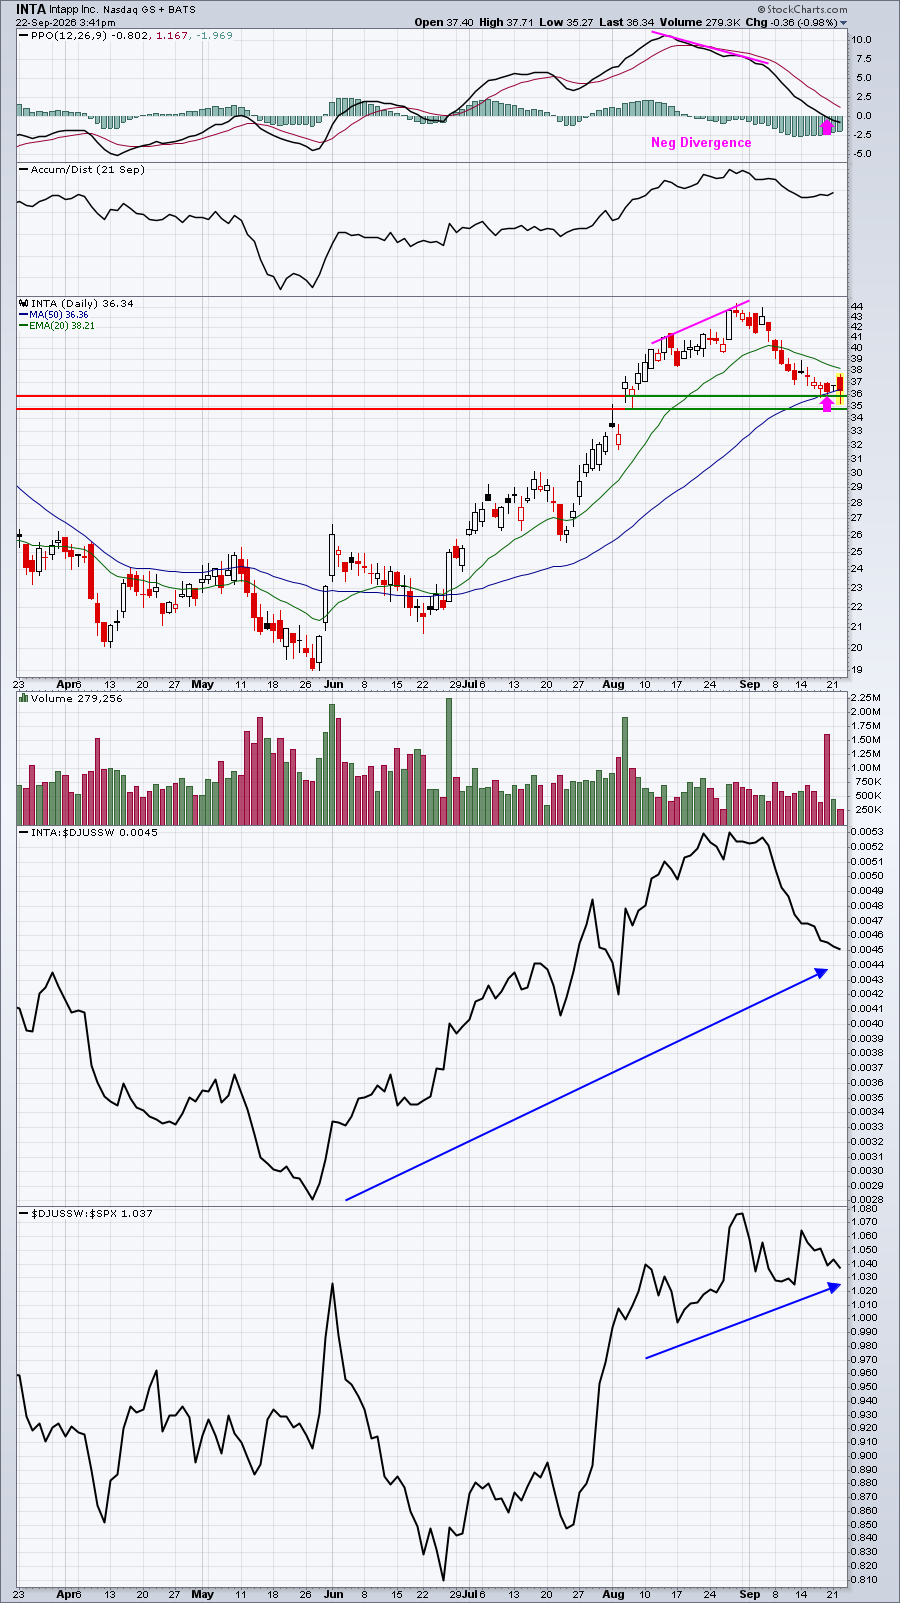
INTA showed a similar negative divergence and it, too, has fallen back to test its 50-day SMA. INTA's PPO has returned to centerline support as well. Throw in the test of key gap/price support and I like the reward to risk here.
Disclosure: I bought shares in INTA today. I'll sell on a close beneath 35.
Upcoming Earnings
Upcoming Earnings and Upcoming Earnings Relative Strength ChartLists are produced for EB.com members to track upcoming earnings reports and provide them to you via ChartLists throughout earnings season. We will begin producing Upcoming Earnings ChartLists again on a weekly basis when Q3 earnings season begins in mid-October.
Economic Reports
None
Happy trading!
Tom