
EB Monthly Seasonality Report - February 2021
A Look Back At January 2021
Below are the 20 stocks that were favored for the month of January and how they performed from their December 31st close through their Friday, January 29th close:
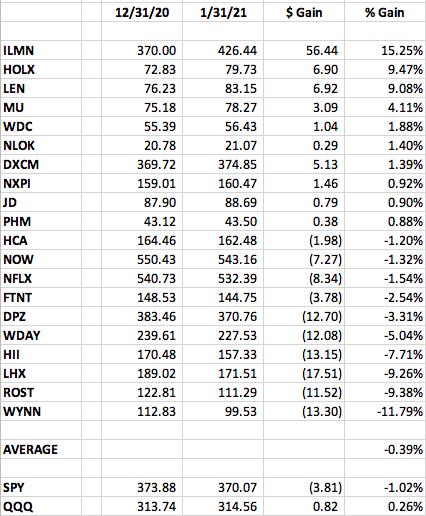
10 stocks outperformed, while 10 stocks underperformed. The average return of the 20 stocks was -0.39%, which was better than the SPY's (ETF that tracks S&P 500) January return of -1.02%. However, they trailed the QQQ's (ETF that tracks NASDAQ 100) positive return of 0.26%
The best performer from our January group was Illumina (ILMN), which we had listed as the 2nd best seasonal stock for January:
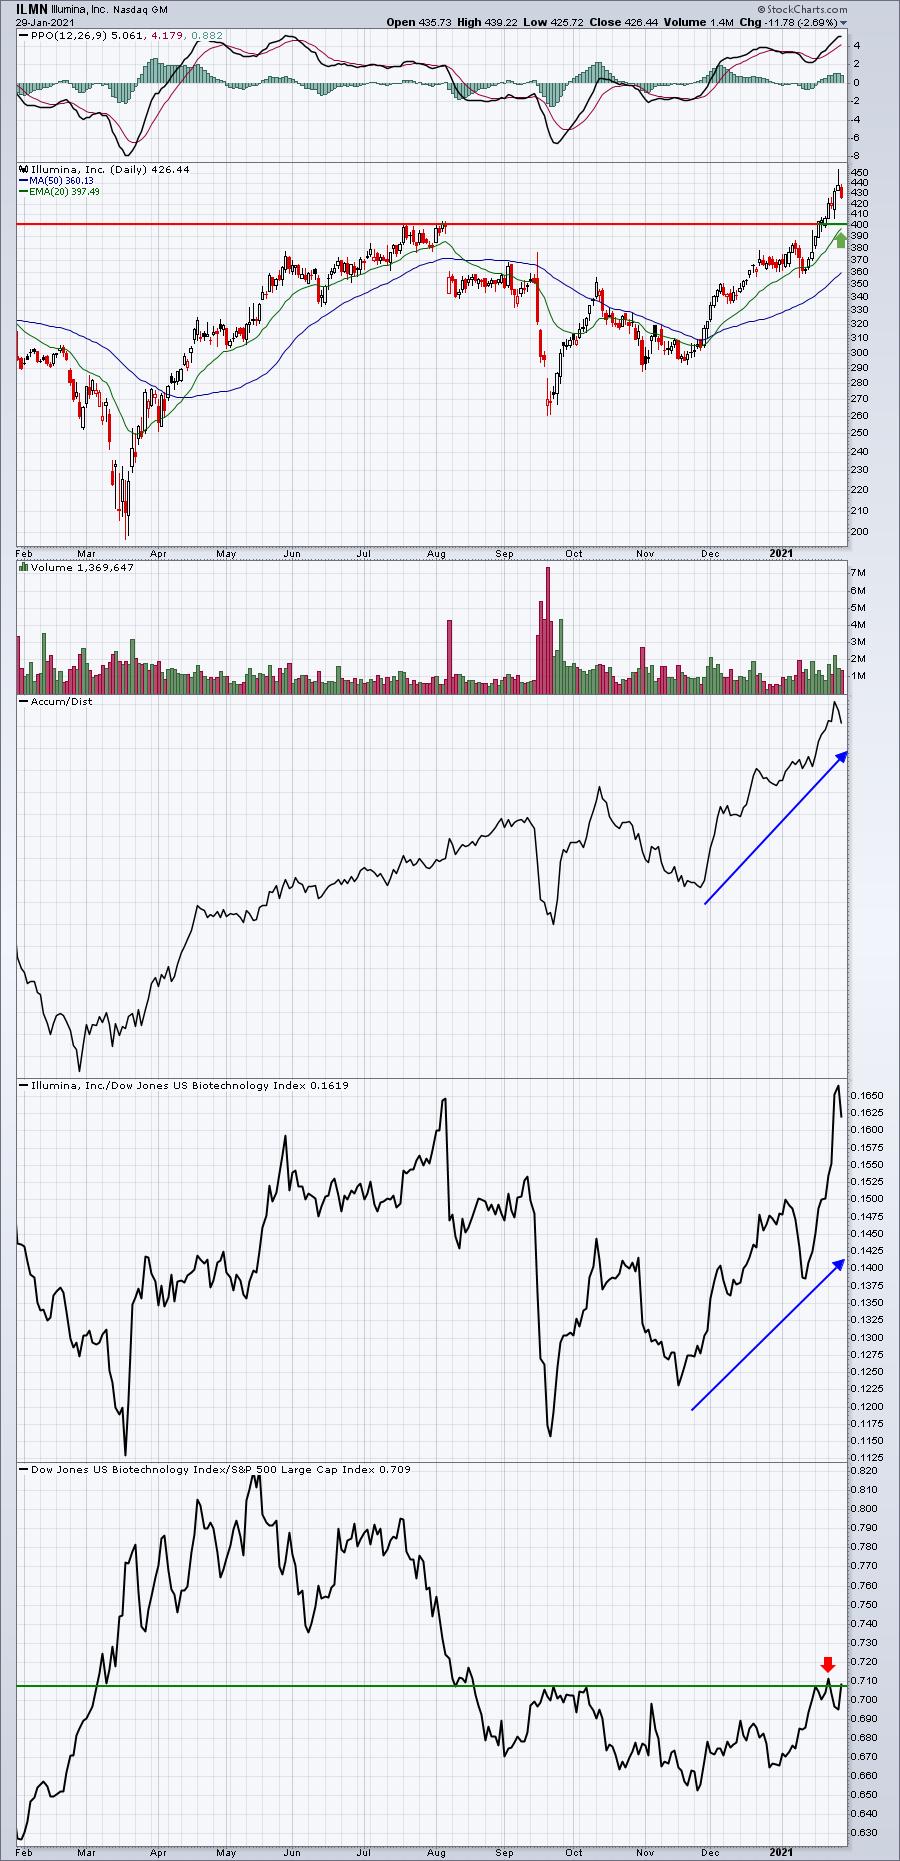
ILMN's strong performance was also accompanied by what appeared to be solid accumulation as the AD line soared as well.
A Look Ahead At February 2021
S&P 500 Performance
Here's a breakdown of the annualized performance of the S&P 500 (since 1950) during the month of February:
February 1-3: +34.85%
February 4-10: -18.64%
February 11-15: +30.37%
February 16-29: -7.30%
The stock market trades during February in similar fashion to most other calendar months. We typically start the month strong, see profit taking, enjoy a second surge toward the middle of the month, and then further weakness into options expiration and the end of the month.
Sector Performance
Before we look at individual stocks, let's get an overview of how the various sectors and industries have performed during February over the past decade (during this bull market):
Sector Heat Map:
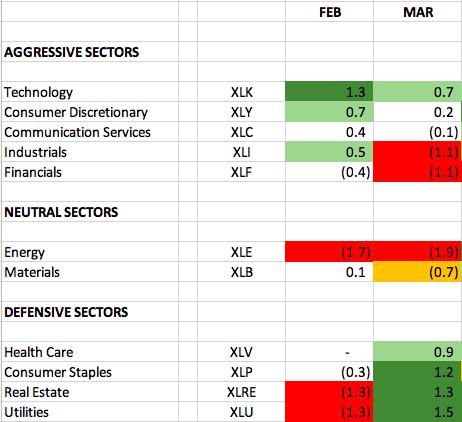
The numbers reflect how much a sector, on average, outperforms or underperforms the S&P 500 over the past 10 years. The dark green shaded area shows significant outperformance (1.0 or greater). The light green shaded areas shows solid outperformance (from 0.5 to 1.0). The orange shaded area shows underperformance (-0.5 to -1.0). The red shaded area shows significant underperformance (-1.0 or greater). Where there is no shading, there tends to be more neutral performance (-0.4 to 0.4).
The aggressive sectors have a history of outperforming in February, with technology (XLK) leading the way. Meanwhile, the other aggressive sectors tend to perform better than the S&P 500 in February (with financials the lone exception), so remaining aggressive in February makes sense from a historical perspective. Energy (XLE) and the defensive sectors tend to struggle in February.
Industry Performance
Let's look at the industry group Heat Map for the best aggressive sector in February - technology (XLK):
Heat Map - XLK:
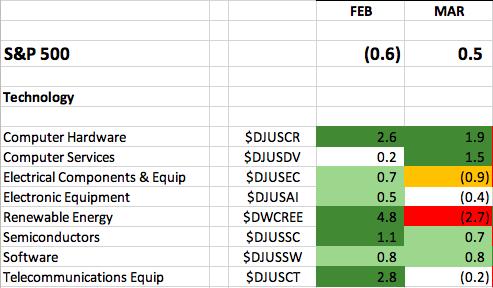
Two industry groups that have been leaders of this current bull market - renewable energy ($DWCREE) and computer hardware ($DJUSCR) - tend to perform exceptionally well in February. A lagging industry group in 2020 that's recently awoken - telecom equipment ($DJUSCT) - could be poised to rally further based on history.
Outside of technology, here are other notable industry groups from other aggressive sectors that have a tendency to perform well during February:
Consumer discretionary:
- Travel & tourism, apparel retailers, hotels, footwear
Communication services:
- Media agencies
Industrials:
- Marine transportation , aerospace, industrial suppliers, defense
Financials:
- Insurance brokers, finance administration, consumer finance
Stock Performance
We've selected our Top 20 seasonal stocks for February from the S&P 500 and NASDAQ 100. Several names represent sectors and industry groups that have been discussed above. Others simply stand out in January on their own.
The stocks this month, in order of average February return, are as follows:
ETSY, ANET, PAYC, SPLK, BKNG, FLT, NXPI, KEYS, CF, FTNT, MELI, APTV, DPZ, CRM, NFLX, ZBRA, AON, STX, ANSS, PGR.
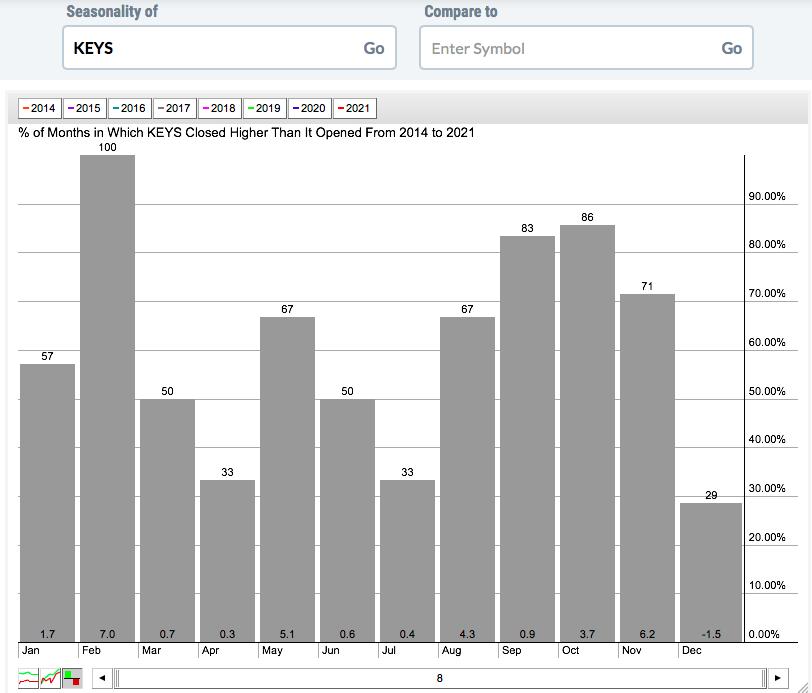
Last month, I jinxed HII after I pointed out that the stock had been up in every January since going public. Well, let's see if I can jinx KEYS, which has yet to see a down February:
A "Seasonality - February 2021" ChartList should be available for download on our website by Monday morning. You must be a StockCharts.com Extra or Pro member to download our ChartLists. Basic members and non-StockCharts.com members can view the charts one at a time.
Happy trading!
Tom