
EB Monthly Seasonality Report - March 2021
A Look Back At February 2021
Below are the 20 stocks that were favored for the month of February and how they performed from their January 31st close through their Friday, February 26th close:
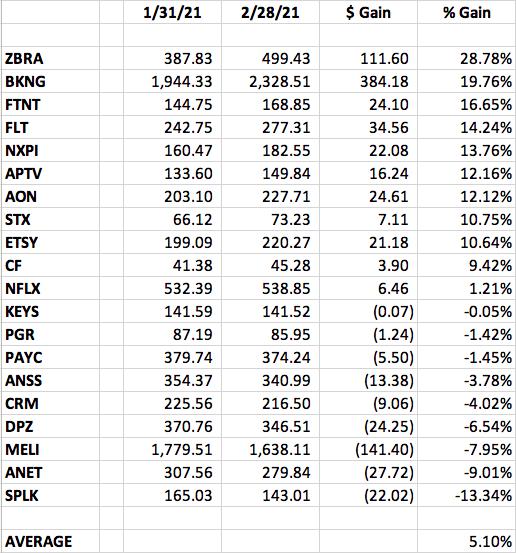
10 stocks outperformed the S&P 500's February return of 2.78%, all by a very wide margin. Also, the QQQ (ETF tracking the NASDAQ 100) lost 0.13% during February. So the average gain of the February seasonality portfolio of 5.10% was very solid. 9 stocks on our list gained 10% or more, led by ZBRA and BKNG. These two were ranked #16 and #5 on our February list, respectively.
The best performer from our February group was Zebra Technologies, which was in our last Strong AD Portfolio and currently resides in this quarter's Aggressive Portfolio:
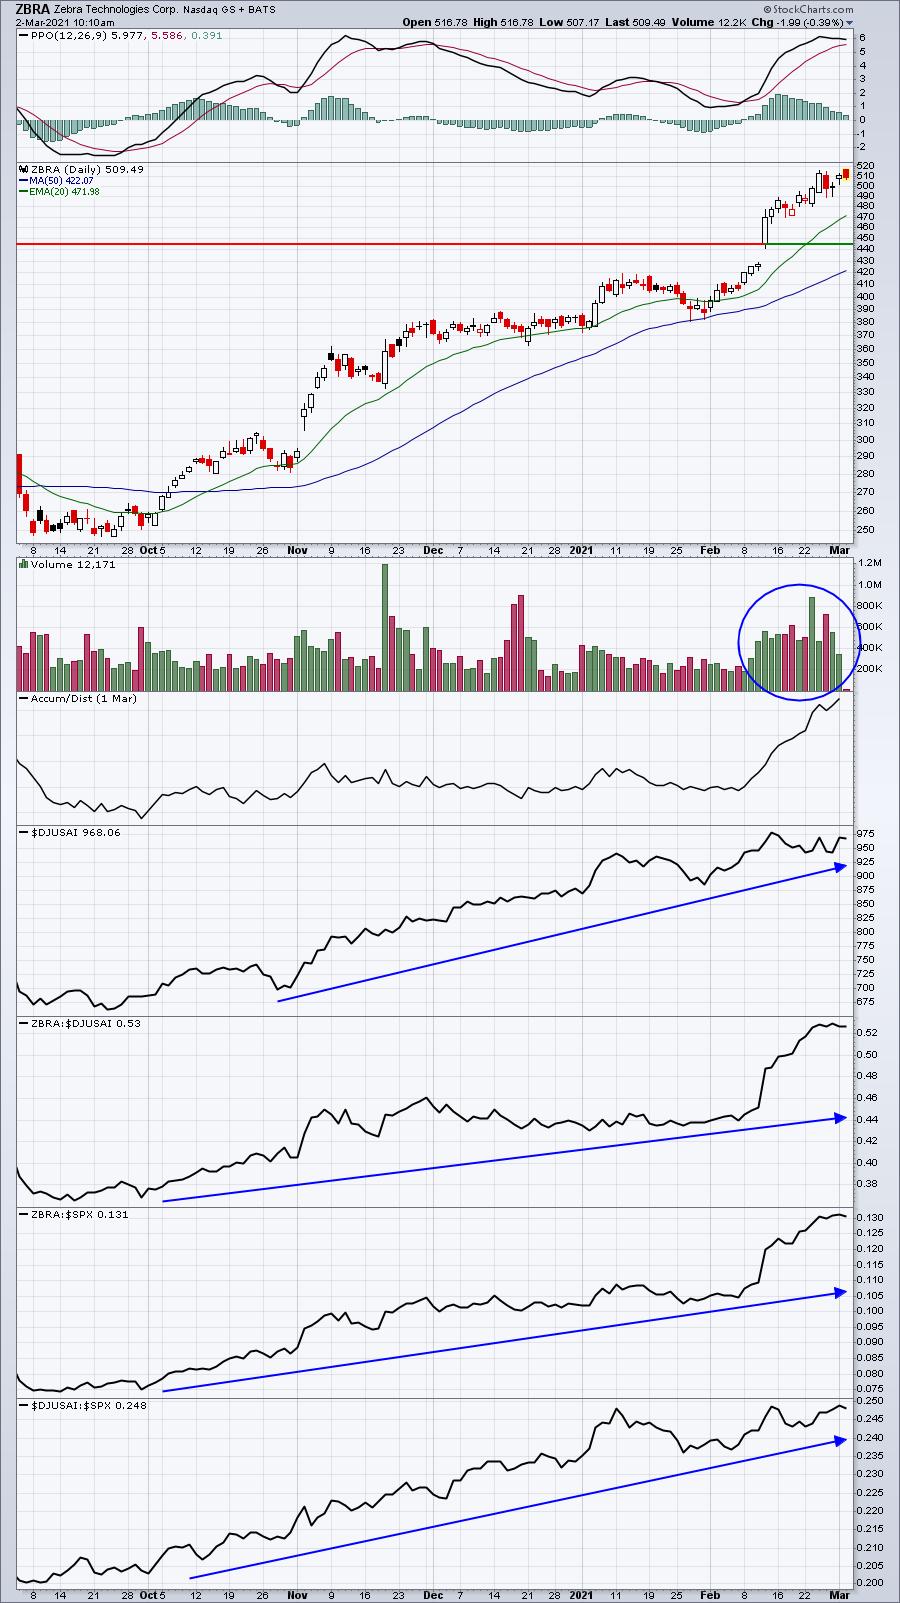
ZBRA continues to show excellent relative strength in one of the strongest industry groups in the stock market - electronic equipment ($DJUSAI).
A Look Ahead At March 2021
S&P 500 Performance
Here's a breakdown of the annualized performance of the S&P 500 (since 1950) during the month of March:
March 1-5: +34.85%
March 6-9: -18.64%
March 10-18: +30.37%
March 19-31: -7.30%
The stock market trades during March in similar fashion to most other calendar months. We typically start the month strong, see profit taking, enjoy a second surge toward the middle of the month, and then further weakness into options expiration and the end of the month. If there's one difference, I'd say it's how we close out the month. Most months see higher prices in the last few days of the calendar month in anticipation of new money entering the market on the 1st of the month. March hasn't shown the historical tendency to rise later in the month.
Sector Performance
Before we look at individual stocks, let's get an overview of how the various sectors and industries have performed during March over the past decade (during this bull market):
Sector Heat Map:
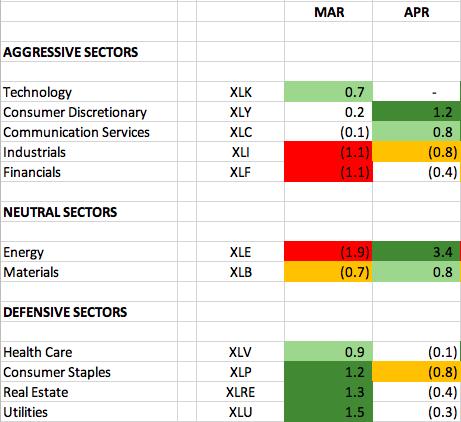
The numbers reflect how much a sector, on average, outperforms or underperforms the S&P 500 over the past 10 years. The dark green shaded area shows significant outperformance (1.0 or greater). The light green shaded areas shows solid outperformance (from 0.5 to 1.0). The orange shaded area shows underperformance (-0.5 to -1.0). The red shaded area shows significant underperformance (-1.0 or greater). Where there is no shading, there tends to be more neutral performance (-0.4 to 0.4).
March is not a great month for U.S equities. That helps to explain why defensive sectors tend to perform best. If we have a solid run higher in the first week of March, it wouldn't be unwise to think a bit more defensively throughout the balance of the month given the historical relative strength of defensive sectors during the month.
Industry Performance
Let's look at the industry group Heat Map for the best aggressive sector in March - technology (XLK):
Heat Map - XLK:
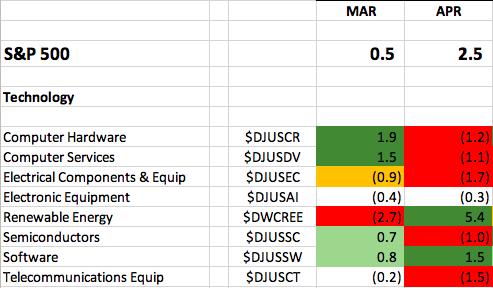 The two industry groups that show the most March relative strength - computer hardware ($DJUSCR) and computer services ($DJUSDV) - both are currently trading beneath their declining 20-day EMAs. They'll need to first climb above that key moving average before continuing their March dominance.
Outside of technology, here are other notable industry groups from other aggressive sectors that have a tendency to perform well during March:
Consumer discretionary:
- Toys, broadline retailers, specialty retailers
Communication services:
- Mobile telecommunications
Industrials:
- Trucking, delivery services, business support services
Financials:
- Specialty finance
Those provide some historical strength among the aggressive sectors. But as I mentioned above, defensive sectors tend to lead during March. Among defensive sectors, utilities show the best March relative strength. Here's a breakdown:
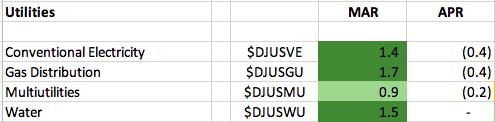
In health care, health care providers ($DJUSHP) stand out, while food products ($DJUSFP) and personal products ($DJUSCM) show a solid March track record among consumer staples. The best real estate industry group has been specialty REITs ($DJUSSR).
Stock Performance
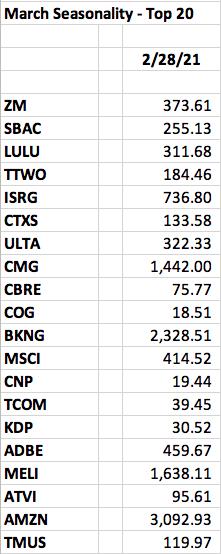
We've selected our Top 20 seasonal stocks for March from the S&P 500 and NASDAQ 100. Several names represent sectors and industry groups that have been discussed above. Others simply stand out in March on their own.
The stocks this month, in order of average March return, are as follows:
I now have a two-month streak of jinxing one of our seasonality stocks. In January, I pointed out that HII had never had a down January. Then, of course, it proceeded to move lower in January 2021. In February, I indicated that KEYS had never had a down February. What happened? It lost 7 cents during the month of February. While there were no March seasonality stocks that have gone up every March, I figured I'd point out one company whose March track record really stands out - Ulta Beauty, Inc. (ULTA):
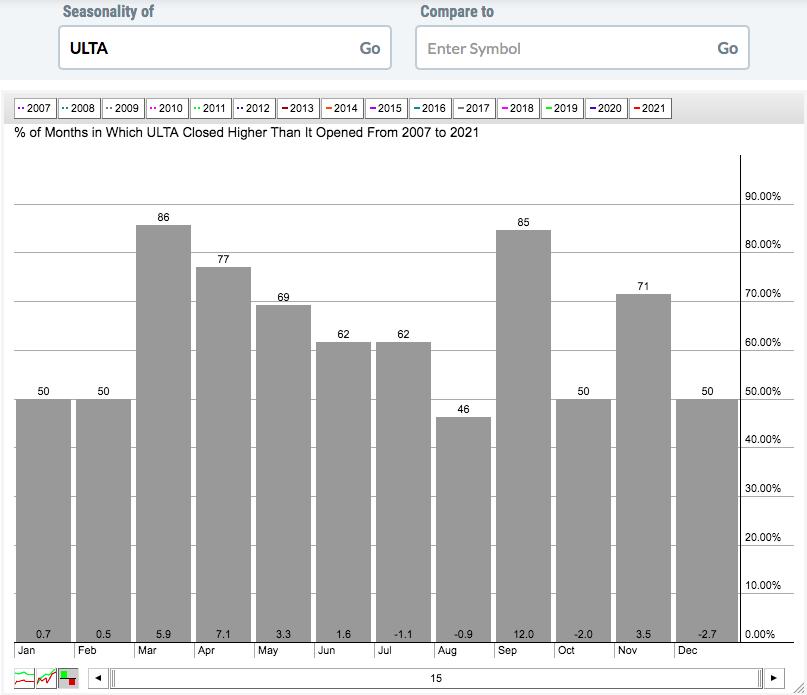
There's no perfection here, but ULTA clearly enjoys the trip into Spring each year. March and April have averaged gaining 13.0% each year for the past 15 years! That is seasonal strength to at least be aware of.
A "Seasonality - March 2021" ChartList is available for download on our website. You must be a StockCharts.com Extra or Pro member to download our ChartLists. Basic members and non-StockCharts.com members can view the charts one at a time. The charts have been annotated with one or two key support levels to watch.
Happy trading!
Tom