
EB Monthly Seasonality Report - May 2021
Delayed Report
I apologize for not getting to this report sooner. I like to send it out by the beginning of the month, but I've been inundated with earnings season and projects. It's probably a good thing that it wasn't sent out timely, though, because the market is doing its best to move completely opposite historical norms thus far in May.
A Look Back At April 2021
Below are the 20 stocks that were favored for the month of April and how they performed from their March 31st close through their April 30th close:
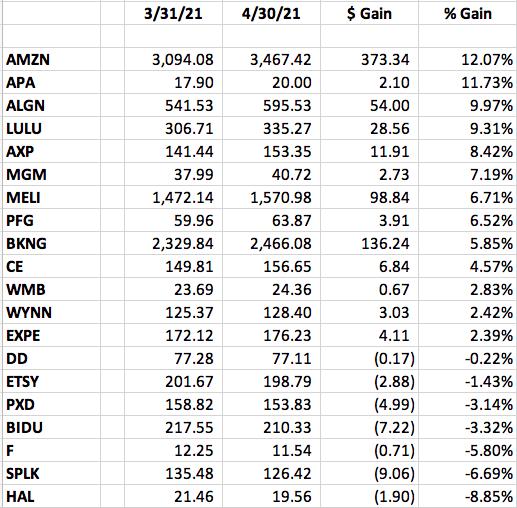
9 stocks outperformed the SPY's April return of 5.29%. The QQQ (ETF tracking the NASDAQ 100) gained 4.13% in April, .
The best performer from our April group was AMZN, which used its April seasonal tailwinds all the way to test key price resistance:
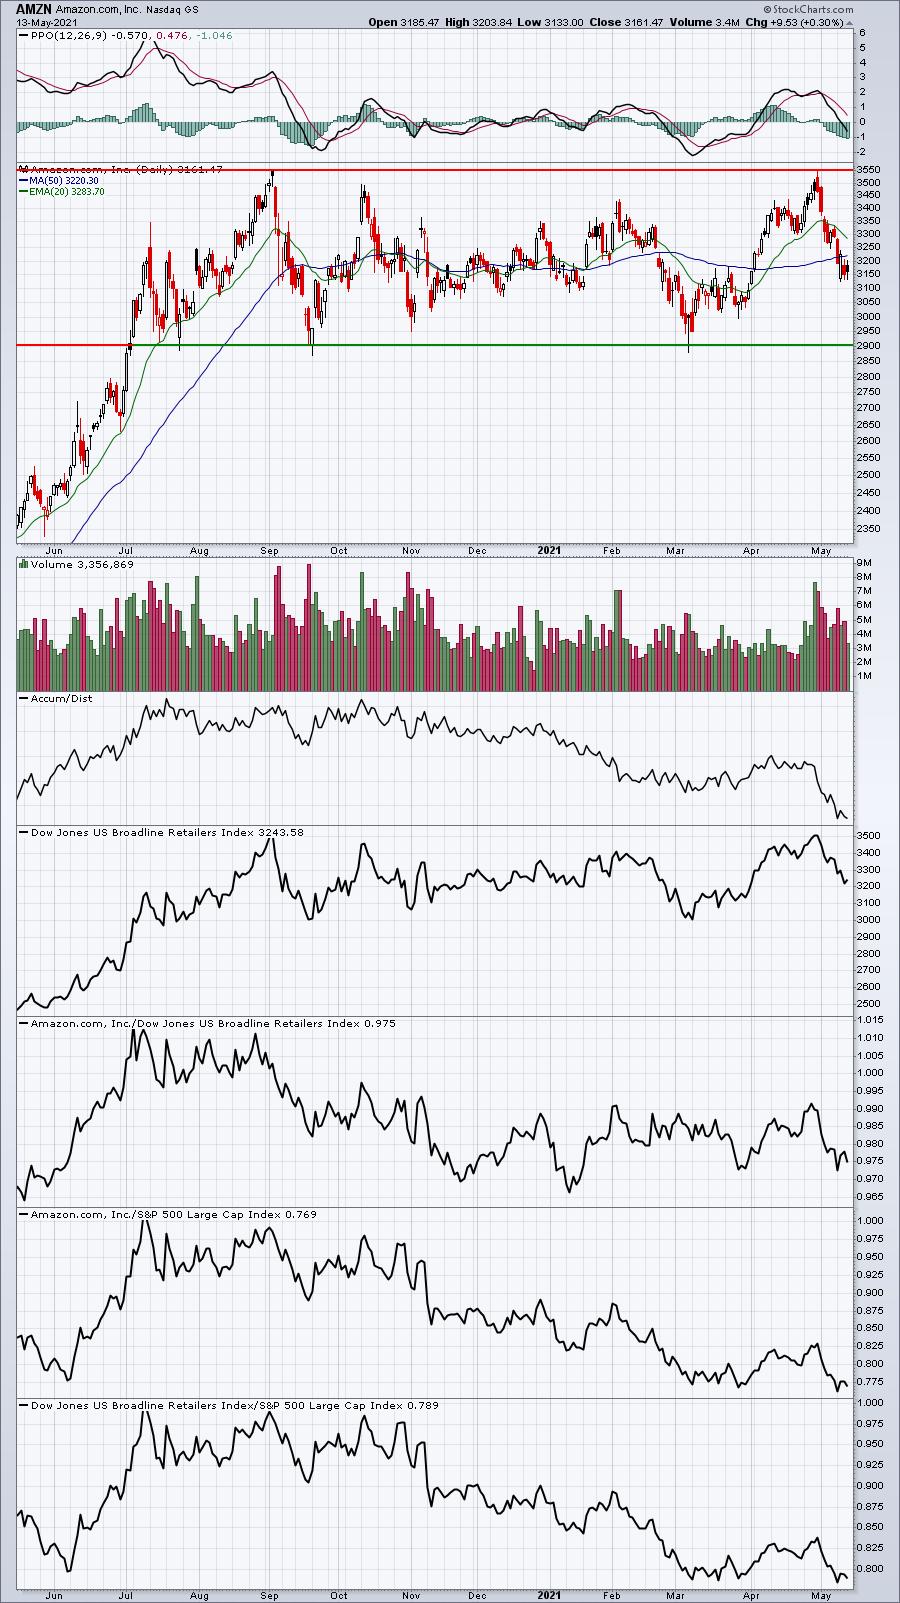
Note that AMZN's big April wasn't really supported by its AD line, which barely budged higher. However, the selling in May has been accompanied by a free-falling AD line.
A Look Ahead At May 2021
S&P 500 Performance
Here's a breakdown of the annualized performance of the S&P 500 (since 1950) during the month of May:
May 1-5: +32.77%
May 6-10: -11.37%
May 11-18: -12.97%
May 19-25: -22.59%
May 26-30: +31.92%
The stock market trades during May in strange fashion vs. most other calendar months. The biggest difference is that once we get past the 5th of the month, historically we don't re-enter a bullish period until May 26th. Most calendar months see strength from the 11th through the 18th, but that hasn't been the case in May. Generally, however, we open and close the month on very strong notes.
Sector Performance
Before we look at individual stocks, let's get an overview of how the various sectors and industries have performed during May (and June) over the past decade (during this bull market):
Sector Heat Map:
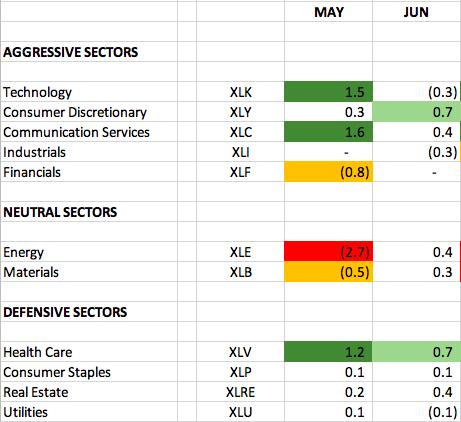
The numbers reflect how much a sector, on average, outperforms or underperforms the S&P 500 over the past 10 years. The dark green shaded area shows significant outperformance (1.0 or greater). The light green shaded areas shows solid outperformance (from 0.5 to 1.0). The orange shaded area shows underperformance (-0.5 to -1.0). The red shaded area shows significant underperformance (-1.0 or greater). Where there is no shading, there tends to be more neutral performance (-0.4 to 0.4).
We typically see relative strength in technology (XLK), communication services (XLC), and health care (XLV), and relative weakness in energy (XLE) and materials (XLB), but that has not been the case in the first half of May this year.
Industry Performance
We know technology has been weak of late, so let's look at the industry group Heat Map for another strong May sector - health care (XLV):
Heat Map - XLV:
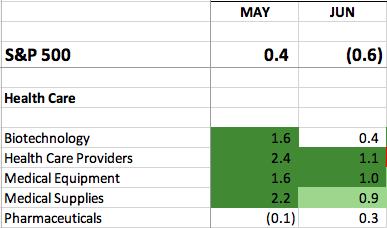
Health care is typically a strong relative sector in both May and June with several industries performing well. Of course, as May would have it, the worst health care industry group during May has been pharma ($DJUSPR), which has been the best group in the industry the past two weeks.
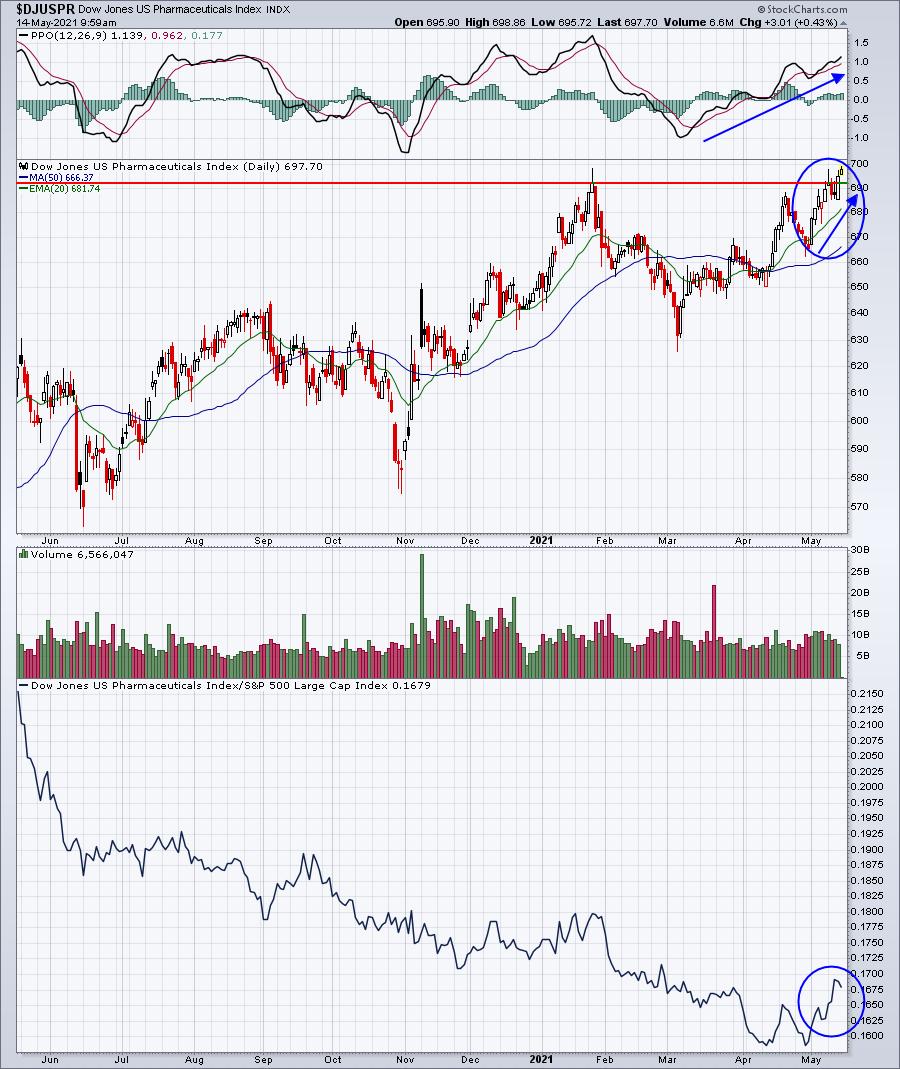
The fact that we're seeing few of our May norms is a major reason why I use seasonality to confirm or refute what I'm seeing technically. I don't use seasonality as a primary reason to buy or sell. Feel free to use it as you see fit, but, for me, it's a secondary indicator.
Here are the industry groups within the other 10 sectors that typically show May relative strength:
Technology (XLK):
- computer hardware, semiconductors
Consumer discretionary (XLY):
- toys (love May - average beating SPY by 5%), home construction, specialized consumer services
Communication services (XLC):
- internet, mobile telecommunications
Industrials (XLI):
- building materials & fixtures, business support services, defense, trucking, waste & disposal services
Financials (XLF):
- mortgage finance, insurance brokers, specialty finance, financial administration
Consumer staples (XLP):
- none
Real estate (XLRE):
- residential REITs
Utilities (XLU):
- none
Energy (XLE):
- none
Materials (XLB):
- none
Every year is different and heading into May, both energy (XLE) and materials (XLB) were strong and they continue to be. Meanwhile, technology (XLK), which typically gets a boost in May, couldn't be much weaker on a relative basis.
Stock Performance
We've selected our Top 20 seasonal stocks for May from the S&P 500 and NASDAQ 100. Several names represent sectors and industry groups that have been discussed above. Others simply stand out in May on their own.
The stocks this month are as follows:
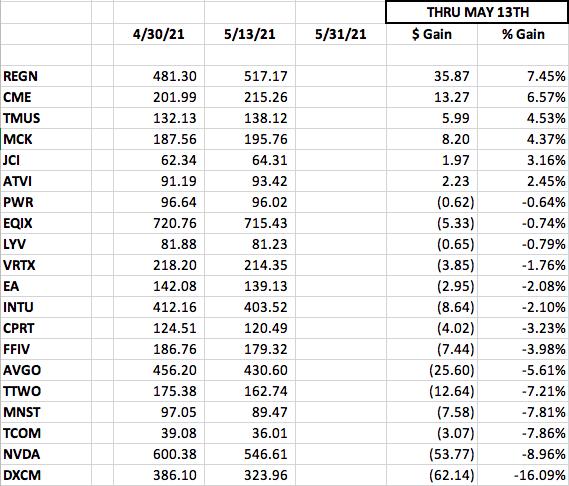
Because I'm releasing this list of stocks mid-month, I've provided the prices as of April 30th and also as of yesterday's close to see their performance thus far in May. I've sorted the list in order of May-to-date performance so that you can see what's been working so far and what hasn't.
A "Seasonality - May 2021" ChartList will be available for download on our website later today. You must be a StockCharts.com Extra or Pro member to download our ChartLists. Basic members and non-StockCharts.com members can view the charts one at a time. The charts have been annotated with one or two key support levels to watch.
Happy trading!
Tom