
EB Monthly Seasonality Report - July 2021
A Look Back At June 2021
Below are the 20 stocks that were favored for the month of June and how they performed:
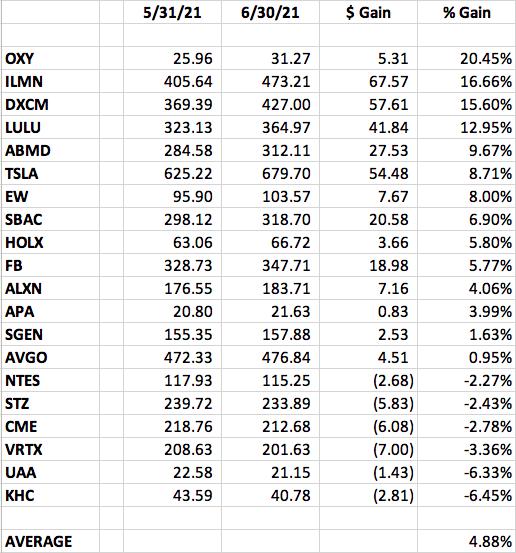
12 of the 20 stocks provided outperformed the S&P 500's return of +2.24% during June. The average return of +4.88% more than doubled that S&P 500 return.
The best performer from our June group was OXY, which had a stellar month and gained more than 20% for the month. It appears to have completed the right side of a cup:
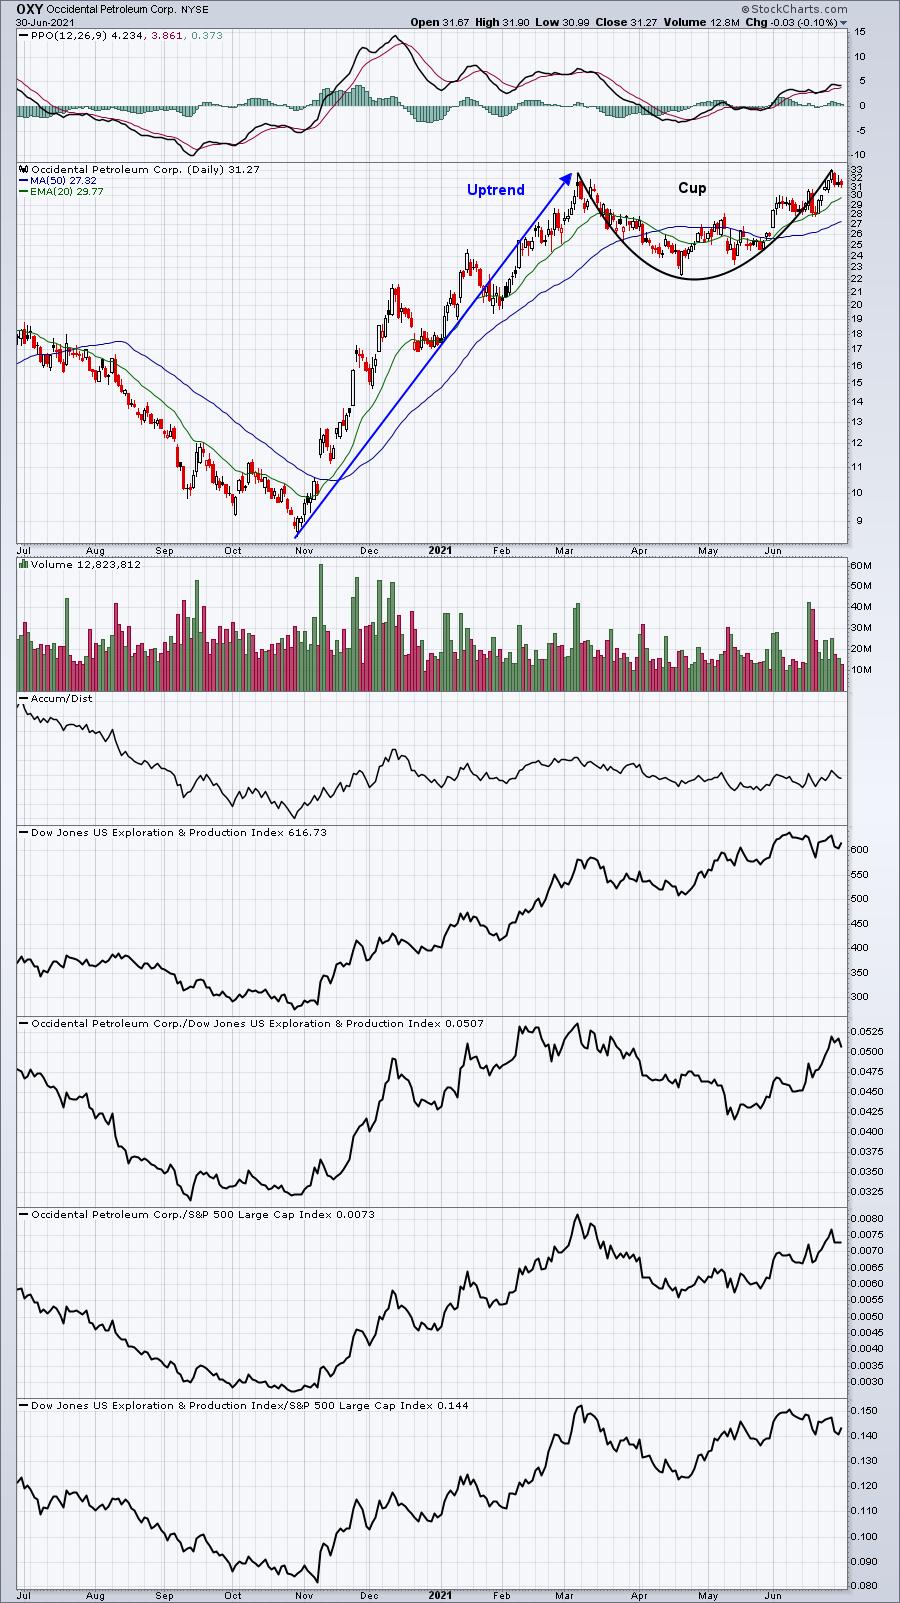
Energy (XLE, +4.23%) trailed only technology (XLK, +6.89%) among sectors during June, so that certainly provided solid tailwinds for OXY.
A Look Ahead At July 2021
S&P 500 Performance
Here's a breakdown of the annualized performance of the S&P 500 (since 1950) during the month of July:
July 1-17: +25.71%
July 17-24: -17.53%
July 25-31: +18.89%
The stock market trades during July in much the same manner it does throughout the year, although there isn't much of a pause from the 7th through the 10th. The S&P 500 typically performs very well during the first half of the month as earnings season approaches. This is typical of all four quarters. The anticipation of earnings season many times will result in a "buy on rumor, sell on news" strategy.
Sector Performance
Before we look at individual stocks, let's get an overview of how the various sectors and industries have performed during July (and August) over the past decade (during this secular bull market):
Sector Heat Map:
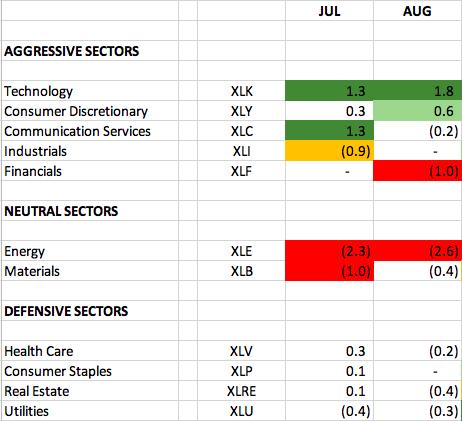
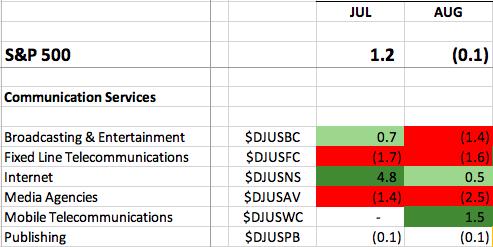
The numbers reflect how much a sector, on average, outperforms or underperforms the S&P 500 over the past 10 years. The dark green shaded area shows significant outperformance (1.0 or greater). The light green shaded areas shows solid outperformance (from 0.5 to 1.0). The orange shaded area shows underperformance (-0.5 to -1.0). The red shaded area shows significant underperformance (-1.0 or greater). Where there is no shading, there tends to be more neutral performance (-0.4 to 0.4).
We typically see relative strength in technology (XLK) and communication services (XLC) during July, while energy (XLE), materials (XLB), and industrials (XLI) have been more likely to underperform. Rotation into earnings season generally favors the more aggressive sectors throughout July and August.
Industry Performance
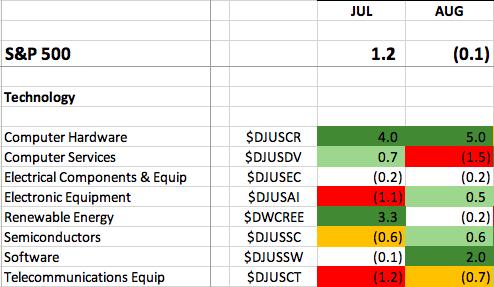
Let's take a look at the industry heat map within both technology and communication services to drill down to the best seasonal strength:
Technology:
Communication Services:
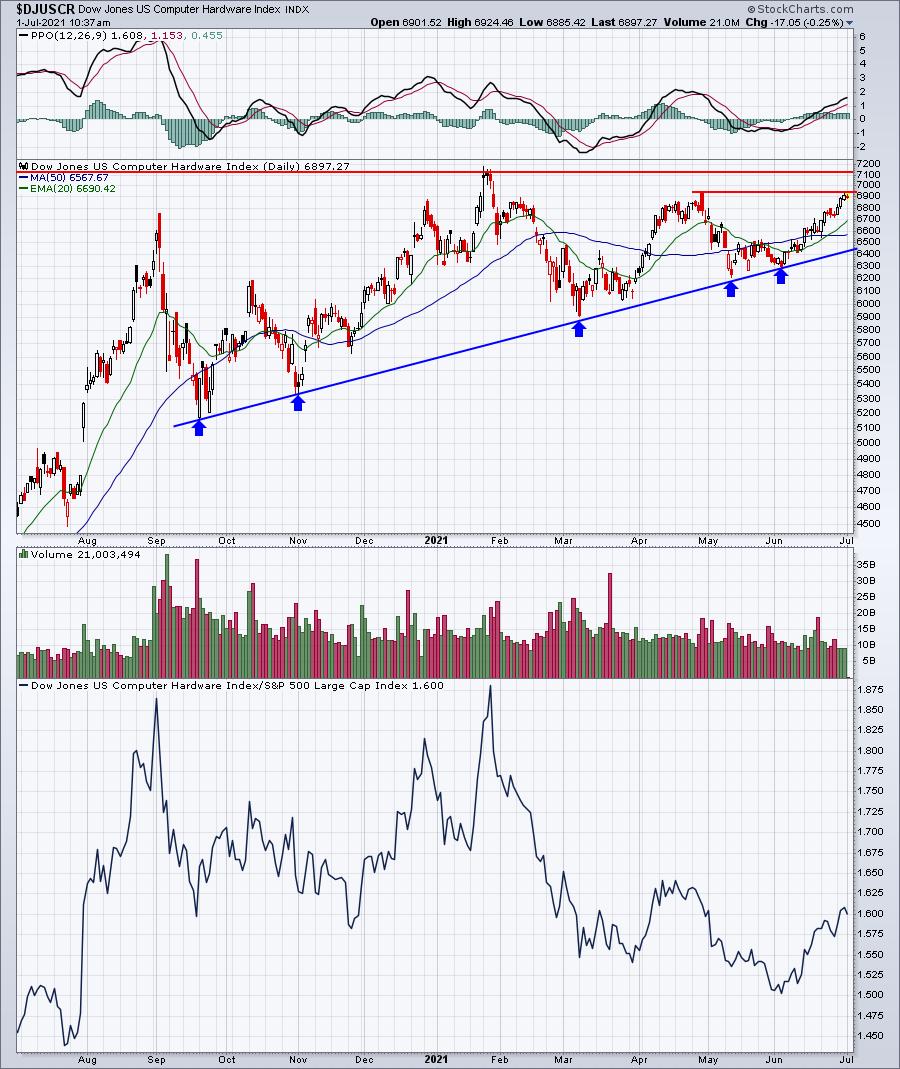
Computer hardware ($DJUSCR) loves July and it's trending higher heading into the month. I'd be looking for a test of price resistance just above 7100:
From the industry group heat map above, you can see that internet ($DJUSNS) also loves July and this group looks solid technically, so I'd be expecting a further advance.
Consumer discretionary (XLY):
- broadline retail, travel & tourism, recreational products
Industrials (XLI):
- delivery services
Financials (XLF):
- specialty finance
Health care (XLV):
- biotechnology
Consumer staples (XLP):
- none
Real estate (XLRE):
- none
Utilities (XLU):
- none
Energy (XLE):
- none
Materials (XLB):
- none
Stocks for July
We've selected our Top 20 seasonal stocks for July from the S&P 500 and NASDAQ 100. Several names represent sectors and industry groups that have been discussed above. Others simply stand out in July on their own. There's a definite bias this month towards biotechnology stocks, which love the month of July historically. The success or failure of this list in July will be largely dependent on biotech performance.
The stocks this month are as follows:
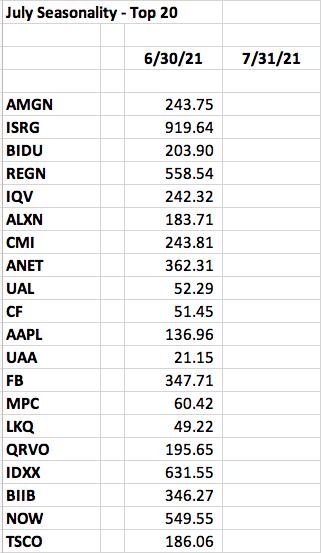
A "Seasonality - July 2021" ChartList will be available for download on our website over the weekend. You must be a StockCharts.com Extra or Pro member to download our ChartLists. Basic members and non-StockCharts.com members can view the charts one at a time. The charts have been annotated with one or two key support levels to watch.
Happy trading!
Tom