
EB Monthly Seasonality Report - September 2021
A Look Back At August 2021
Below are the 20 stocks that were favored for the month of August and how they performed:
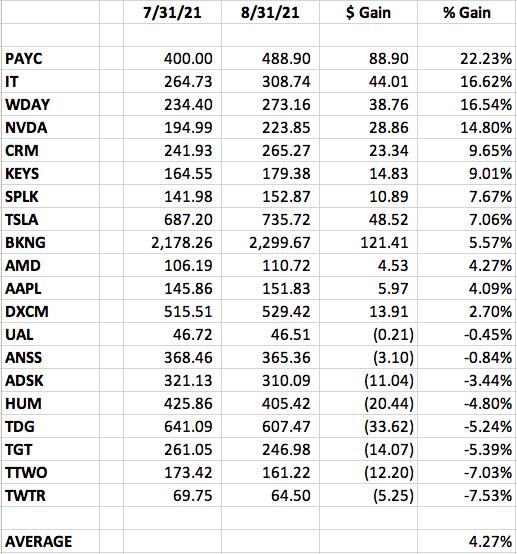
11 of the 20 stocks provided outperformed the S&P 500's return of +2.98% during August. The average return of +4.27% was considerably higher than the S&P 500 return.
The best performer from our August group - and there were several excellent performers - was Paycom Software (PAYC), which reported quarterly results, gapped up, and then traded higher for much of August. After clearing the December 2020 high, I see PAYC heading higher from here:
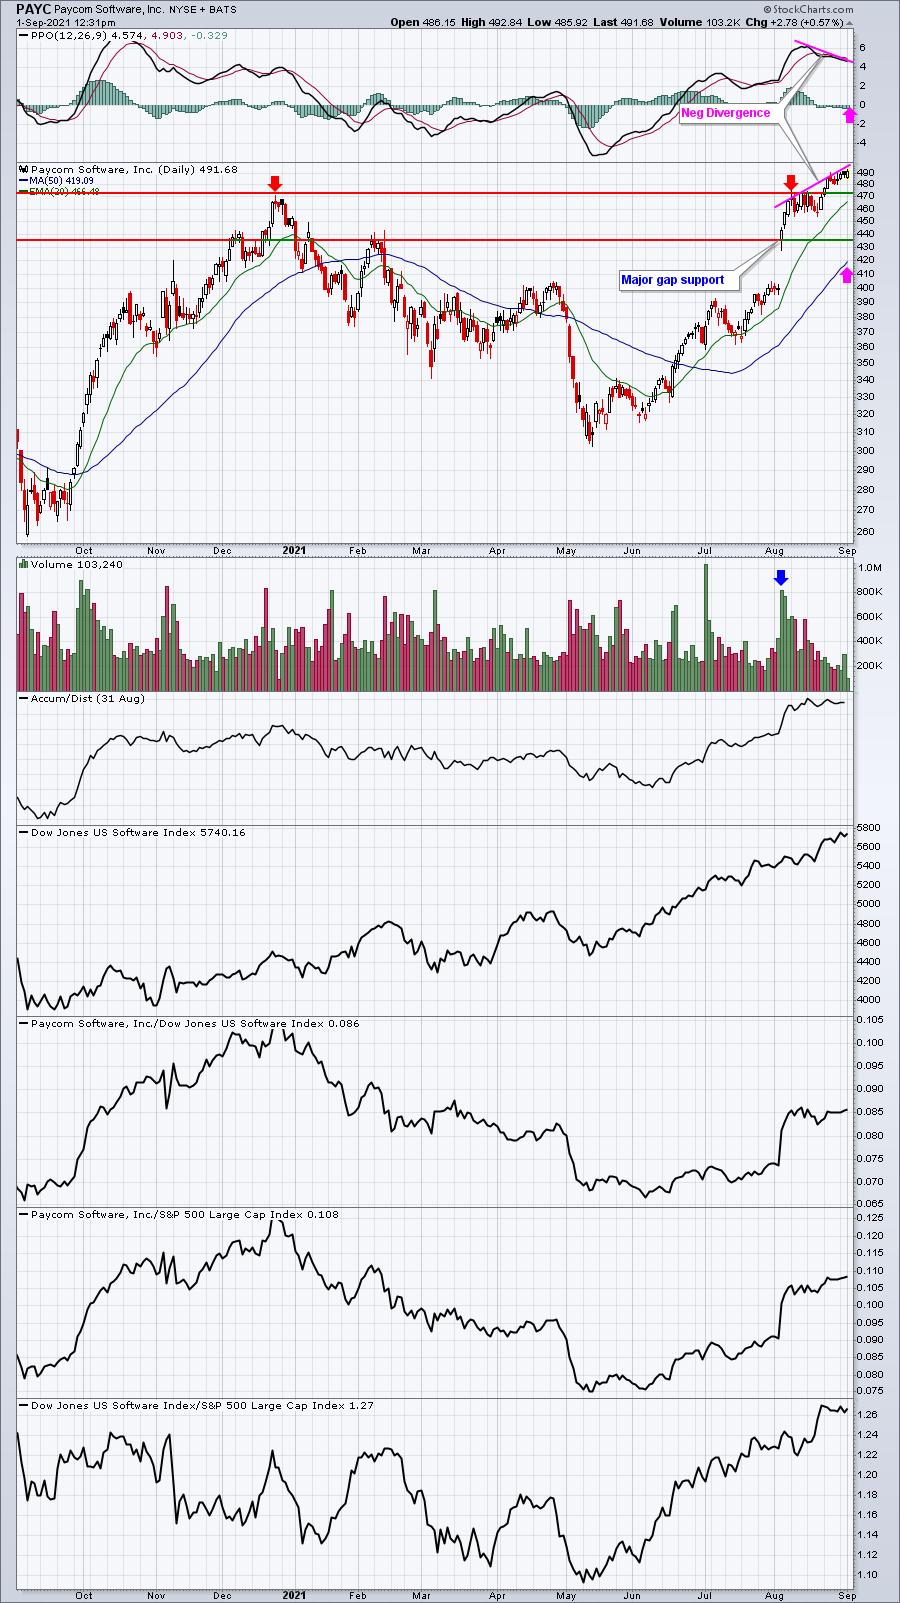
While I believe that PAYC is poised to go higher longer-term, the short-term is a bit more dicey. PAYC has broken out to new highs, but note the negative divergence (a sign of potential slowing upside momentum) and the lighter volume that's accompanied this latest price move higher. Light volume advances can also be a warning as to momentum. The pink arrows highlight what we typically see after a negative divergence prints - a 50-day SMA test and/or a PPO centerline test. If PAYC does see short-term weakness, gap support at 435.00 would be an excellent entry point, should PAYC fall to that price level. We tend to look at a chart and think, "there's no way that PAYC will fall that far." But it's only about a 10-11% drop. Stocks do that all the time.
A Look Ahead At September 2021
S&P 500 Performance
Here's a breakdown of the annualized performance of the S&P 500 (since 1950) during the month of September:
September 1-2: +48.50%
September 3-10: -13.68%
September 11-16: +27.73%
September 17-26: -29.70%
September 27-30: -4.31%
I consider September to be the worst month of the year historically. But it's important to realize that September doesn't create selling. It's a time of the year when we can see weakness relative to other months of the year, but we need to keep in mind that it does rise nearly 50% of the time. So it's important to analyze the technical picture and use that as our primary indication of the market's likely September direction. Historical data is a secondary indicator. We should be aware that September is a weak historical month, especially if technical conditions begin to develop later in the month that would support a market drop.
Sector Performance
Before we look at individual stocks, let's get an overview of how the various sectors and industries have performed during September (and October) over the past decade (during this secular bull market):
Sector Heat Map:
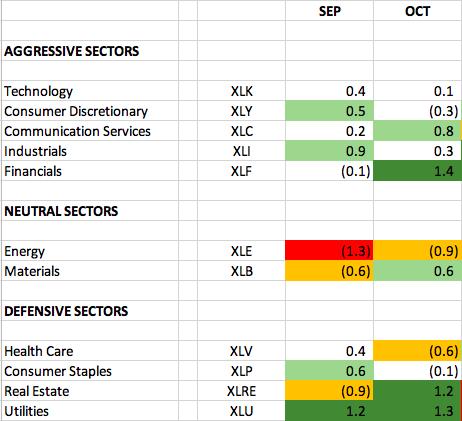
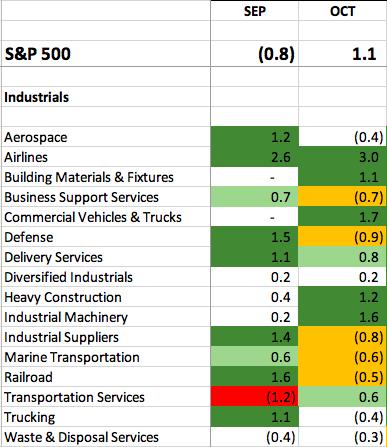
The numbers reflect how much a sector, on average, outperforms or underperforms the S&P 500 over the past 10 years. The dark green shaded area shows significant outperformance (1.0 or greater). The light green shaded areas shows solid outperformance (from 0.5 to 1.0). The orange shaded area shows underperformance (-0.5 to -1.0). The red shaded area shows significant underperformance (-1.0 or greater). Where there is no shading, there tends to be more neutral performance (-0.4 to 0.4).
Among the aggressive sectors, we typically see relative strength in industrials (XLI) and consumer discretionary (XLY) during September. Among defensive sectors, relative strength resides in utilities (XLU) and consumer staples (XLP). In particular, the XLU begins its best two-month period of relative strength of the year as can be seen from the following relative strength seasonality chart:
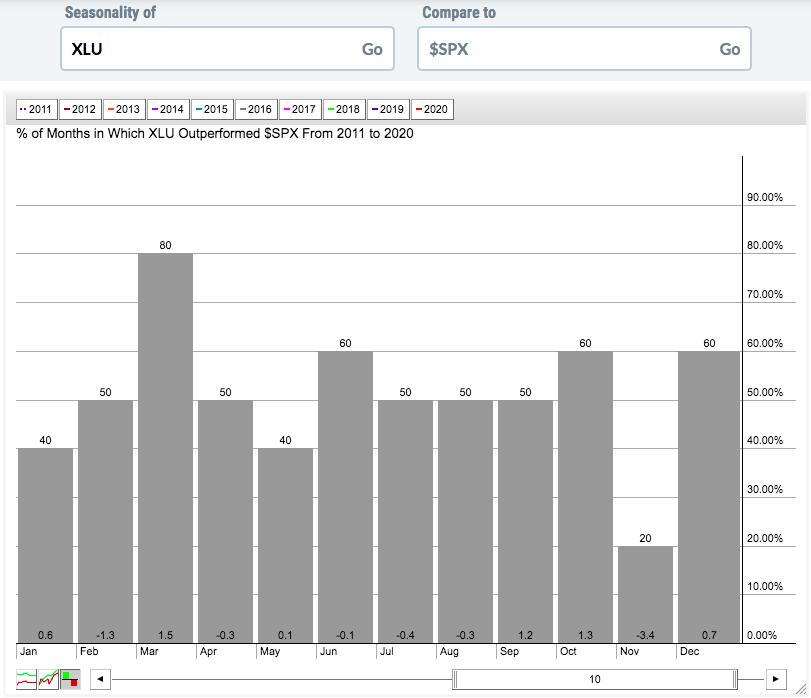
The bottom of each bar provides the average outperformance for that calendar month. If you add the September and October averages, you'll get an average outperformance of 2.5%. Utilities definitely tend to come to life, which makes perfect sense, especially in September, when the stock market has had historical difficulties. That also helps to explain why consumer staples (XLP) would also do well in September.
Industry Performance
Let's take a look at the industry heat map within both industrials and consumer discretionary to drill down to the best seasonal strength among industries:
Industrials:
Consumer Discretionary:
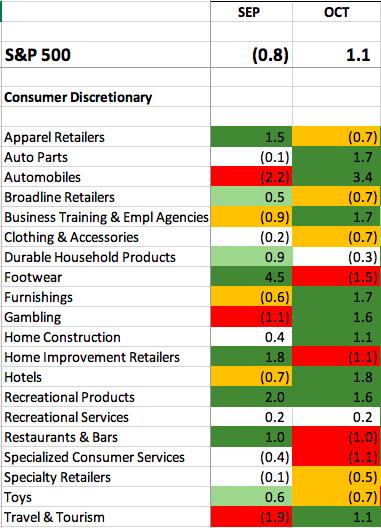
In consumer discretionary, footwear ($DJUSFT) loves September. In the industrials, airlines ($DJUSAR) have a strong tendency to outperform over the next few months. Here are how both industries look as we move into September:
DJUSFT:
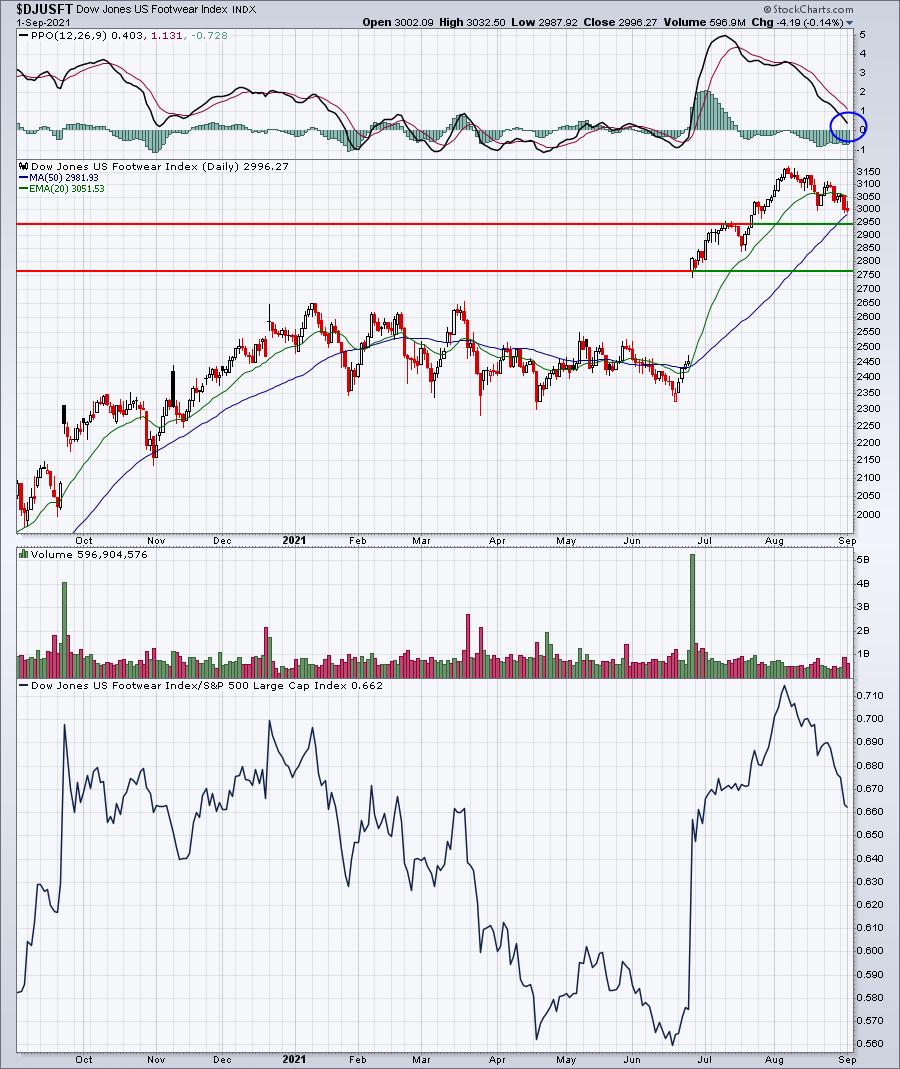
August was a month of profit taking and consolidation and footwear now appears poised to resume its prior strength. I especially like the fact that the PPO is nearing key centerline support, while price tests 50-day SMA support.
DJUSAR:
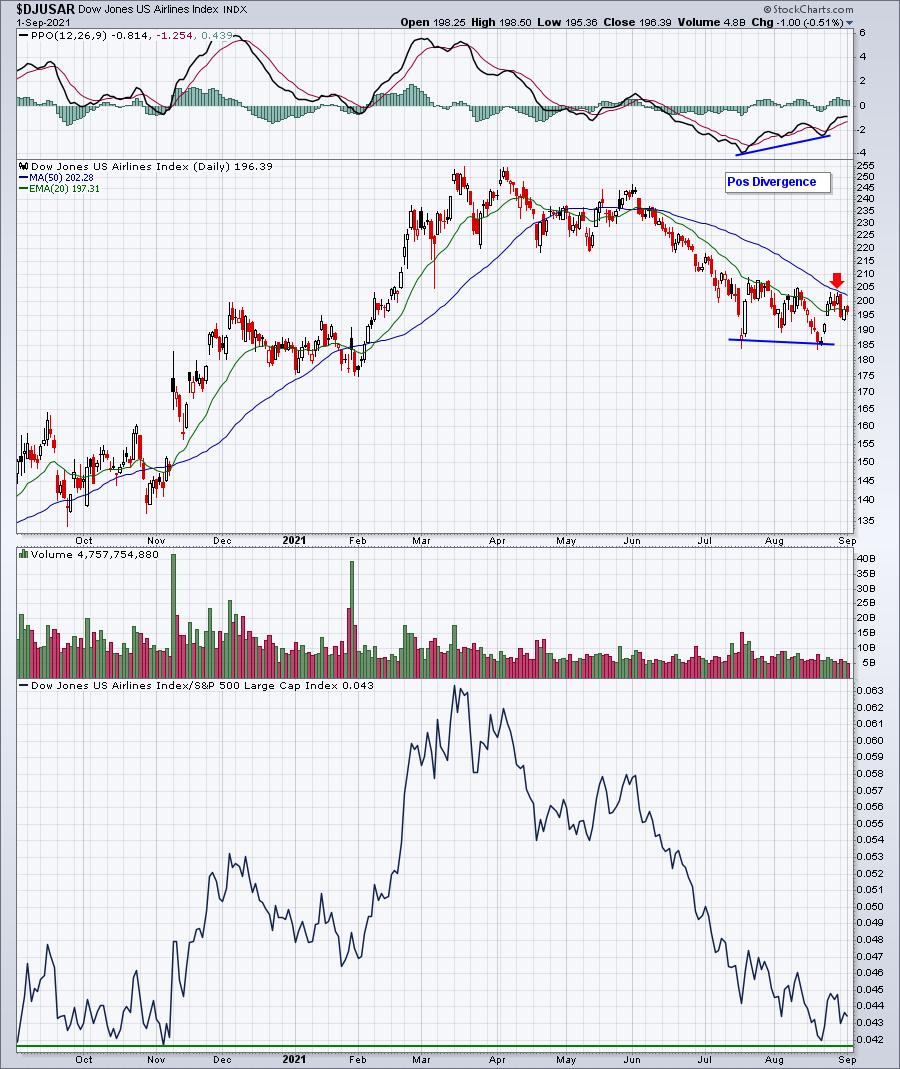
Well, I don't know if airlines have a strong next 3 months, but I can say that the chart is set up for that possibility. Coming off a recent positive divergence, the DJUSAR has recovered to its 50-day SMA, nearly resetting its PPO in the process. Also, airlines' relative strength is testing its 52-week low, an area where I'd be looking for relative strength to kick in. The first step in regenerating strength is to clear that 50-day SMA, so keep an eye on that.
Here are industry groups that tend to perform much better than the benchmark S&P 500 during September:
Technology (XLK):
- semiconductors, computer services
Communication Services (XLC):
- fixed line telecommunications
Financials (XLF):
- none
Health care (XLV):
- none
Consumer staples (XLP):
- brewers, tires, nondurable household products
Real estate (XLRE):
- none
Utilities (XLU):
- multiutilities
Energy (XLE):
- none
Materials (XLB):
- none
Stocks for September
We've selected our Top 20 seasonal stocks for September from the S&P 500 and NASDAQ 100. Several names represent sectors and industry groups that have been discussed above. Others simply stand out in September based on their own track record.
The stocks this month are as follows:
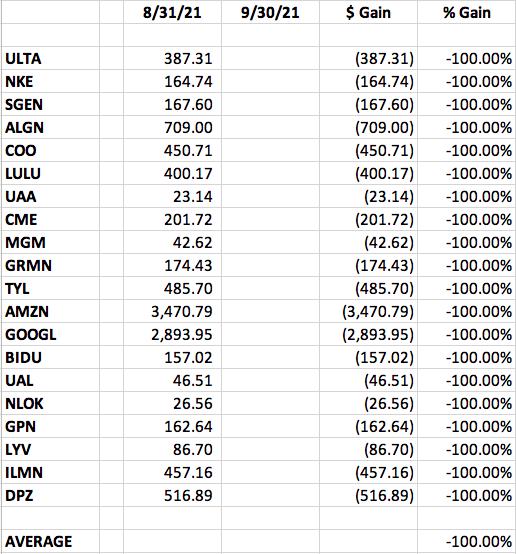
A "Seasonality - September 2021" ChartList will be created and available for download. I'll let you know when this ChartList is complete. It'll likely be this weekend, but if sooner, I'll let you know in the Daily Market Report (DMR). You must be a StockCharts.com Extra or Pro member to download our ChartLists. Basic members and non-StockCharts.com members can view the charts one at a time. The charts will be annotated with a key support level to watch.
Happy trading!
Tom