
EB Monthly Seasonality Report - December 2021
A Look Back At November 2021
Below are the 20 stocks that were favored for the month of November and how they performed:
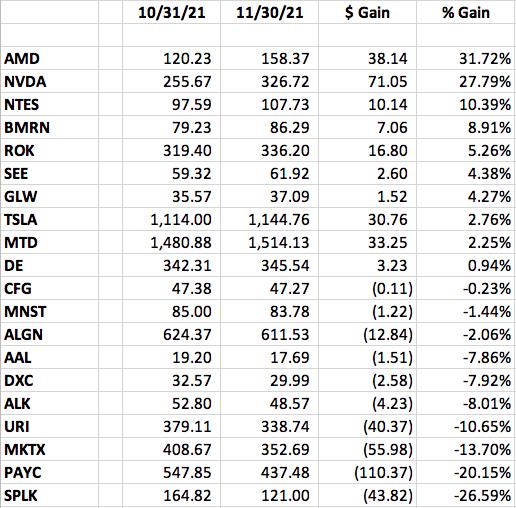
11 of the 20 stocks provided outperformed the S&P 500's return of -0.80% during November. The average return of +0.0% was slightly above the S&P 500 return.
The best performer from our November group was Advanced Micro Devices, which surged nearly 32%. That enabled AMD to make a big breakout, but a negative divergence formed in late-December, a signal that upward price momentum was slowing:
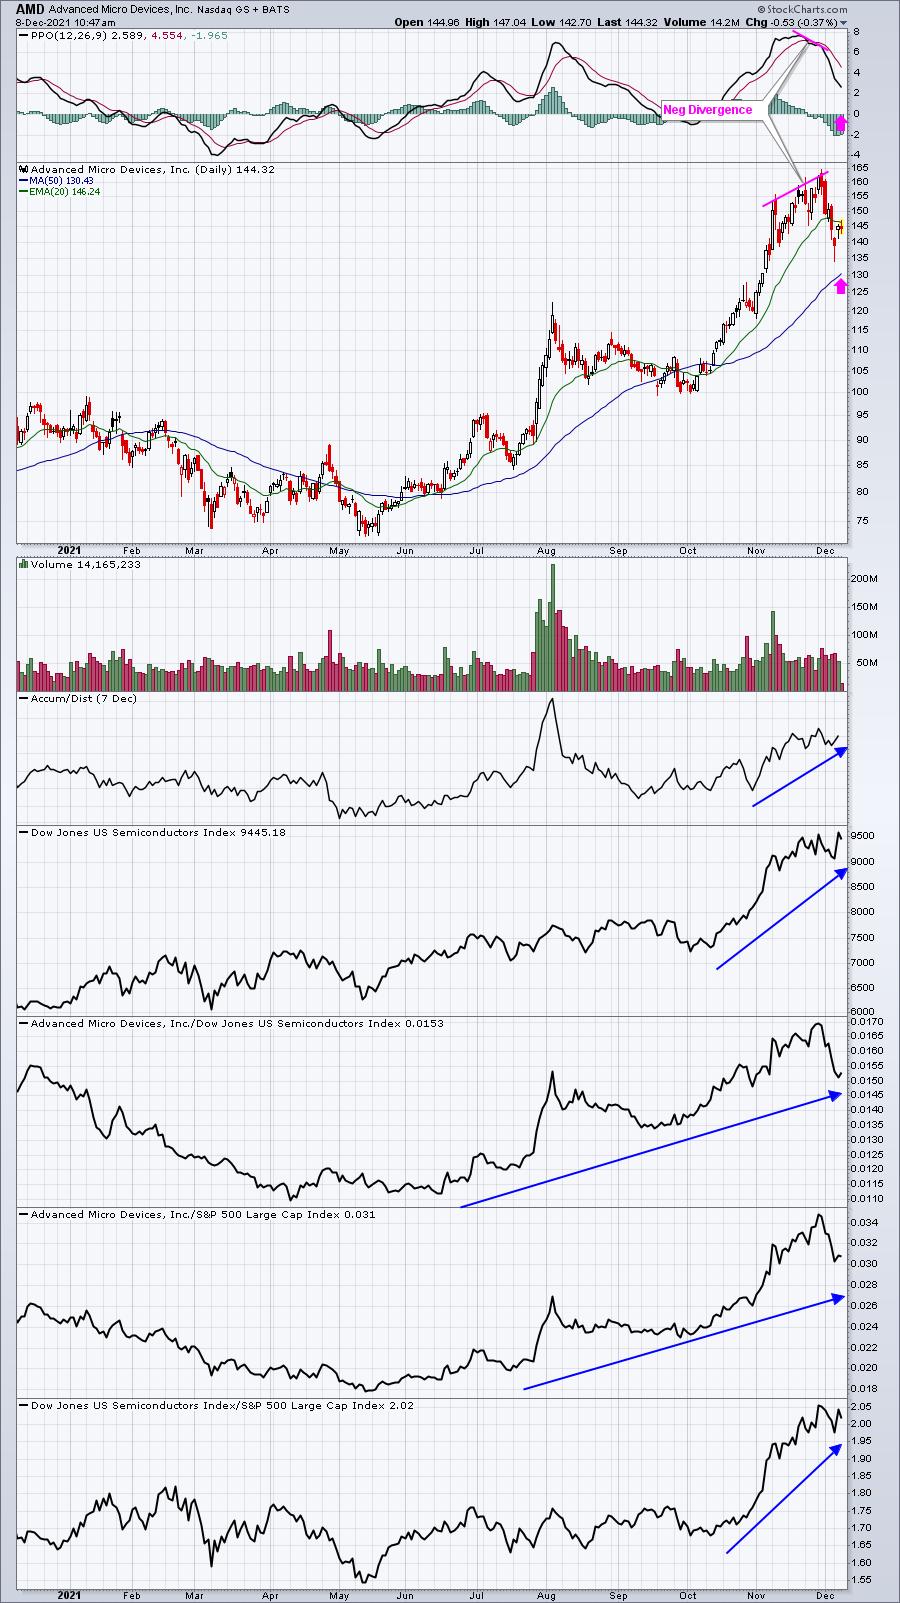
There's no doubt that AMD being part of the semiconductor group ($DJUSSC) added to its November performance as semiconductors soared during November and AMD was a clear leader. It remains a leader despite its early-December swoon. I chalk this up more to the negative divergence and deserving a pause more than anything else.
A Look Ahead To December 2021
S&P 500 Performance
Here's a breakdown of the annualized performance of the S&P 500 (since 1950) during the month of October:
December 1-6: +26.95%
December 7-10: +6.16%
December 11-15: -26.57%
December 16-30: +35.79%
December is a bullish month, but clearly its most bullish time is the second half of the month. Since 1950, the December breakdown of annualized returns is as follows:
- December 1-15: +1.80%
- December 16-30: +35.79%
That is quite a disparity, especially if you consider how the first half and second half of ALL calendar months break down since 1950. Check this out:
- 1st through 15th (all calendar months): +12.70%
- 16th through 31st (all calendar months): +5.64%
So the first half of calendar months has a return that has doubled the second half of the month. Yet, in December, the second half absolutely crushes the first half. Interesting.
Sector Performance
Before we look at individual stocks, let's get an overview of how the various sectors and industries have performed during December (and January) over the past decade (during this secular bull market):
Sector Heat Map:
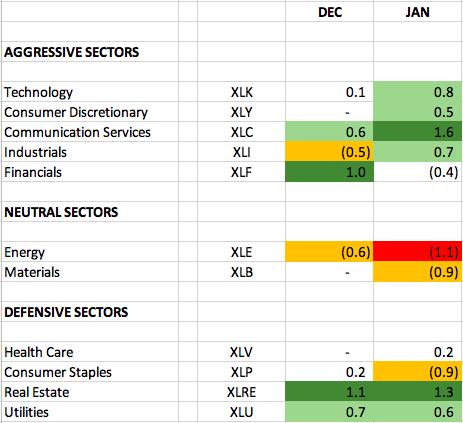
The numbers reflect how much a sector, on average, outperforms or underperforms the S&P 500 over the past 10 years. The dark green-shaded areas show significant outperformance (1.0 or greater). The light green-shaded areas show solid outperformance (from 0.5 to 1.0). The yellow-shaded areas show underperformance (-0.5 to -1.0). The red-shaded areas show significant underperformance (-1.0 or greater). Where there is no shading, there tends to be more neutral performance (-0.4 to 0.4).
When I look at these historical December numbers, real estate (XLRE) definitely appears to get some love in both December and January - at least historically. Here's where the XLRE chart currently stands:
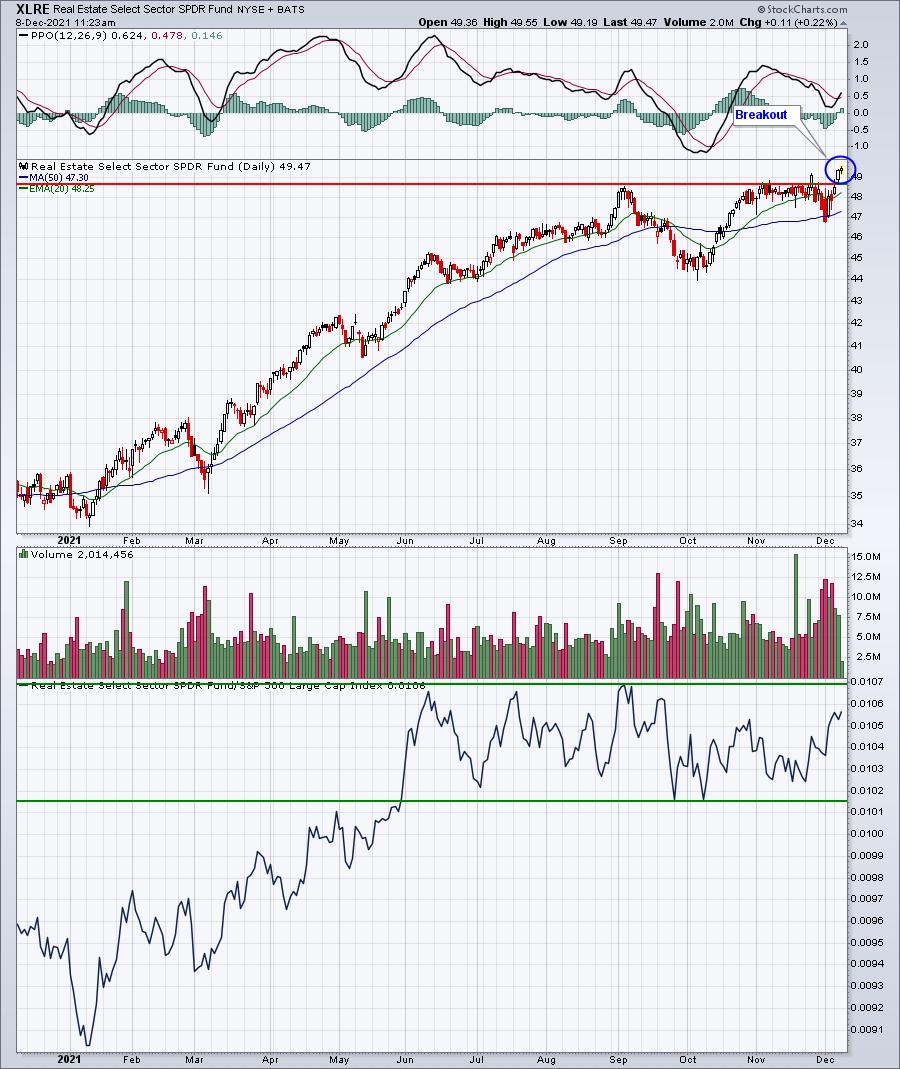
So we have a breakout and seasonal strength. Before you rush out and load up on real estate stocks, remember this is a defensive group and isn't as likely to outperform the S&P 500 on a relative basis. You can see that for the past 6 months, the XLRE has been trading sideways relative to the S&P 500 (lower panel in chart above).
The breakout, however, does suggest that including real estate stocks in your trading portfolio isn't a bad idea right now.
Industry Performance
Let's take a look at the industry heat map within real estate to drill down to the best seasonal strength among the various industry groups:
Real estate:
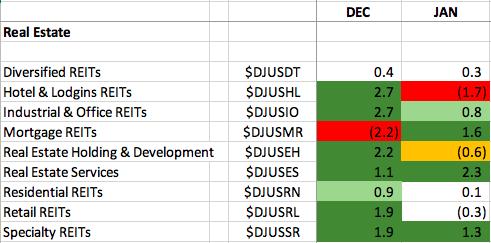
While nearly every industry group within real estate LOVES the month of December, the one industry that has performed the best over December AND January is industrial & office REITs ($DJUSIO).
DJUSIO:
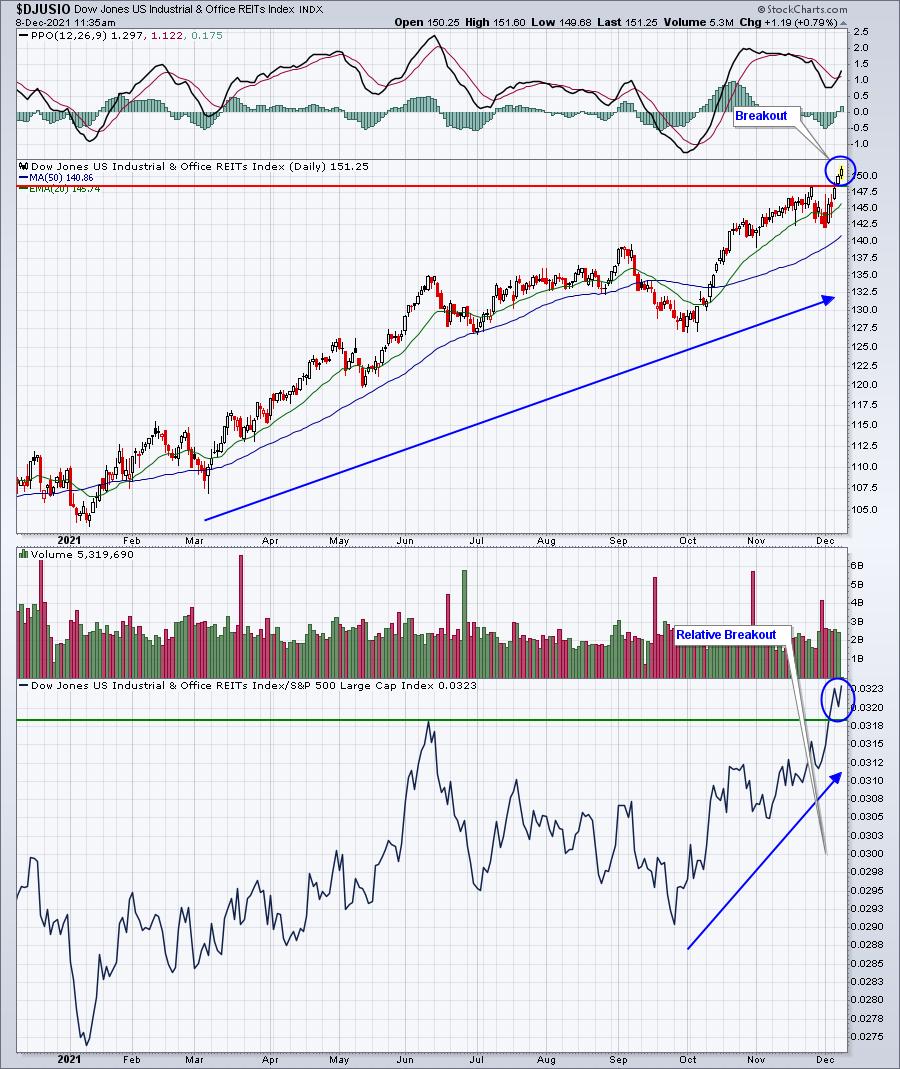
Technically, the DJUSIO looks very strong. We've seen not only an absolute breakout to new highs, but this group is actually outperforming the S&P 500 strongly the past several weeks.
Here are industry groups (within sectors other than real estate) that tend to perform much better than the benchmark S&P 500 during December:
Technology (XLK):
- renewable energy
Consumer Discretionary (XLY):
- home construction, hotels, home improvement retailers, recreational services, business training & employment agencies
Communication Services (XLC):
- fixed line telecommunications
Industrials (XLI):
- building materials & fixtures, commercial vehicles & trucks, industrial suppliers
Financials (XLF):
- mortgage finance, full line insurance, life insurance
Health care (XLV):
- health care providers, medical equipment
Consumer staples (XLP):
- tires, brewers, distillers & vintners
Utilities (XLU):
- none
Energy (XLE):
- coal, integrated oil & gas
Materials (XLB):
- aluminum, steel, mining, gold mining, containers & packaging
Stocks for December
We've selected our Top 20 seasonal stocks for December from the S&P 500 and NASDAQ 100. Several names represent sectors and industry groups that have been discussed above. Others simply stand out in December based on their own historical track record.
The stocks this month are as follows:
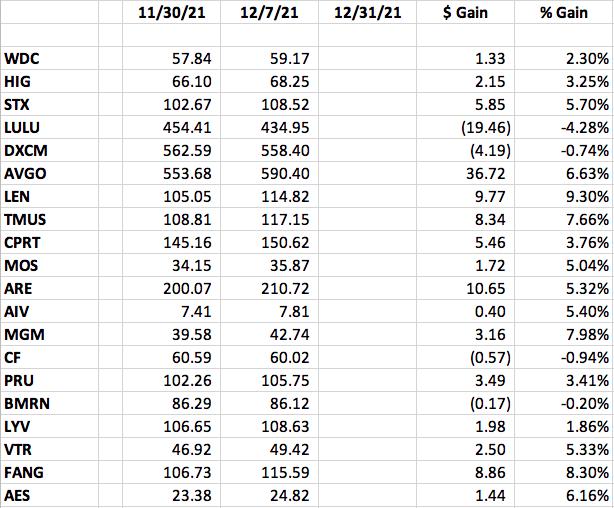
I included the stock prices as of December 7th as many stock have moved higher since November 30th. The S&P 500 has risen nearly 3% since the end of November. As a group, the above 20 stocks have thus far slightly outperformed that benchmark.
A "Seasonality - December 2021" ChartList has been created and is available for viewing/download on our website. You must be a StockCharts.com Extra or Pro member to download our ChartLists. Basic members and non-StockCharts.com members can view the charts one at a time. The charts have been annotated with a key support level (or two) to watch on any pullback.
Happy trading!
Tom