
EB Monthly Seasonality Report - January 2022
A Look Back At December 2021
Below are the 20 stocks that were favored for the month of December and how they performed:
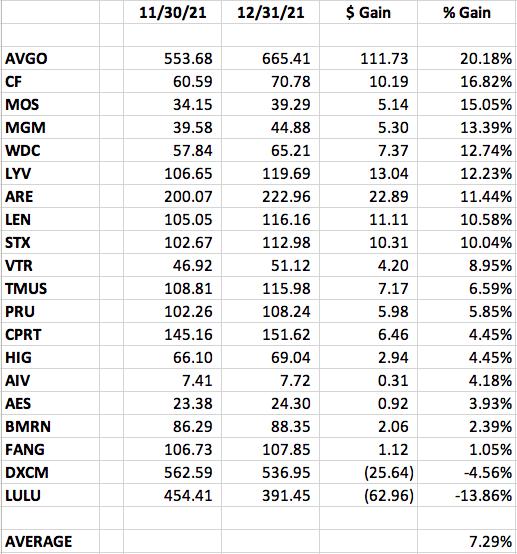
14 of the 20 stocks provided outperformed the S&P 500's return of +4.26% during December. The average return of +7.29% crushed the S&P 500 return.
The best performer from our December group was Broadcom, Inc. (AVGO), which jumped slightly more than 20%. AVGO is now overbought, but its AD line suggests Wall Street is behind this move higher, a bullish sign:
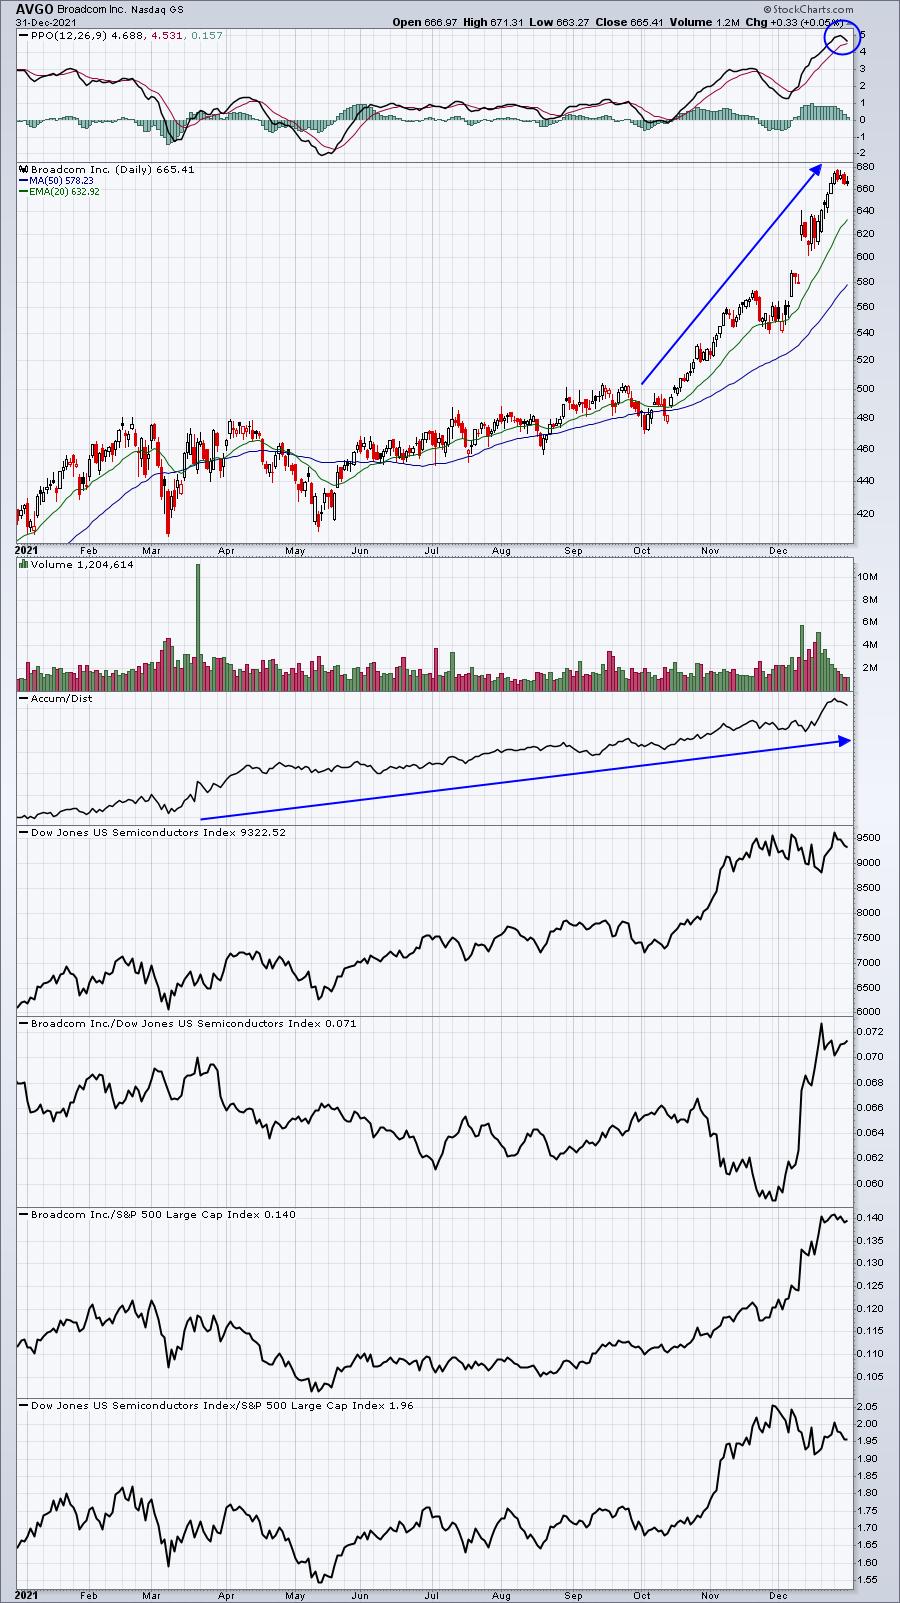
We could see some short-term selling to simply unwind that stretched PPO, but the rising 20-day EMA should provide solid support for short-term traders.
A Look Ahead To January 2022
S&P 500 Performance
Here's a breakdown of the annualized performance of the S&P 500 (since 1950) during the month of January:
January 1-6: +40.46%
January 7-13: -14.14%
January 14-18: +31.91%
January 19-24: -10.18%
January 25-31: +27.09%
January is a very bullish month, but the most bullish period of the year runs from the October 27th close through the January 18th close. We only have two more weeks left to enjoy before historical tailwinds begin to dissipate.
Sector Performance
Before we look at individual stocks, let's get an overview of how the various sectors and industries have performed during January (and February) over the past decade (during this secular bull market):
Sector Heat Map:
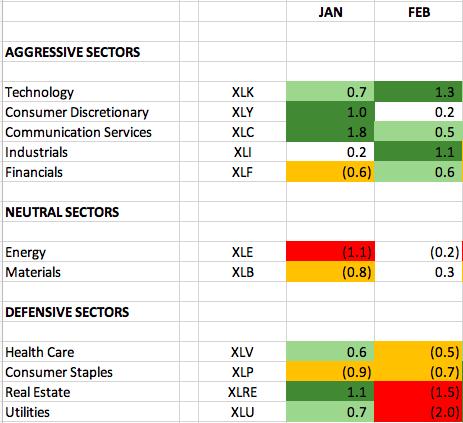
The numbers reflect how much a sector, on average, outperforms or underperforms the S&P 500 over the past 10 years. The dark green-shaded areas show significant outperformance (1.0 or greater). The light green-shaded areas show solid outperformance (from 0.5 to 1.0). The yellow-shaded areas show underperformance (-0.5 to -1.0). The red-shaded areas show significant underperformance (-1.0 or greater). Where there is no shading, there tends to be more neutral performance (-0.4 to 0.4).
When I look at these historical January numbers, communication services (XLC) outperforms in both January and February - at least historically. Here's how the XLC looks as we enter the new year:
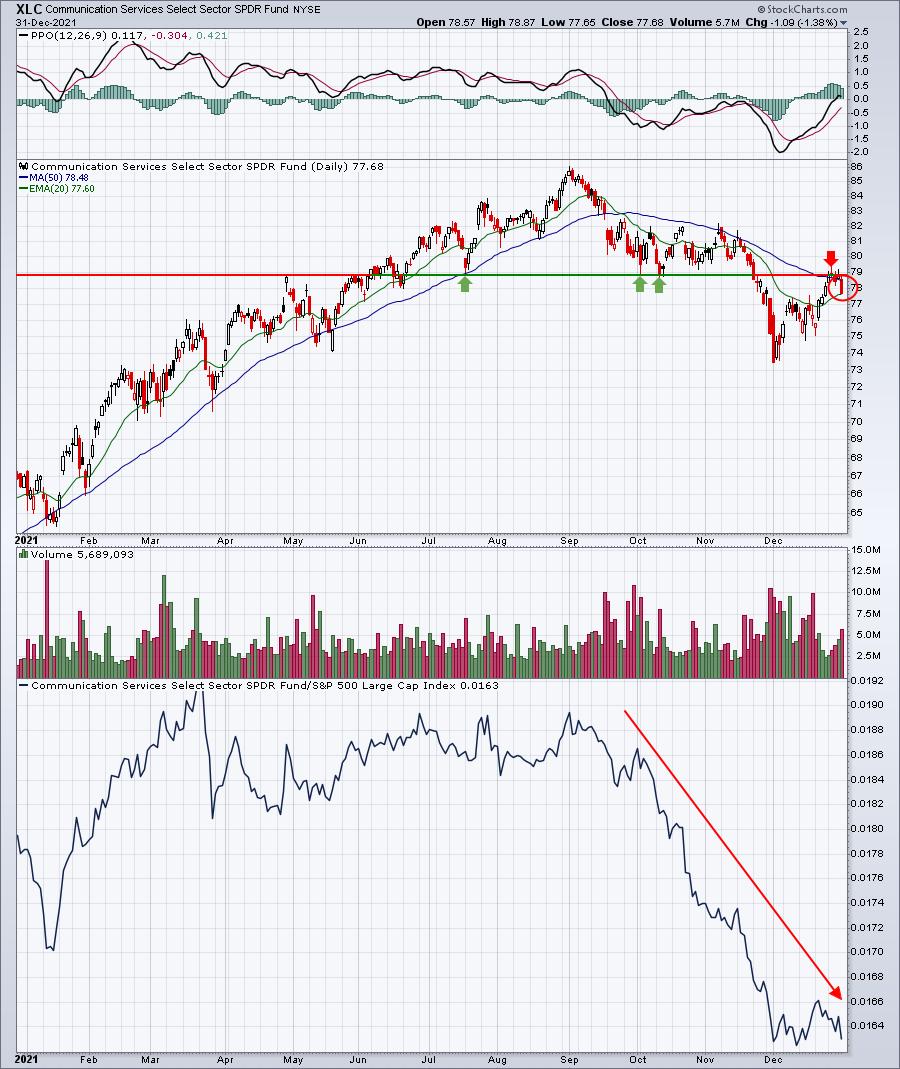
Last month, I featured real estate (XLRE) as a sector that loved December and January. When we pulled the chart up, it was quite bullish, breaking out above key resistance that suggested more upside was ahead. And real estate continued to rally. This month, while the XLC may be a solid historical sector in January and February, I'm not seeing the bullishness on the chart. Therefore, I would personally ignore the bullish historical tailwinds until we see the XLC break out above 79 - at a minimum. It looks to me like the XLC could have further downside ahead of it based on its current technical outlook. I pay attention to historical signals, but the current technical picture always trumps seasonality, in my opinion.
Industry Performance
Let's take a look at the industry heat map within communication services to drill down to the best seasonal strength among the various industry groups (relative to the S&P 500):
Communication Services (XLC):
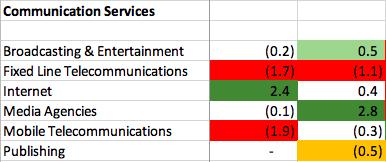
The primary reason that communication services enjoys January and February so much is the internet group ($DJUSNS). Internet stocks have crushed the S&P 500 during January throughout this secular bull market, so if the XLC is able to break back above that 79 level that I discussed earlier, it'll likely be due to a very strong internet group. Currently, the DJUSNS is sideways consolidating after a stellar advance:
DJUSNS:
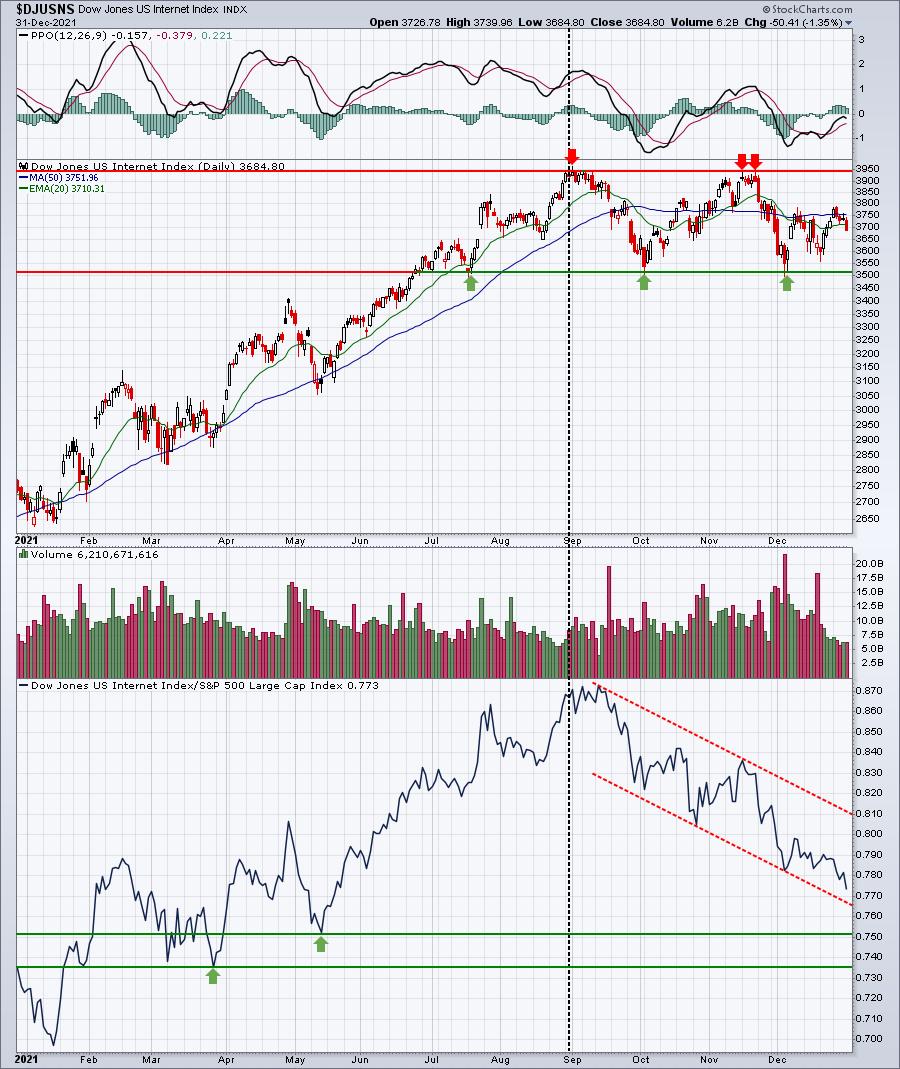
While internet stocks are consolidating those earlier gains, you can see in the bottom panel that relative strength has deteriorated significantly. That's not necessarily a bad thing as relative strength always weakens when a period of consolidation begins. But there's nothing keeping this group from falling another 150-200 points to test previous support near 3500. What the bulls are hoping for is that strength resumes in this group to carry it closer to its previous high at 3950.
Here are industry groups (within sectors other than communication services) that tend to perform much better than the benchmark S&P 500 during January:
Technology (XLK):
- renewable energy, software, computer services, electronic equipment
Consumer Discretionary (XLY):
- home construction, broadline retailers, automobiles, gambling, specialty retailers, toys
Industrials (XLI):
- airlines, building materials & fixtures, commercial vehicles & trucks
Financials (XLF):
- specialty finance
Health care (XLV):
- medical equipment, biotechnology, medical supplies
Consumer staples (XLP):
- drug retailers
Real estate (XLRE):
- real estate services, specialty REITs, industrial & office REITs
Utilities (XLU):
- water
Energy (XLE):
- pipelines
Materials (XLB):
- gold mining, paper
Stocks for January
We've selected our Top 20 seasonal stocks for January from the S&P 500 and NASDAQ 100. Several names represent sectors and industry groups that have been discussed above. Others simply stand out in January based on their own historical track record.
The stocks this month are as follows:
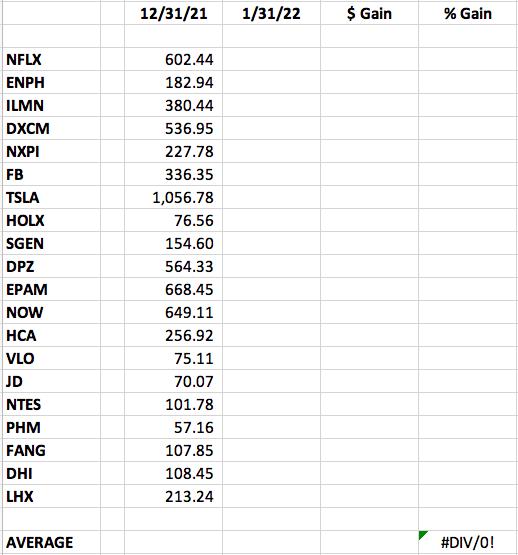
A "Seasonality - January 2022" ChartList has been created and will be available for viewing/download on our website on Monday. You must be a StockCharts.com Extra or Pro member to download our ChartLists. Basic members and non-StockCharts.com members can view the charts one at a time. The charts have been annotated with a key support level (or two) to watch on any pullback.
Happy trading!
Tom