
EB Monthly Seasonality Report - April 2022
It's been a few months since I published a Seasonality Report. The primary reason was I expected to see weakness in early 2022 and that's mostly what we've seen, excluding the past 2-3 weeks. While I believe it's "up in the air" as to whether we revisit the February 2022 low, it probably makes sense to begin looking at historical strength again. I would definitely pay more attention to the technical outlook of individual stocks over their historical trends, however.
Let's take a look at how April has historically performed
S&P 500 Performance
Here's a breakdown of the annualized performance of the S&P 500 (since 1950) during the month of April:
April 1-18: +32.75%
April 19-28: -0.70%
April 29-30: +22.98%
April tends to be a very strong calendar month for U.S. equities. Since 1950, the S&P 500 has moved higher in April in 52 of the 72 years, producing an annualized return of +19.80%. That trails only November (+19.91%) in terms of annualized performance. Its probability of finishing the month higher than where it closed in March is 72.22% (52 of 72 years) and trails only December, which has finished higher 75% of years since 1950 (54 of 72 years).
Sector Performance
Before we look at individual stocks, let's get an overview of how the various sectors and industries have performed during April (and May) over the past decade (during this secular bull market):
Sector Heat Map:
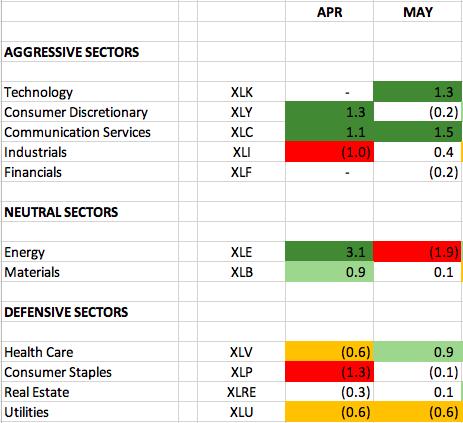
The numbers reflect how much a sector, on average, outperforms or underperforms the S&P 500 over the past 10 years. The dark green-shaded areas show significant outperformance (1.0 or greater). The light green-shaded areas show solid outperformance (from 0.5 to 1.0). The yellow-shaded areas show underperformance (-0.5 to -1.0). The red-shaded areas show significant underperformance (-1.0 or greater). Where there is no shading, there tends to be more neutral performance (-0.4 to 0.4).
When I look at these historical April numbers, communication services (XLC) is the only sector that has outperformed significantly in both April and May. Technically, however, this group is challenged on a relative basis. Here's how the XLC looks in early April:
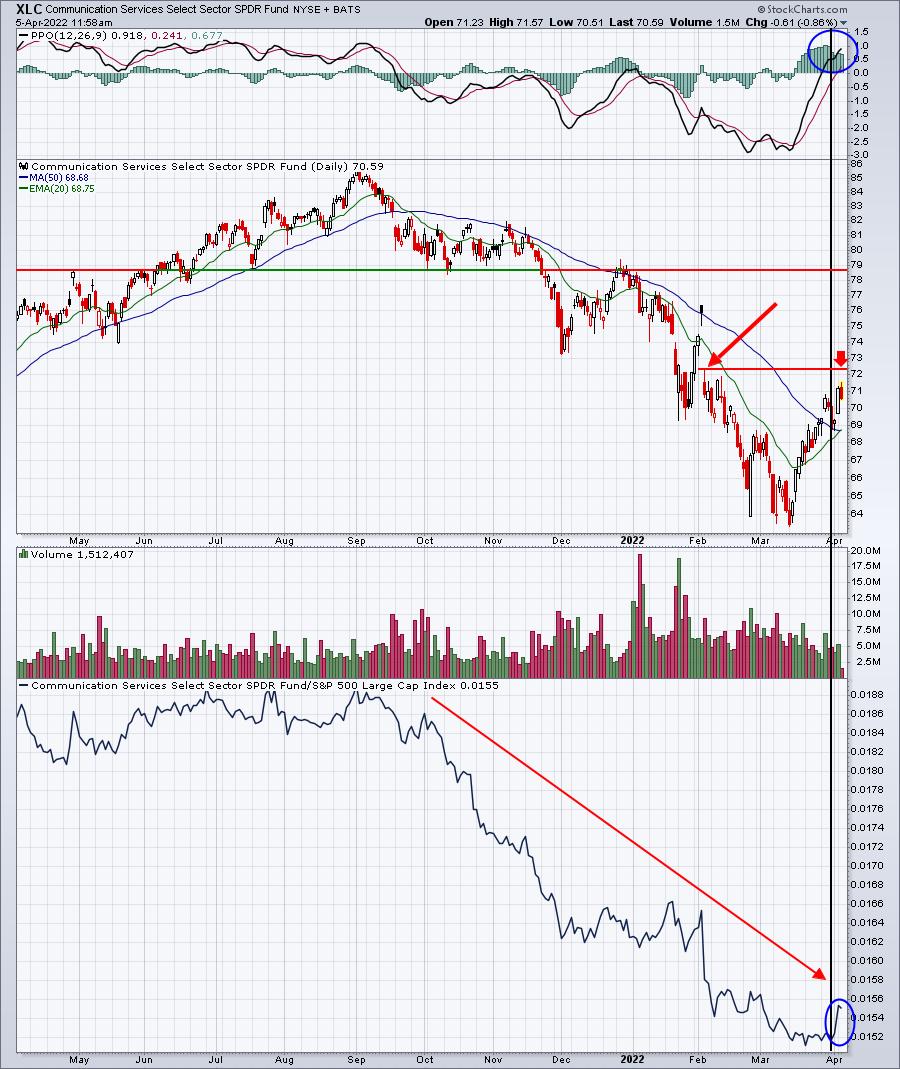
In my last Seasonality Report in January, I discussed that XLC was a solid historical sector in January and February, but that I wasn't seeing the bullishness on the chart. Therefore, I suggested ignoring the bullish historical tailwinds until we saw the XLC break out above 79. It never happened and the selling escalated. As I look at April and May, I really have the same opinion. XLC could have further downside ahead of it based on its current technical outlook. At a minimum, I want to see the XLC clear overhead price/gap resistance between 72-73. If we can get a close above 73, it would be time to reassess. Until then, I'd ignore these historical signals, despite improvement on the chart. The PPO looks much more solid than it has at any point in 2022, so perhaps we're getting started with an uptrend that will last, but I need to see critical resistance cleared.
I pay attention to historical signals, but the current technical picture always trumps seasonality, in my opinion.
Industry Performance
Let's take a look at the industry heat map within communication services to drill down to the best seasonal strength in April and May over the past decade among the various industry groups (relative to the S&P 500):
Communication Services (XLC):
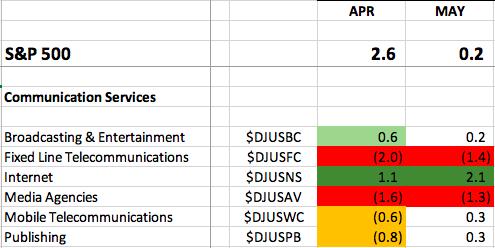
The only reason that communication services enjoys such significant outperformance during April and May is the internet group ($DJUSNS). Internet stocks have crushed the S&P 500 during both April and May throughout this secular bull market, so if the XLC is able to break back above that 73 level that I discussed earlier, it'll likely be due to a very strong internet group. The DJUSNS has been extremely weak in 2022, though it has seen recent improvement:
DJUSNS:
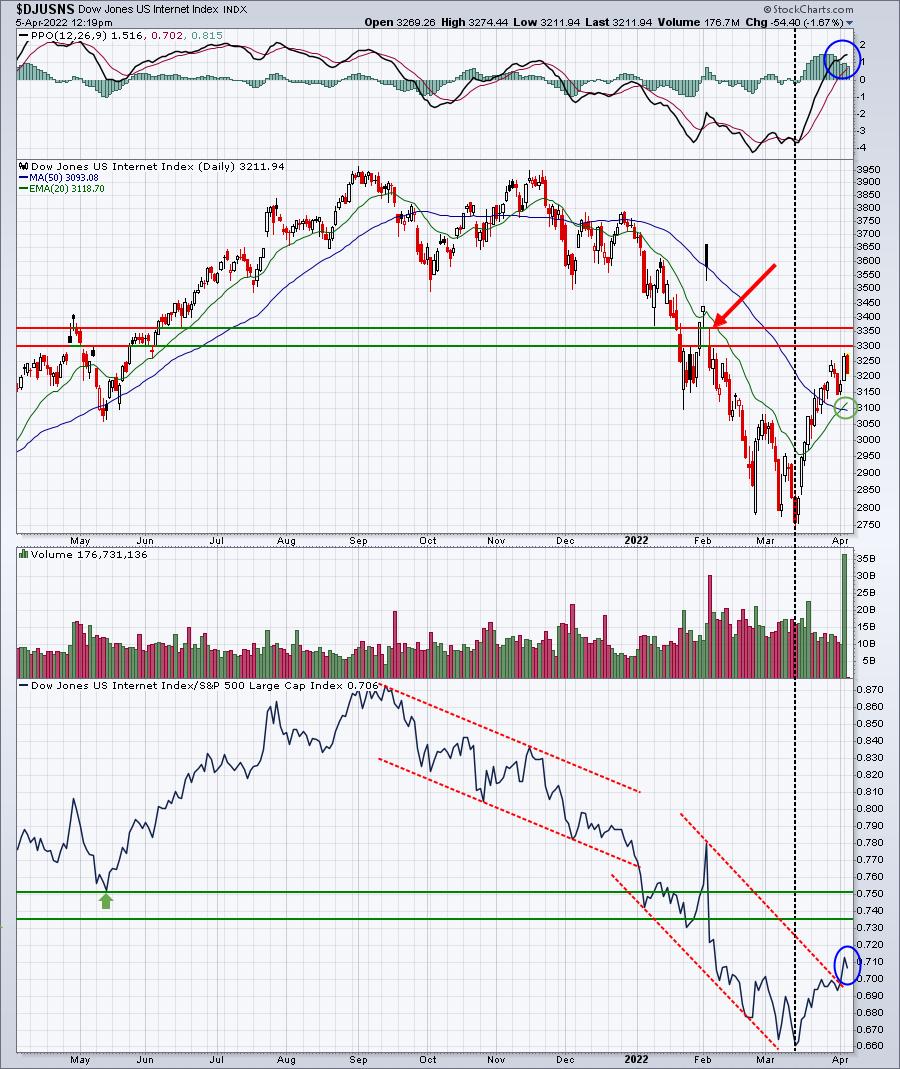
Internet stocks have rallied back over the past 3 weeks after a brutal selloff to begin 2022. The PPO turning positive and the recent relative strength are two positives, but the price chart has many challenges ahead. It would be difficult in the short-term to hold your nose and buy stocks within this group, though I do believe that wouldn't be a bad strategy medium- to long-term. I expect leadership to return in this group when money convincingly rotates back to growth stocks. Is that happening now? That's very difficult to say, but I'd err on the side of caution and watch the group for now.
Here are industry groups (within sectors other than communication services) that tend to perform much better than the benchmark S&P 500 during April:
Technology (XLK):
- renewable energy, software
Consumer Discretionary (XLY):
- broadline retailers, automobiles, travel & tourism, restaurants & bars, home construction
Industrials (XLI):
- marine transportation, railroads, transportation services
Financials (XLF):
- specialty finance, full line insurance, consumer finance, life insurance
Health care (XLV):
- none
Consumer staples (XLP):
- distillers & vintners
Real estate (XLRE):
- none
Utilities (XLU):
- none
Energy (XLE):
- coal, exploration & production, oil equipment & services
Materials (XLB):
- nonferrous metals, aluminum, mining, gold mining
Stocks for April
We've selected our Top 20 seasonal stocks for April from the S&P 500 and NASDAQ 100. Several names represent sectors and industry groups that have been discussed above. Others simply stand out in April based on their own historical track record.
The stocks this month are as follows:
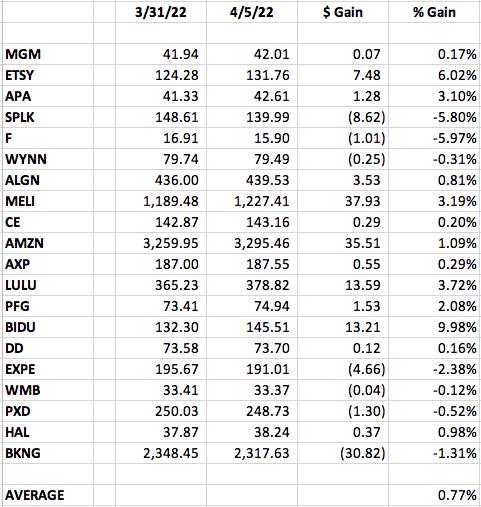
The prices for April 5 were as of approximately 1:45pm ET.
A "Seasonality - April 2022" ChartList has been created and will be available for viewing/download on our website later today. You must be a StockCharts.com Extra or Pro member to download our ChartLists. Basic members and non-StockCharts.com members can view the charts one at a time. The charts have been annotated with a key support level (or two) to watch on any pullback.
Happy trading!
Tom