
EB Monthly Seasonality Report - August 2022
S&P 500 Performance
Here's a breakdown of the annualized performance of the S&P 500 (since 1950) during the month of August:
August 1-3: +12.28%
August 4-10: -14.36%
August 11-17: +17.29%
August 18-28: -4.82%
August 29-31: +6.55%
August tends to be a very choppy month for U.S. equities as summer vacations kick into high gear. There typically doesn't seem to be much commitment on the long side as the historically bearish month of September awaits. Since 1950, the S&P 500 has moved higher in August in 40 of the 72 years, producing a miniscule annualized return of just +0.87%. That ranks August as the 10th best calendar month of the year, besting only June (+0.56%) and September (-6.36%) in terms of annualized performance.
Sector Performance
Before we look at individual stocks, let's get an overview of how the various sectors and industries have performed during August (and September) over the past decade (during this secular bull market):
Sector Heat Map:
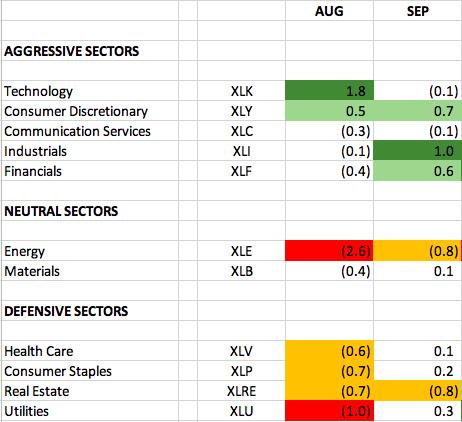
The numbers reflect how much a sector, on average, outperforms or underperforms the S&P 500 over the past 10 years. The dark green-shaded areas show significant outperformance (1.0 or greater). The light green-shaded areas show solid outperformance (from 0.5 to 1.0). The yellow-shaded areas show underperformance (-0.5 to -1.0). The red-shaded areas show significant underperformance (-1.0 or greater). Where there is no shading, there tends to be more neutral performance (-0.4 to 0.4).
When I look at these historical August numbers, technology (XLK) and consumer discretionary (XLY) - two aggressive sectors - are where we typically see relative strength. But the XLK is clearly the major beneficiary and I love the break of channel resistance and the relative breakout of XLK in the bottom panel:
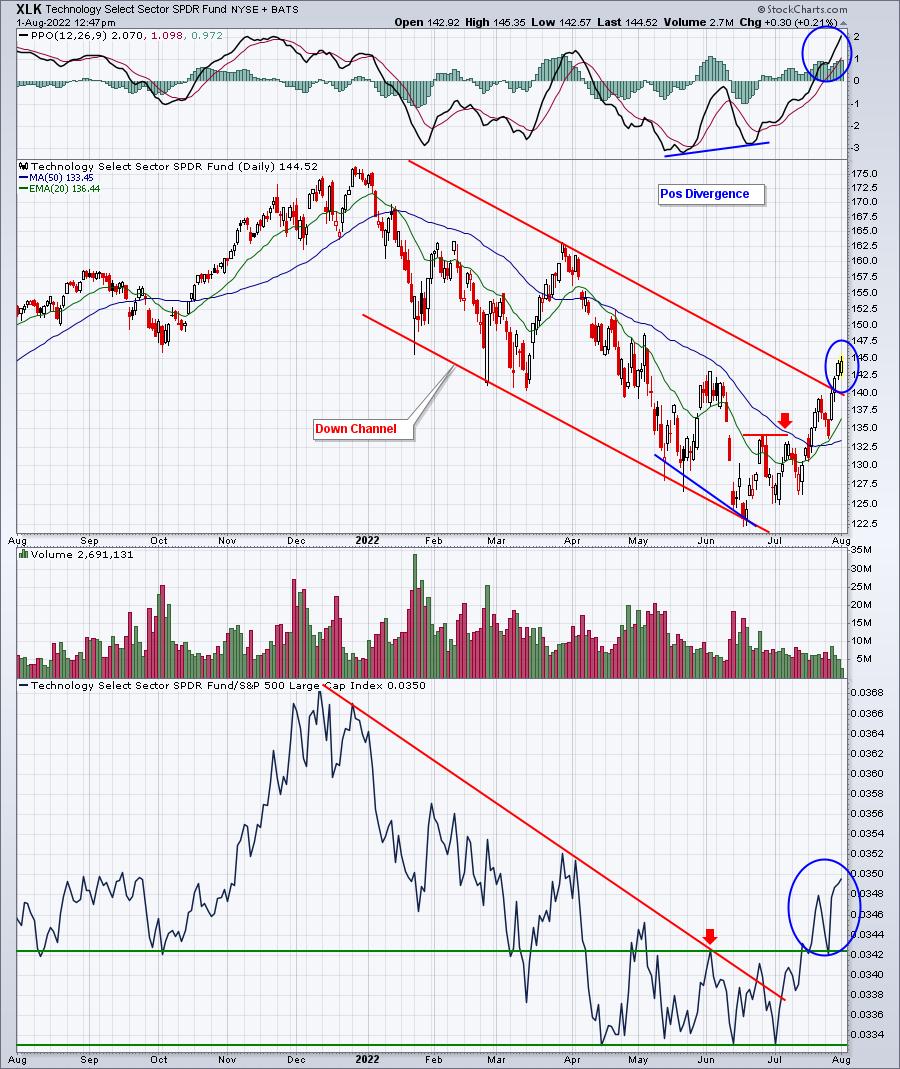
The XLK had been trending down throughout the 2022 cyclical bear market, but after the positive divergence printed on the June low, we've seen nothing but relative strength. That's very bullish rotation to help confirm a major market bottom. Last month, I pointed out that we needed to see the XLK break above 134. Well, that didn't take long. I particularly LOVE that late-July test of the now-rising 20-day EMA and a subsequent break to a new recent price high. While pullbacks will occur from time to time, I believe the XLK has begun a lengthy advance.
I pay attention to historical signals, but the current technical picture always trumps seasonality, in my opinion. The XLK appears to be quite bullish on both counts right now.
Industry Performance
Let's take a look at the industry heat map within technology (XLK) to drill down to the best seasonal strength in August and September over the past decade among the various industry groups (relative to the S&P 500):
Technology (XLK):
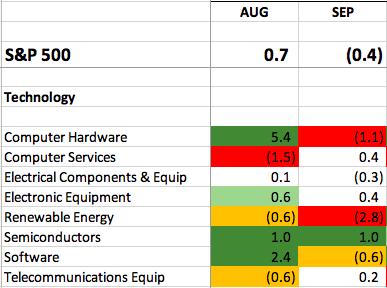
The computer hardware ($DJUSCR) and software ($DJUSSW) groups tend to lead technology higher in August, but only semiconductors ($DJUSSC) show consistent strength in both August and September. It would be a HUGE relief to the bulls if software can get going. Here's how the DJUSSW looks right now:
DJUSSW:
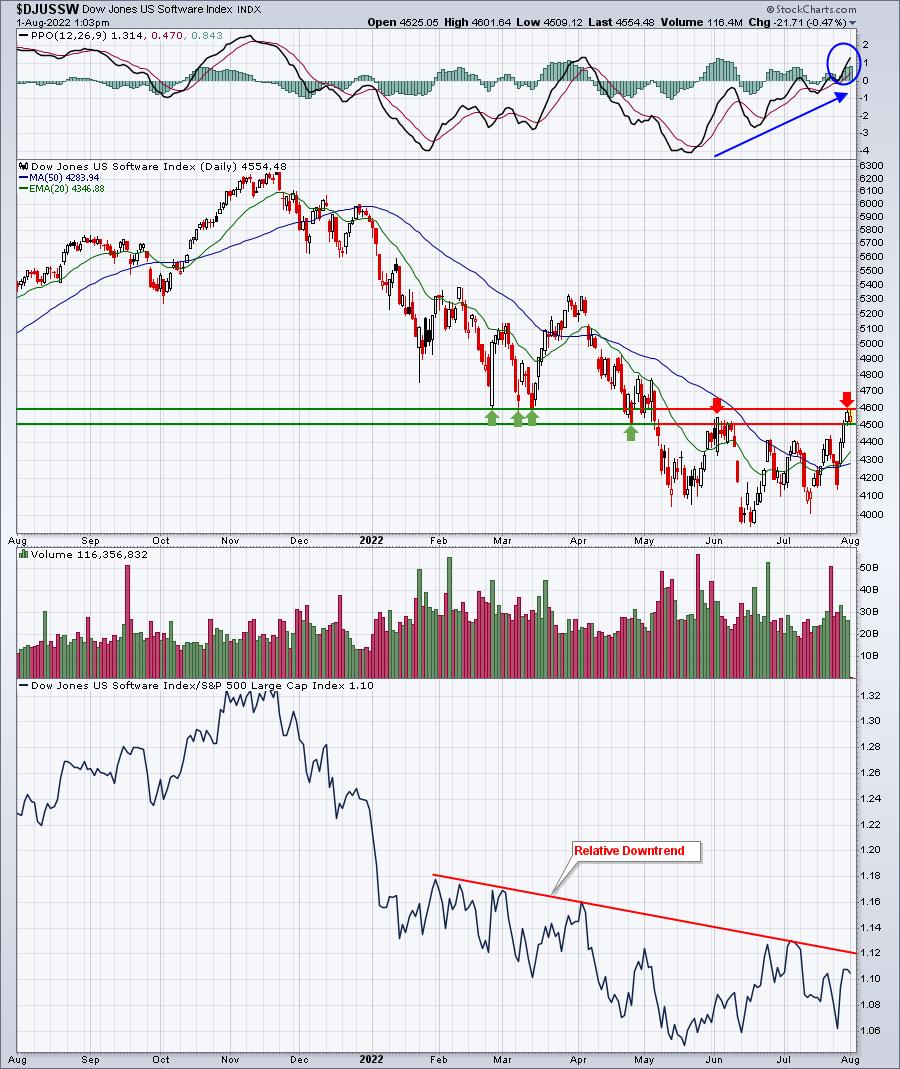
I pointed out that computer hardware was strengthening heading into July and that group absolutely exploded to the upside in July, with Apple (AAPL) leading the charge. Now we're seeing a bit of strength in software as we head into August. Can software explode from here, helping to add to the recent overall market strength? If the answer to that question is yes, then this secular bull market rally is very likely just beginning.
Here are industry groups (within sectors other than technology) that tend to perform much better than the benchmark S&P 500 during August:
Consumer Discretionary (XLY):
- automobiles, home improvement, recreational services, home construction, business training & employment agencies, apparel retailers, furnishings
Communication Services (XLC):
- internet, mobile telecommunications
Industrials (XLI):
- transportation services
Financials (XLF):
- mortgage finance, reinsurance
Health care (XLV):
- none
Consumer staples (XLP):
- food retailers
Real estate (XLRE):
- none
Utilities (XLU):
- none
Energy (XLE):
- none
Materials (XLB):
- aluminum
Stocks for August
We've selected our Top 20 seasonal stocks for August from the S&P 500 and NASDAQ 100. Several names represent sectors and industry groups that have been discussed above. Others simply stand out in August based on their own historical track record.
The stocks this month are as follows:
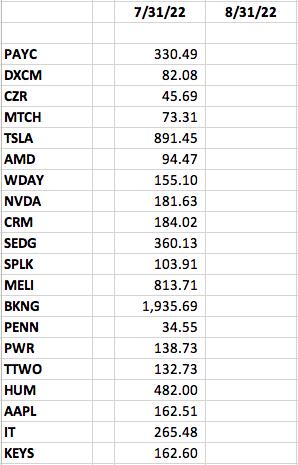
A "Seasonality - August 2022" ChartList has been created and will be available for viewing/download on our website later today. You must be a StockCharts.com Extra or Pro member to download our ChartLists. Basic members and non-StockCharts.com members can view the charts one at a time. The charts will be annotated with a key support level (or two) to watch on any pullback.
If you'd like to download the ChartList now, the following is the link. Be sure to type in the password SEASCL4997 when prompted:
Happy trading!
Tom