
EB Seasonality Report - October 2022
A Look Back At September Stocks:
Earlier this month, we provided a list of the Top 20 stocks that had strong historical track records during the month of September. Here are how they performed in September 2022:
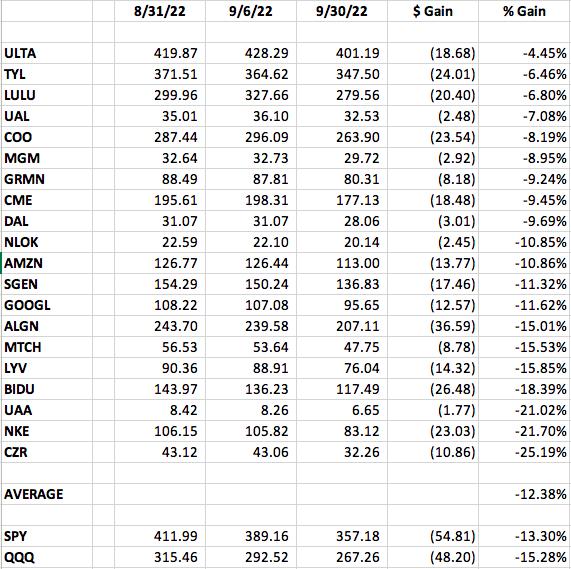
The percentages represent the returns from the August 31st close to the September 30th close. The average performance of -12.38% was better than both the NASDAQ 100's (QQQ) September performance of -15.28% and the S&P 500's (SPY) performance of -13.30%. The problem was the overall market performance more than anything else.
LULU was one stock that held up fairly well in September, which was rather remarkable given the huge decline in U.S. equities. But it still broke down on Friday under the weight of the selling. Here's the current LULU chart:
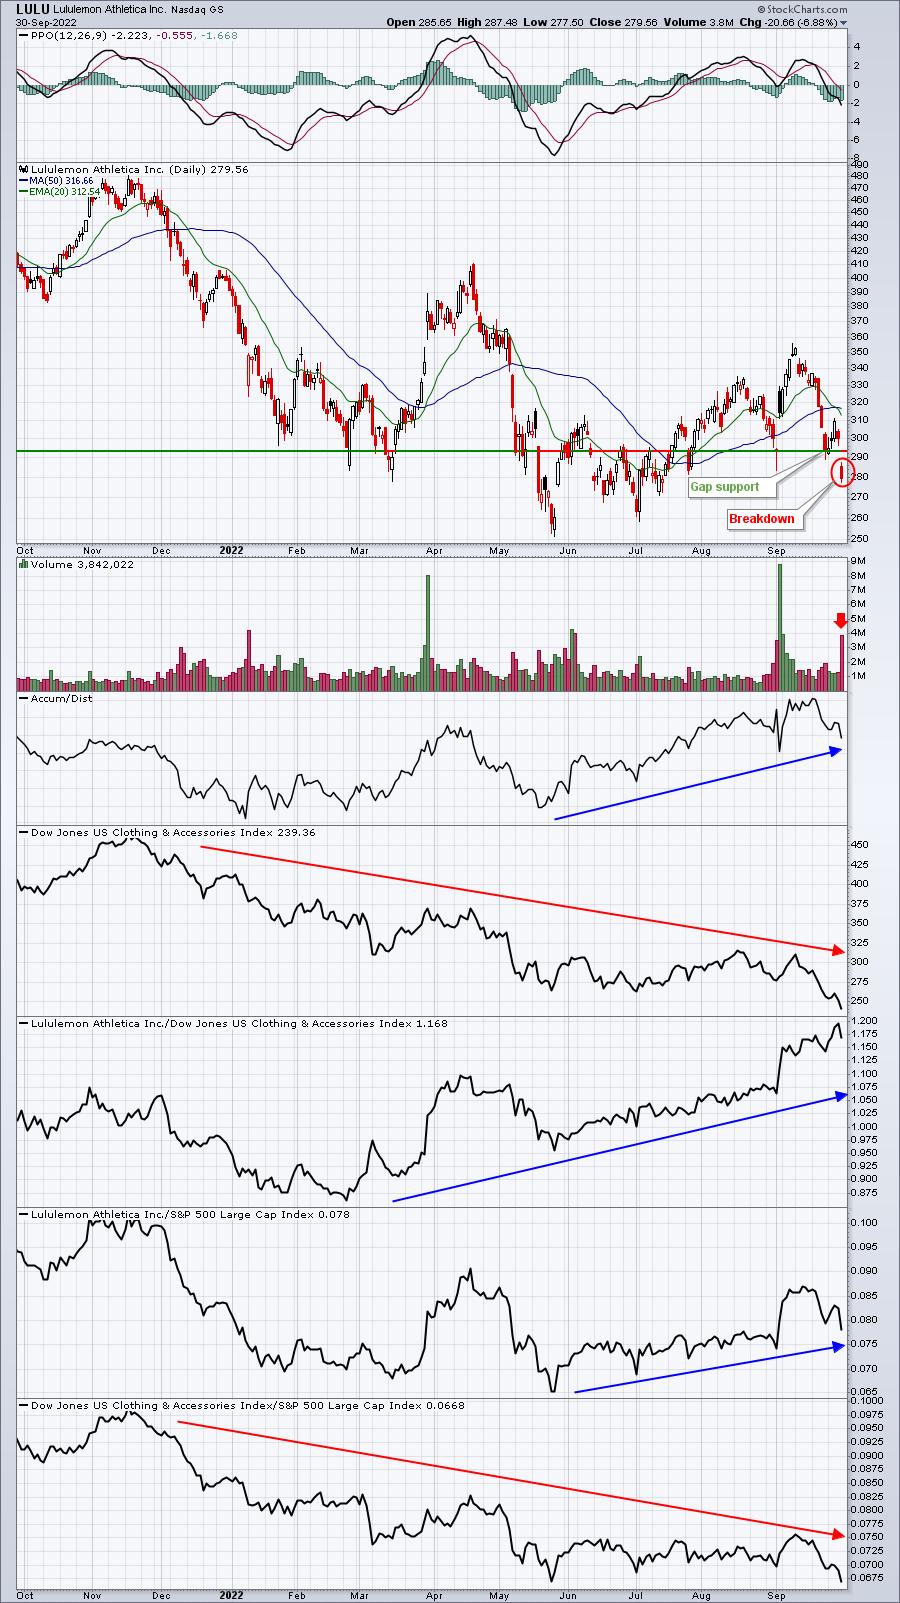
LULU is a solid stock within clothing & accessories ($DJUSCF). It's got a strong AD line as well. But when the overall market sells off strongly, even the leaders are taken down with it. While I believe LULU will be a great stock longer-term, there's the increased possibility that price support in the 255-260 range is tested based on this breakdown.
S&P 500 October Performance
Here's a breakdown of the annualized performance of the S&P 500 (since 1950) during the month of October:
- October 1-6: +35.78%
- October 7-9: -29.00%
- October 10-21: +14.94%
- October 22-27: -42.81%
- October 28-31: +67.55%
October is typically the month that stops the September bleeding - historically. October has risen 43 of the last 72 years. The stock market tends to perform quite well as we head into earnings season. That's true of January, April, July, and October. To illustrate this, I've broken down October in a slightly different manner, as follows:
- October 1-21: +14.72%
- October 22-27: -42.81%
- October 28-November 5: +69.19%
Historically, October starts off fairly well as the anticipation of Q3 earnings kicks in. Then, after the WORST week of the year from October 22nd through October 27th, we see one of the best periods of the year - from the October 27th close through the November 5th close. During this 9-calendar-day period, the S&P 500 has risen 51 of the last 72 years. October 27th also kicks off the most bullish extended period of the year. This period runs from the October 27th close through January 18th. This period has climbed 62 of the last 71 years, a very strong and impressive track record.
Sector Performance
Before we look at individual stocks, let's get an overview of how the various sectors and industries have performed during October (and November) over the past decade (during this secular bull market):
Sector Heat Map:
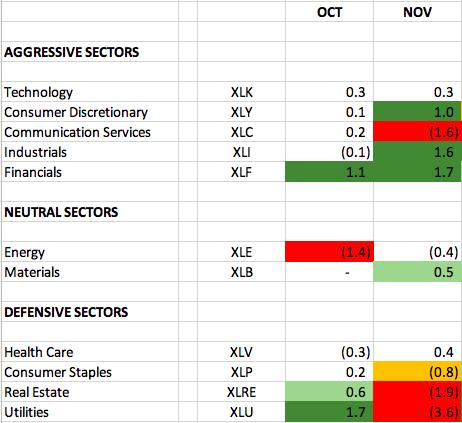
The numbers reflect how much a sector, on average, outperforms or underperforms the S&P 500 over the past 10 years. The dark green-shaded areas show significant outperformance (1.0 or greater). The light green-shaded areas show solid outperformance (from 0.5 to 1.0). The yellow-shaded areas show underperformance (-0.5 to -1.0). The red-shaded areas show significant underperformance (-1.0 or greater). Where there is no shading, there tends to be more neutral performance (-0.4 to 0.4).
It seems fairly clear to me that aggressive sectors tend to perform quite well during both October and November as there's a lot of relative outperformance. Financials (XLF) are particularly strong on a relative basis during both October and November. This is very interesting when we see the XLF testing key price support:
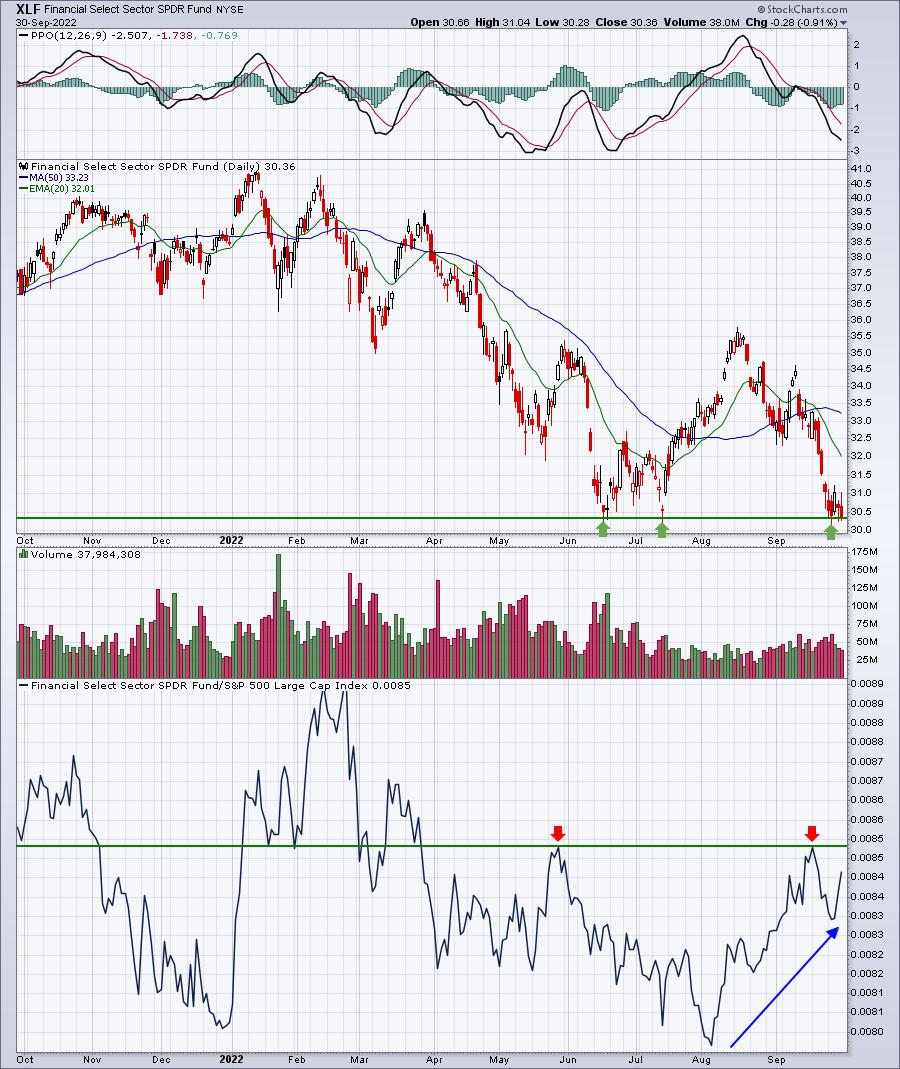
Will price support hold? Well, the overall market is struggling to do that, but if the XLF can hold onto price support and we see a big reversal in our major indices, watch that XLF:$SPX relative strength line above (bottom panel). It actually is turning up and a bit more relative strength the XLF could be trading at a 6-month relative high as it heads into a strong historical period.
Industry Performance
Let's take a look at the industry heat map within the financials (XLF) to drill down to the best seasonal strength in October and November over the past decade among the various industry groups (relative to the S&P 500):
Financials (XLF):
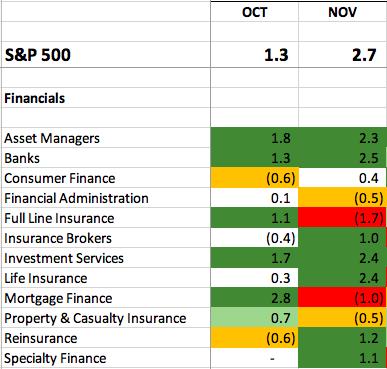
As you can see, there tends to be a lot of relative strength among the various industry groups within financials. Asset managers ($DJUSAG) and investment services ($DJUSSB) show the most historical relative strength over the past decade, but as we head into October, it appears that the DJUSSB is the favored group:
DJUSAG vs. DJUSSB:
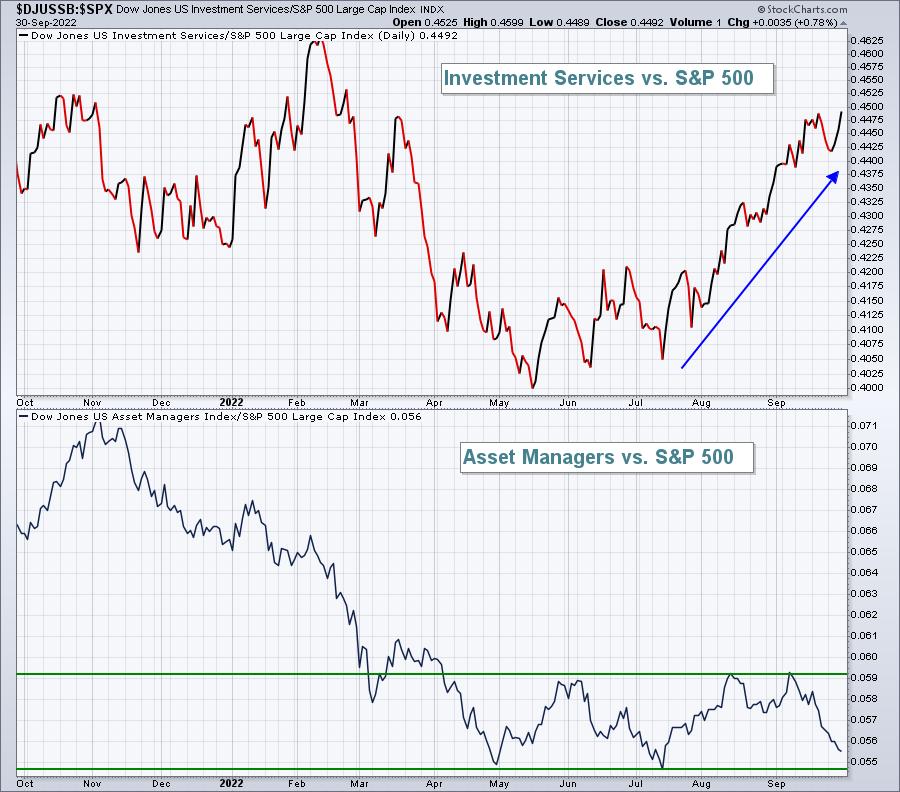
This is how each industry group is currently performing vs. the benchmark S&P 500. The DJUSSB is rallying on a relative basis, just set a new 7-month relative high, and is trending higher, in a clear relative uptrend, while the DJUSAG has been weakening. Perhaps that changes in October, but as a momentum trader, I prefer the look of the DJUSSB right now.
Here are industry groups (within sectors other than financials) that tend to perform much better than the benchmark S&P 500 during October:
Technology (XLK):
- renewable energy, software, computer hardware
Consumer Discretionary (XLY):
- automobiles
Communication Services (XLC):
- internet
Industrials (XLI):
- airlines, delivery services
Health care (XLV):
- health care providers
Consumer staples (XLP):
- tires, tobacco
Real estate (XLRE):
- none
Utilities (XLU):
- conventional electricity, multiutilities, water
Energy (XLE):
- none
Materials (XLB):
- steel, nonferrous metals, paper
Stocks for October
We've selected our Top 20 seasonal stocks for October from the S&P 500, NASDAQ 100, S&P 400 Mid Cap, and S&P 600 Small Cap (latter two have just been added to our research platform). Several names represent sectors and industry groups that have been discussed above. Others simply stand out in October based on their own historical track record.
The stocks this month are as follows:
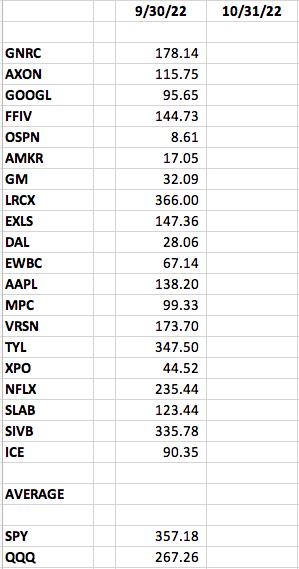
Many of these stocks are trending lower and are beneath their declining 20-day EMAs. Any short-term bounce could easily test this moving average, but I wouldn't expect that we're going to soar right through them. So, if I were to trade any of these types of setups, I'd take profits as price approached this key moving average. I would also tend to favor stocks on this list that show leadership within their industry group and have strong AD lines.
A "Seasonality - October 2022" ChartList has been created and will be available for viewing/download on our website later this weekend or early Monday morning. You must be a StockCharts.com Extra or Pro member to download our ChartLists. Basic members and non-StockCharts.com members can view the charts one at a time. The charts will be annotated with a key support level (or two) to watch on any pullback.
There were a few changes made to the names on the ChartList. Here's a quick glance at what I'm referring to, with an explanation below:
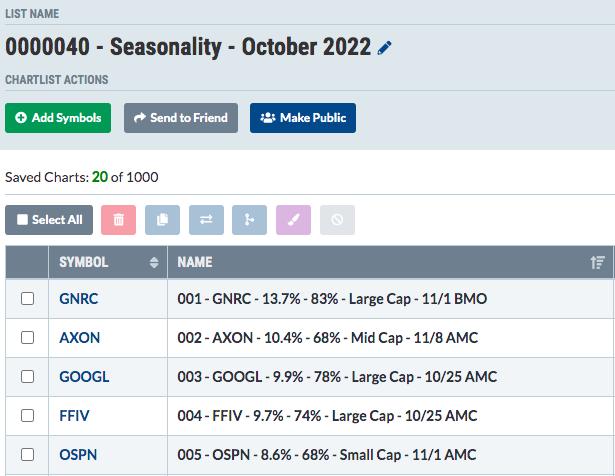
So let me explain what these names mean. First, they're in October performance order, so of the 20 stocks included on this ChartList, GNRC is the best historical performer in October, gaining an average of 13.7%. It's risen 83% of Octobers and belongs to the Large Cap asset class. GNRC is slated (estimated) to report its latest quarterly results on 11/1 before the market opens (BMO). I want to EMPHASIZE that this earnings date is an estimate currently. These dates may change, but we will NOT be updating earnings date changes. So please be sure to check on the earnings dates for any companies that you might trade off this list.
Happy trading!
Tom