
EB Monthly Seasonality Report - November 2022
A Look Back At October Stocks:
Earlier this month, we provided a list of the Top 20 stocks that had strong historical track records during the month of October. Here are how they performed in October 2022:
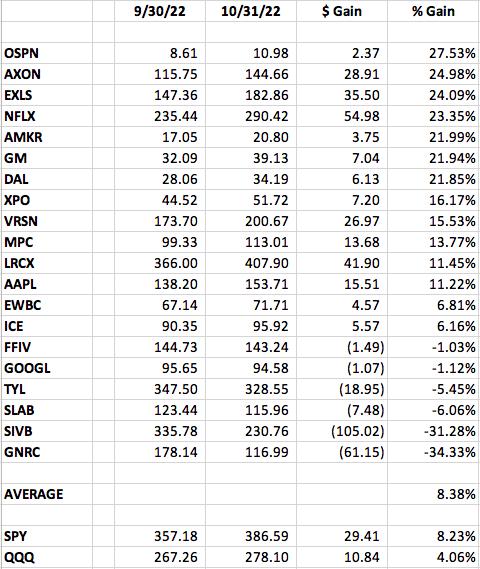
The percentages represent the returns from the September 30th close to the October 31st price as of 1pm ET. The average performance of +8.38% was better than both the NASDAQ 100's (QQQ) October performance of +4.06% and the S&P 500's (SPY) performance of +8.23%. The rising tide lifted MOST boats. Clearly, GNRC and SIVB had rough Octobers.
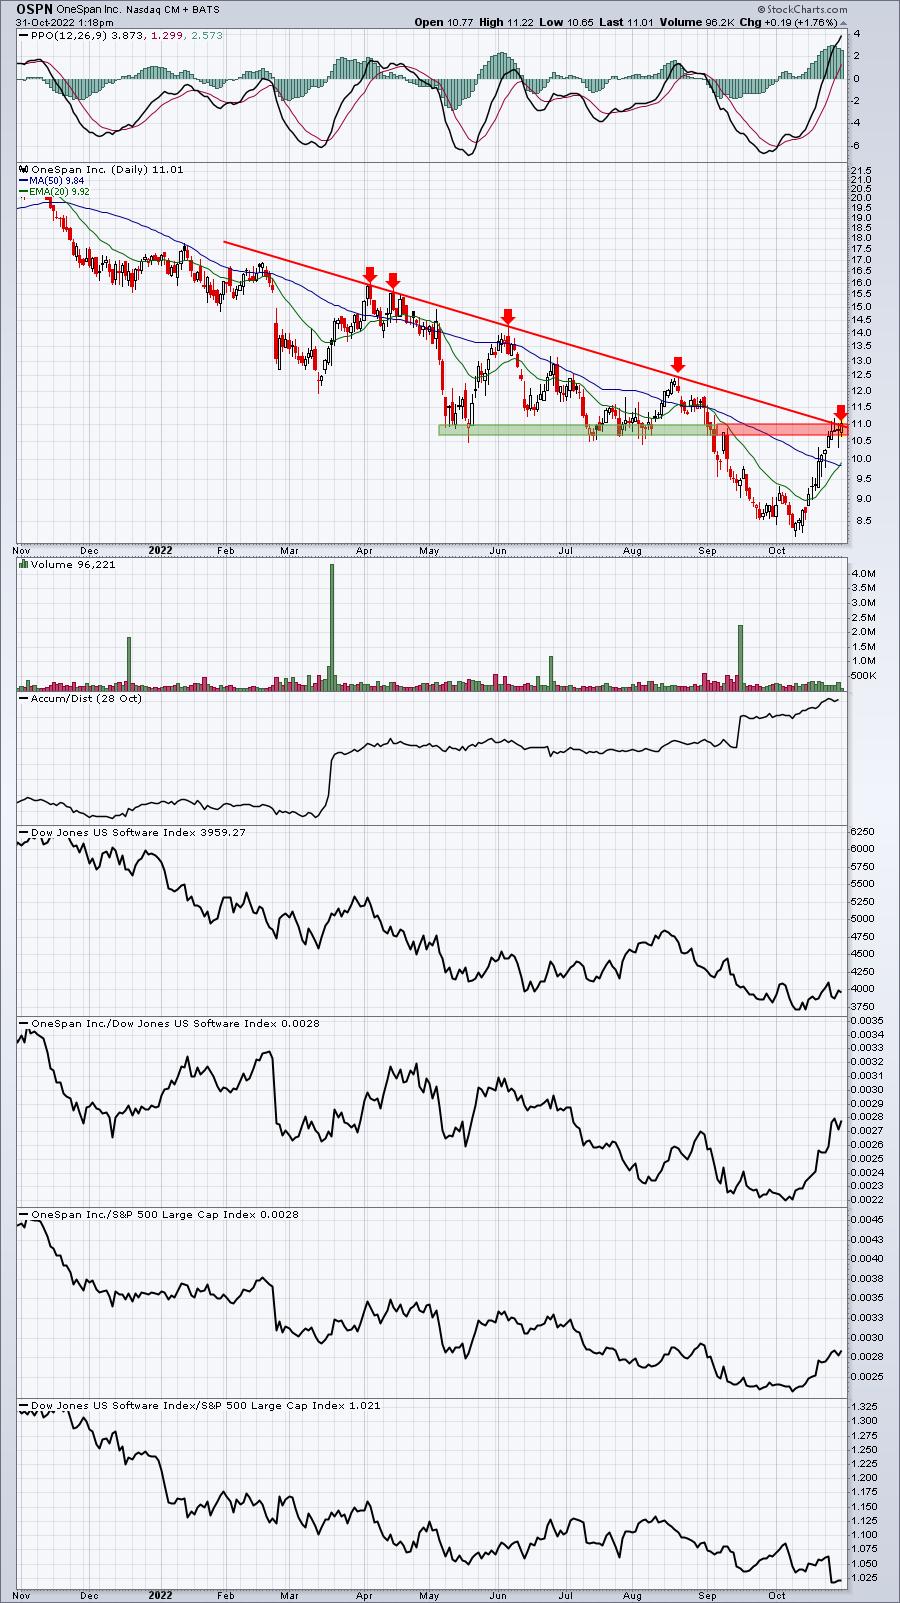
The best performer was OSPN, which simply returned to a critical price resistance level after September selling created a massively oversold condition. Here's what OSPN now looks like:
S&P 500 November Performance
Here's a breakdown of the annualized performance of the S&P 500 (since 1950) during the month of November:
- November 1-5: +70.55%
- November 6-10: -4.23%
- November 11-17: +8.87%
- November 18-20: -42.96%
- November 21-30: +41.09%
November represents the early part of the most bullish period of the year - from the close on October 27th through the close on January 18th. November has risen 49 of the last 72 years. Only December and April have risen more often than November. Also, November's annualized return since 1950 of 19.91% is slightly more than double the average annual return on the S&P 500 over the same period. November ranks #1 among all calendar months in terms of annualized return, with December and April close behind.
Historically, November typically gets off to a VERY bullish start, then trends mostly sideways from the 6th through the 17th. After a brief period of selling, likely due to options expiration, November then strengthens once again throughout the balance of the month and right into early December. The November 22nd through December 6th period has produced annualized returns of +33.62% over the past 7 decades.
Sector Performance
Before we look at individual stocks, let's get an overview of how the various sectors and industries have performed during November (and December) over the past decade (during this secular bull market):
Sector Heat Map:
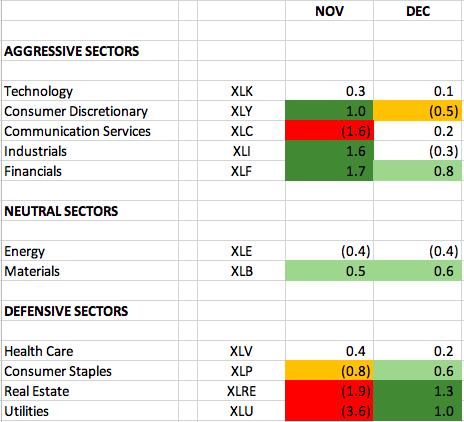
The numbers reflect how much a sector, on average, outperforms or underperforms the S&P 500 over the past 10 years. The dark green-shaded areas show significant outperformance (1.0 or greater). The light green-shaded areas show solid outperformance (from 0.5 to 1.0). The yellow-shaded areas show underperformance (-0.5 to -1.0). The red-shaded areas show significant underperformance (-1.0 or greater). Where there is no shading, there tends to be more neutral performance (-0.4 to 0.4).
It seems fairly clear to me that aggressive sectors tend to perform quite well during November, but we should be more careful in December. Financials (XLF) are particularly strong on a relative basis during both November and December. I covered financials, however, in the October Seasonality Report, so let's look at industrials (XLI), which also love the month of November:
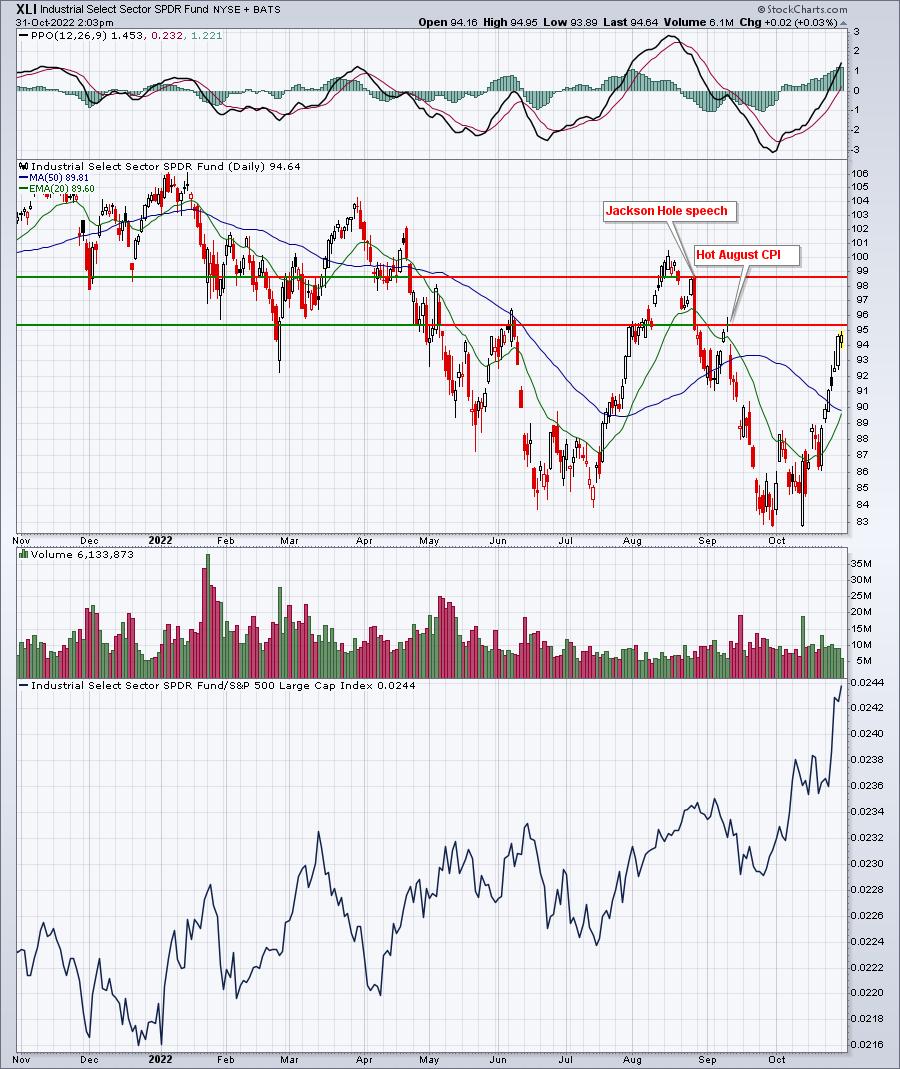
Industrials absolutely LOVE November. They've risen in 12 of the last 13 Novembers and the XLI has also outperformed the S&P 500 in 12 of the last 13 Novembers. That's a strong track record. And as November begins, relative strength couldn't be much stronger as that lower panel above shows.
Industry Performance
Let's take a look at the industry heat map within the industrials (XLI) to drill down to the best seasonal strength in November and December over the past decade among the various industry groups (relative to the S&P 500):
Industrials (XLI):
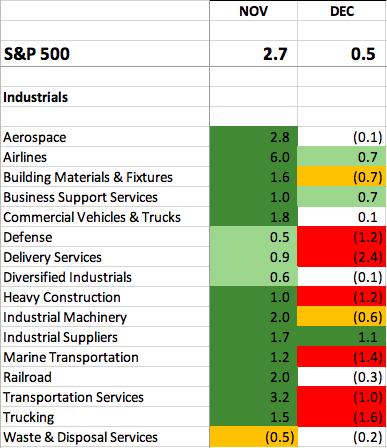
As you can see, there tends to be widespread relative strength in November among the various industry groups within industrials. Airlines ($DJUSAR) and transportation services ($DJUSTS) show the most historical relative strength in November over the past decade, but I'm not sure how much I trust those two groups based on current technical conditions. Instead, I find the aerospace ($DJUSAS) and railroads ($DJUSRR) as areas that could represent solid areas for potential trades. Let's check these two out:
DJUSAS:
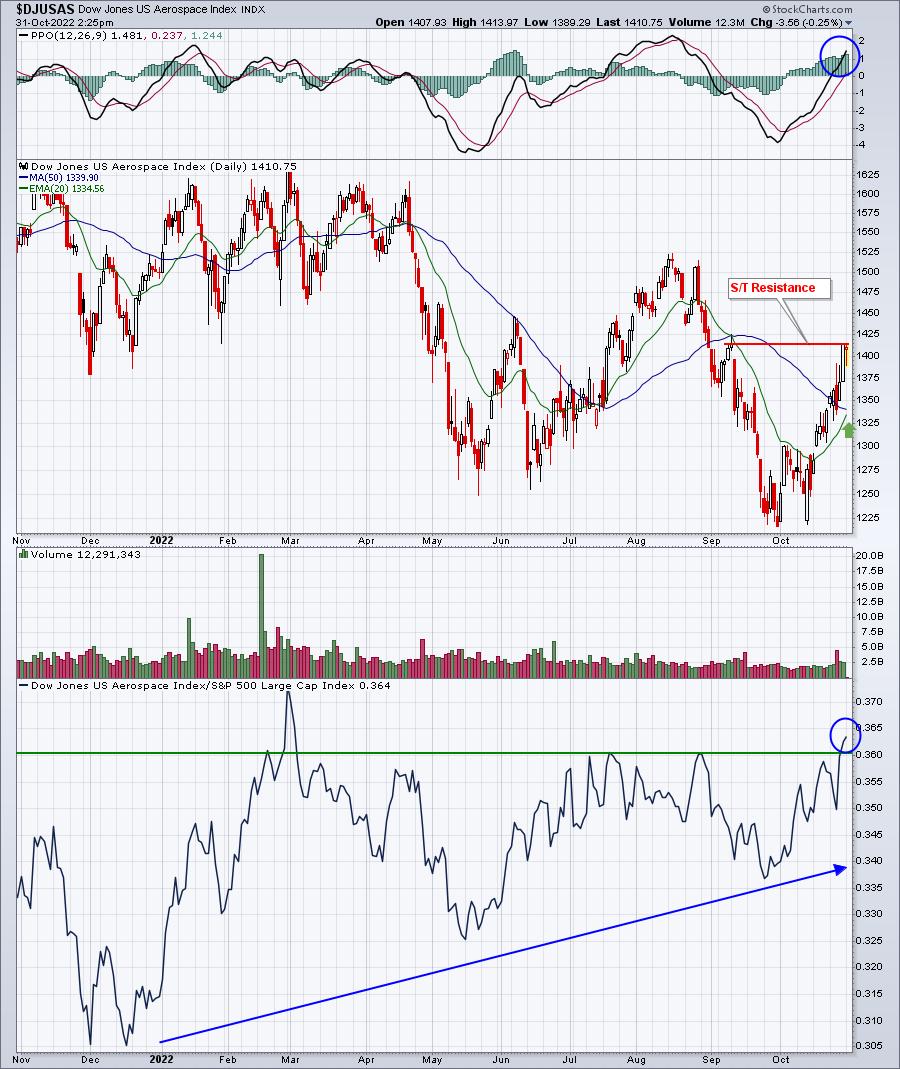
This is a group that's already had a nice run, but could be an excellent area if we see any short-term selling. The rising 20-day EMA should offer up excellent support. A close above 1415 could lead to ongoing short-term strength, but failure here could suggest a better trading opportunity ahead.
DJUSRR:
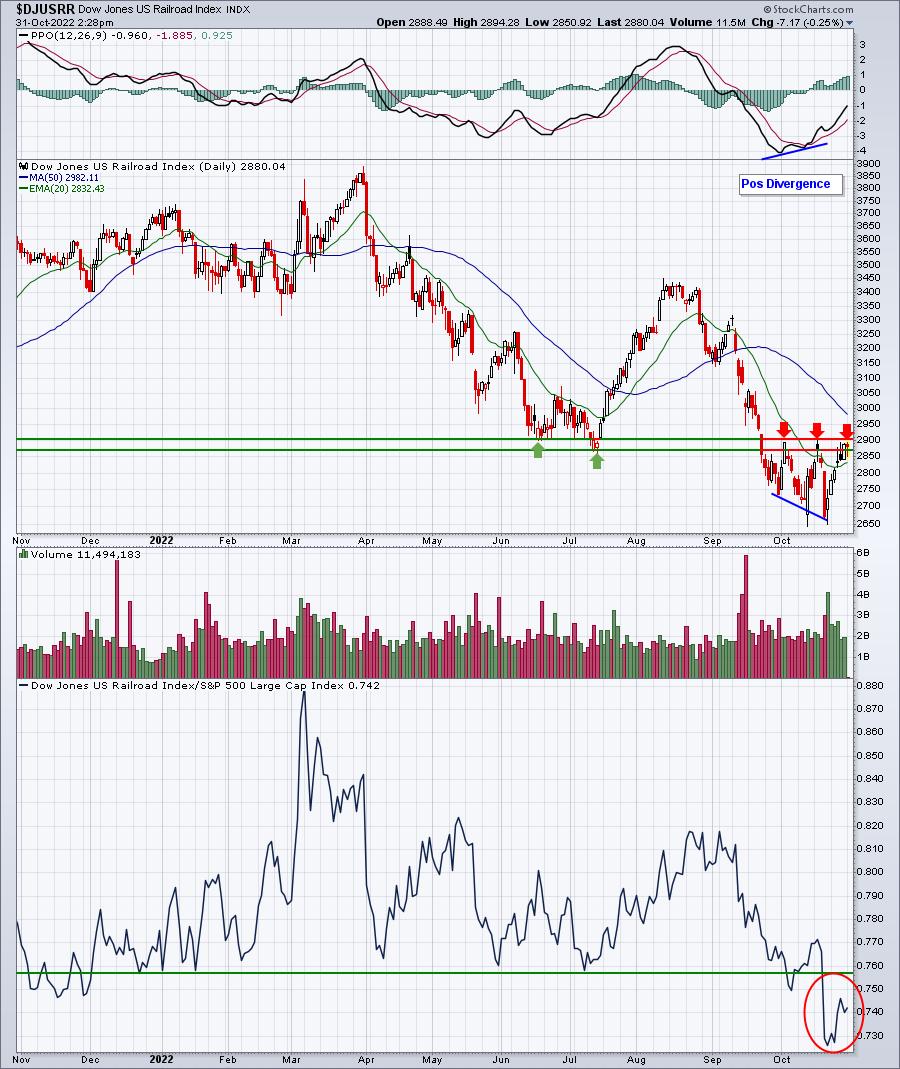
I want to see a breakout on railroads before I'd grow more bullish. But many of the industry groups within industrials are currently overbought. Railroads are not, so a breakout could lead to a much more significant run in November. The group has been underperforming, though, so a cautious approach with appropriate stops in place is warranted.
Here are industry groups (within sectors other than industrials) that tend to perform much better than the benchmark S&P 500 during November:
Technology (XLK):
- semiconductors, electrical components & equipment, electronic equipment
Consumer Discretionary (XLY):
- automobiles, home construction, hotels, apparel retailers, durable household products, recreational products, broadline retailers, furnishings
Communication Services (XLC):
- media agencies
Financials (XLF):
- banks, life insurance, investment services, asset managers
Health care (XLV):
- biotechnology, health care providers
Consumer staples (XLP):
- food retailers & wholesalers, tires, drug retailers
Real estate (XLRE):
- real estate services, hotels & lodging REITs
Utilities (XLU):
- none
Energy (XLE):
- none
Materials (XLB):
- aluminum, nonferrous metals
Stocks for November
We've selected our Top 20 seasonal stocks for November from the S&P 500, NASDAQ 100, S&P 400 Mid Cap, and S&P 600 Small Cap (latter two were added to our research platform last month). Several names represent sectors and industry groups that have been discussed above. Others simply stand out in November based on their own historical track record.
The stocks this month are as follows:
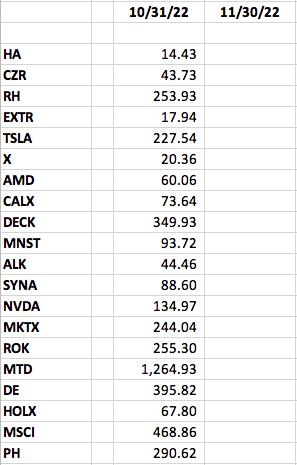
A "Seasonality - November 2022" ChartList (annotated with 1 or 2 support levels to watch) has been created and will be available for viewing/download on our website later today or tomorrow. You must be a StockCharts.com Extra or Pro member to download our ChartLists. Basic members and non-StockCharts.com members can view the charts one at a time.
Happy trading!
Tom