
EB Monthly Seasonality Report - February 2023
A Look Back At January Stocks:
One month ago, we provided a list of the Top 20 stocks that had strong historical track records during the month of January. Here are how they performed in January 2023:
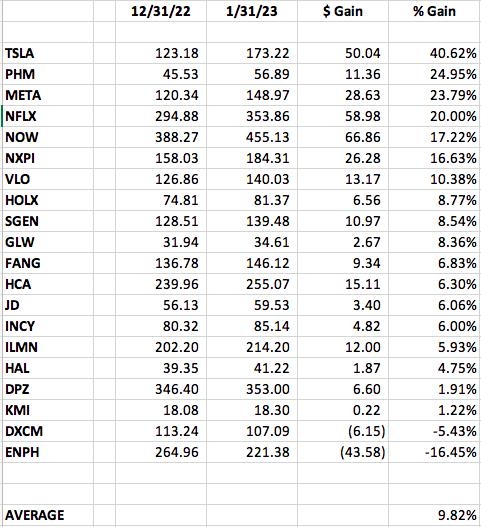
The percentages represent the returns from the December 31st close to the January 31st close. The average performance of +9.82% was much better than the S&P 500 performance (+6.29%), but was just shy of the NASDAQ, which gained a little more than 10%. It was a solid month for most U.S. stocks, but especially growth stocks.
A number of these stocks look much better technically, as you might expect, but NOW is a stock that has really turned the corner technically. Check out this weekly chart:
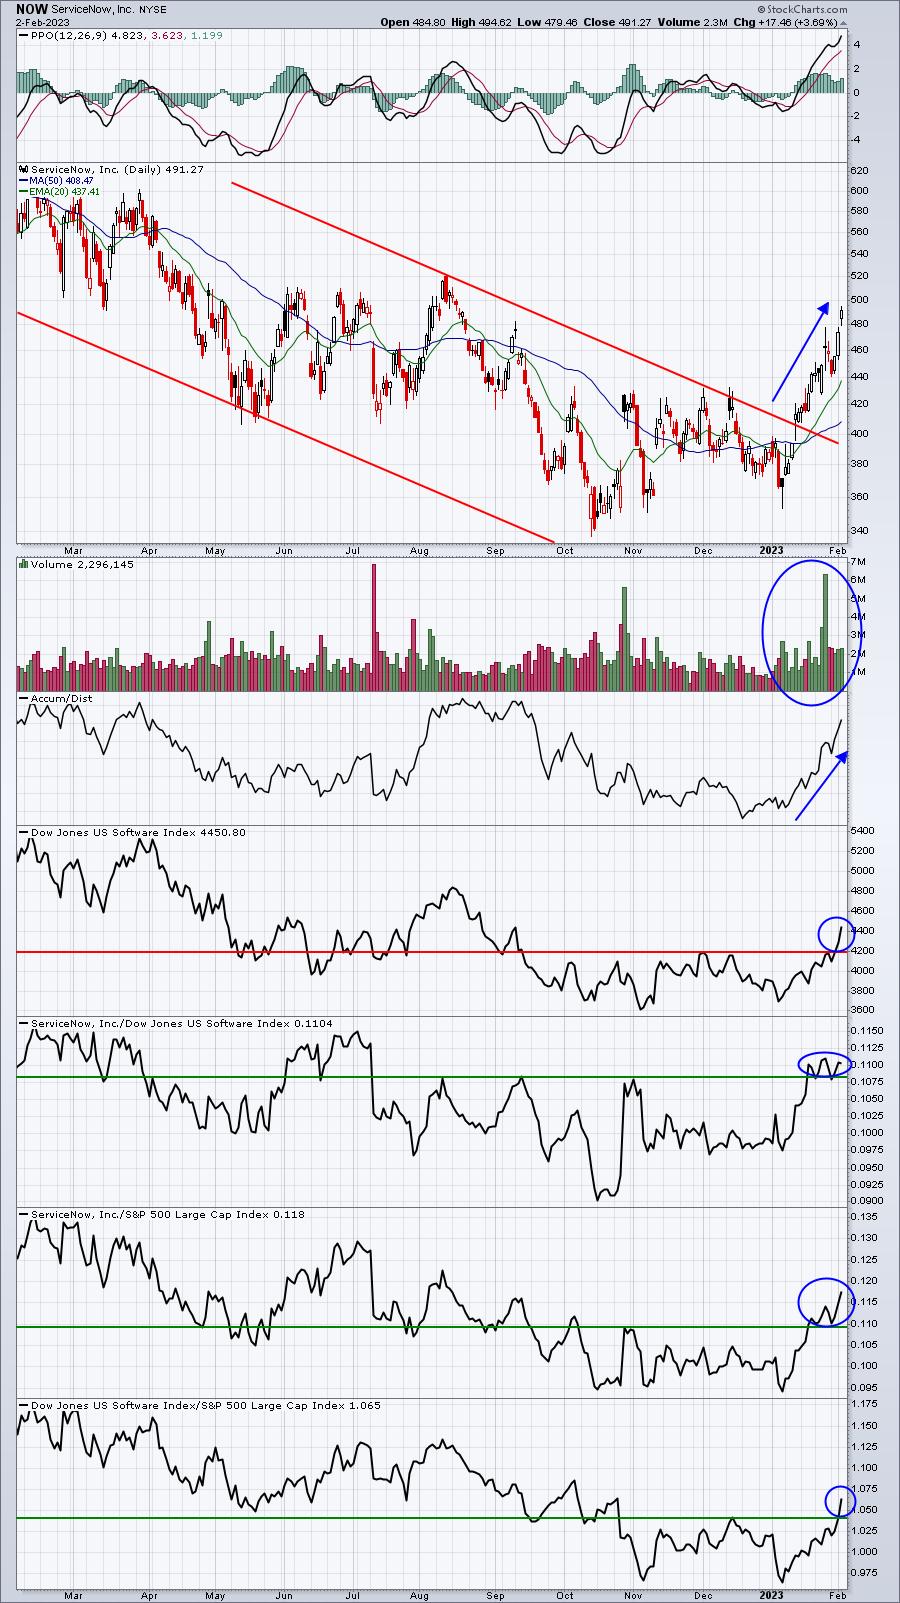
Trips back to test the now-rising 20-day EMA would be solid entry points, in my view.
S&P 500 February Performance
Here's a breakdown of the annualized performance of the S&P 500 (since 1950) during the month of February:
- February 1-3: +38.39%
- February 4-11: -12.25%
- February 12-15: +38.69%
- February 16-23: -19.38%
- February 24-26: +14.05%
- February 27-29: -38.51%
February is a fairly bearish month, but it's one where we tend to see much more strength in the first half of the month vs. the second half. February has gained ground 40 of 73 years since 1950. Also, February's annualized return since 1950 is -0.38% and ranks 11th among all calendar months in terms of annualized return, besting only September's -7.81%. Here is a breakdown of February performance by first half (Feb 1-15) and second half (Feb 16-29):
- February 1-15: +11.06%
- February 16-29: -14.65%
This is fairly typical for most calendar quarters. There tends to be a divergence at the middle point of second months (Feb, May, and Aug) of calendar quarters. The first half of quarters tends to significantly outperform the second half. November was not included, because Q4 doesn't seem to play by those rules.
Sector Performance
Before we look at individual stocks, let's get an overview of how the various sectors and industries have performed during February (and March) over the past decade (during this secular bull market):
Sector Heat Map:
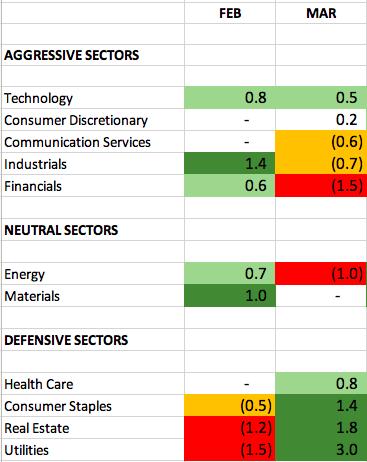
The numbers reflect how much a sector, on average, outperforms or underperforms the S&P 500 over the past 10 years. The dark green-shaded areas show significant outperformance (1.0 or greater). The light green-shaded areas show solid outperformance (from 0.5 to 1.0). The yellow-shaded areas show underperformance (-0.5 to -1.0). The red-shaded areas show significant underperformance (-1.0 or greater). Where there is no shading, there tends to be more neutral performance (-0.4 to 0.4).
Technology (XLK) is the only sector that has outperformed the S&P 500 over the past 10 years in both February and March, so let's look at that chart currently:
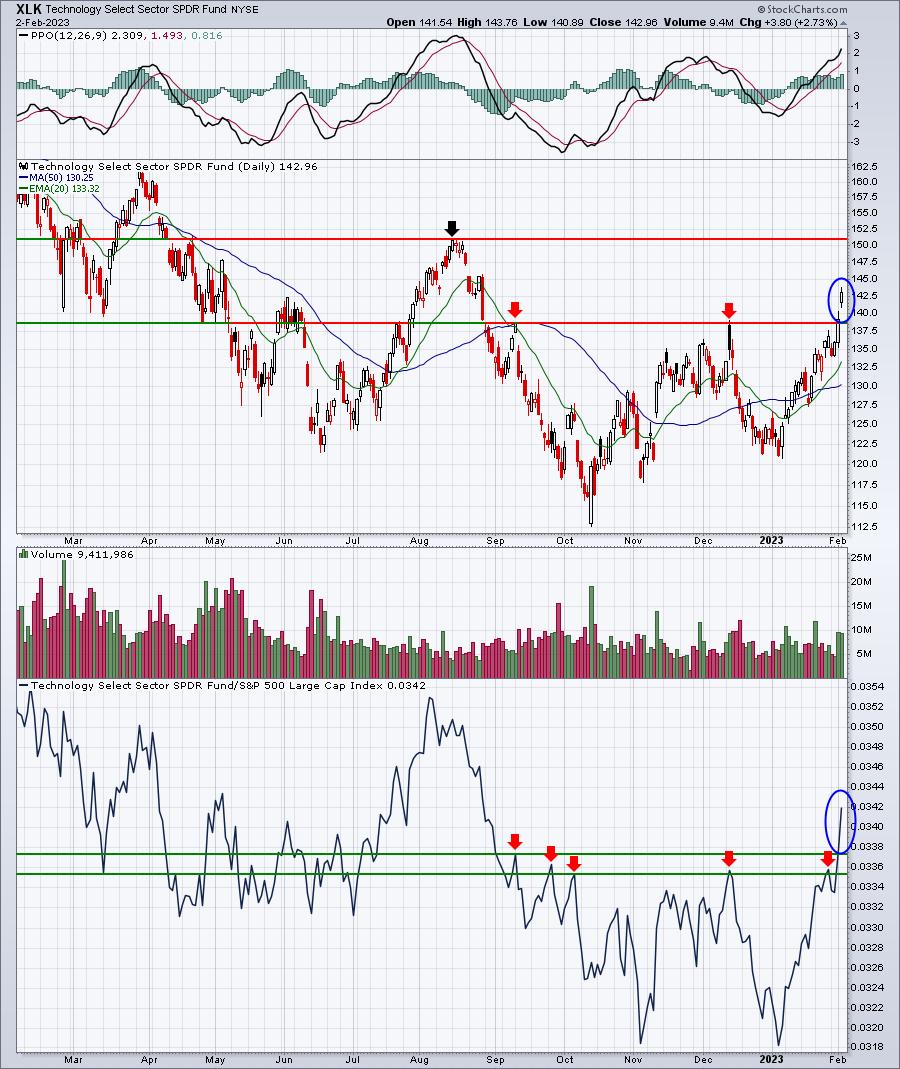
It's hard not to like the technical picture here. The XLK has just broken to a multi-month relative high vs. the S&P 500, while also closing above absolute price resistance. I would expect an upcoming test of August price resistance, though we are overbought short-term. Watch the 20-day EMA as solid support as we move forward.
Industry Performance
Let's take a look at the industry heat map within technology (XLK) to drill down to the best seasonal strength in February and March over the past decade among the various industry groups (relative to the S&P 500):
Technology (XLK):
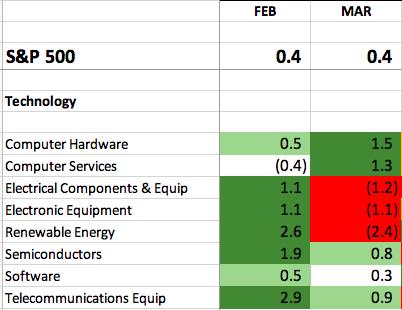
Telecom equipment ($DJUSCT) and semiconductors ($DJUSSC) show the most relative strength over the next two months within the technology sector. Check out the DJUSSC seasonality chart, relative to the S&P 500:
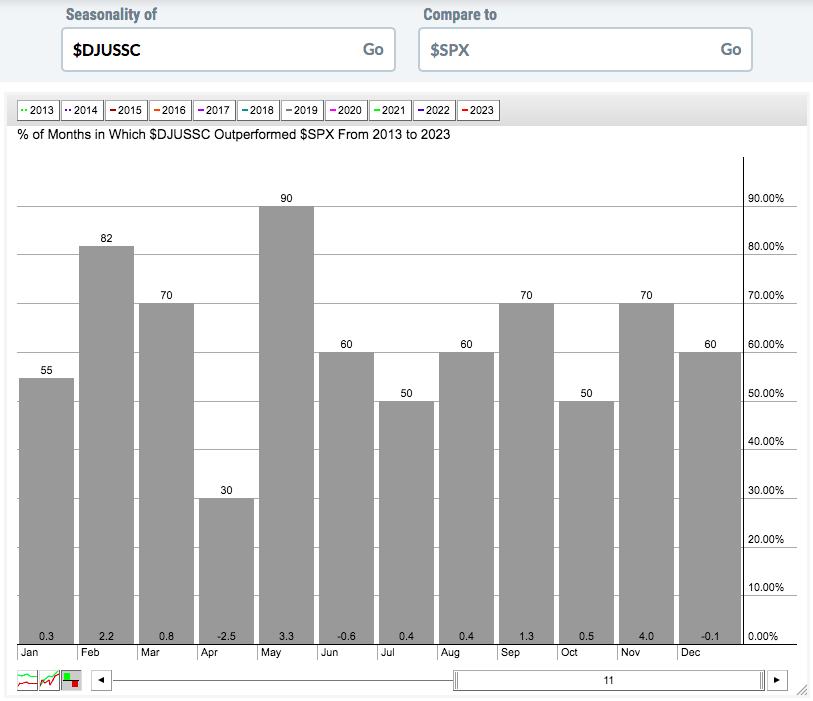
February and March represent the two best consecutive relative strength months for the DJUSSC, other than October and November. So I'm expecting the recent rally to continue, with periods of profit taking along the way. Semis are likely to be a big part of any continuing rally.
Here are industry groups (within sectors other than technology) that tend to perform much better than the benchmark S&P 500 during February:
Consumer Discretionary (XLY):
- travel & tourism, hotels, gambling, specialty retailers, apparel retailers, auto parts, toys
Communication Services (XLC):
- media agencies
Industrials (XLI):
- marine transportation, aerospace, defense, airlines, commercial vehicles, heavy construction, railroads, trucking
Financials (XLF):
- insurance brokers, consumer finance, specialty finance, property & casualty insurance, financial administration, reinsurance
Health care (XLV):
- none
Consumer staples (XLP):
- tires, tobacco, personal products
Real Estate (XLRE):
- real estate services, real estate holding & development, hotel & lodging REITs
Utilities (XLU):
- none
Energy (XLE):
- coal
Materials (XLB):
- nonferrous metals, aluminum, steel, gold mining, mining
Stocks for February
We've selected our Top 20 seasonal stocks for February. Several names represent sectors and industry groups that have been discussed above. Others simply stand out in February based on their own historical track record.
The stocks this month are as follows:
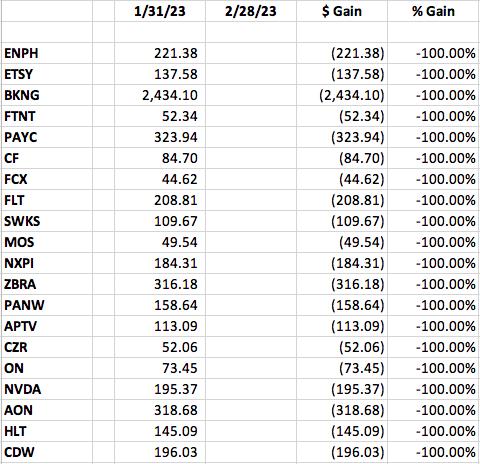
A "Seasonality - February 2023" ChartList (annotated with 1 or 2 support levels to watch) will be created and available for viewing/download on our website tomorrow morning. You must be a StockCharts.com Extra or Pro member to download our ChartLists. Basic members and non-StockCharts.com members can view the charts one at a time.
Happy trading!
Tom