
EB Monthly Seasonality Report - March 2023
A Look Back At February Stocks:
One month ago, we provided a list of the Top 20 stocks that had strong historical track records during the month of February. Here are how they've performed in February 2023 (through the February 27th close):
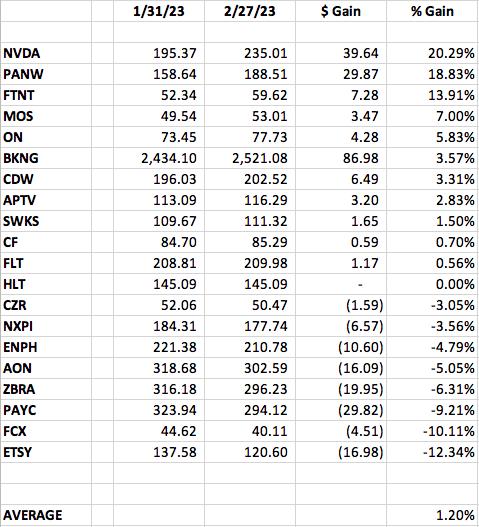
The percentages represent the returns from the January 31st close to the February 27th close. The average performance of +1.20% was much better than the S&P 500 performance (-2.15%), and slightly better than the NASDAQ, which finished fractionally lower. Our Top 20 Seasonality stocks had a solid month for sure.
MOS was a nice February performer, but what's really impressive is its AD line, which is absolutely soaring. It certainly appears as though plenty of accumulation is taking place here:
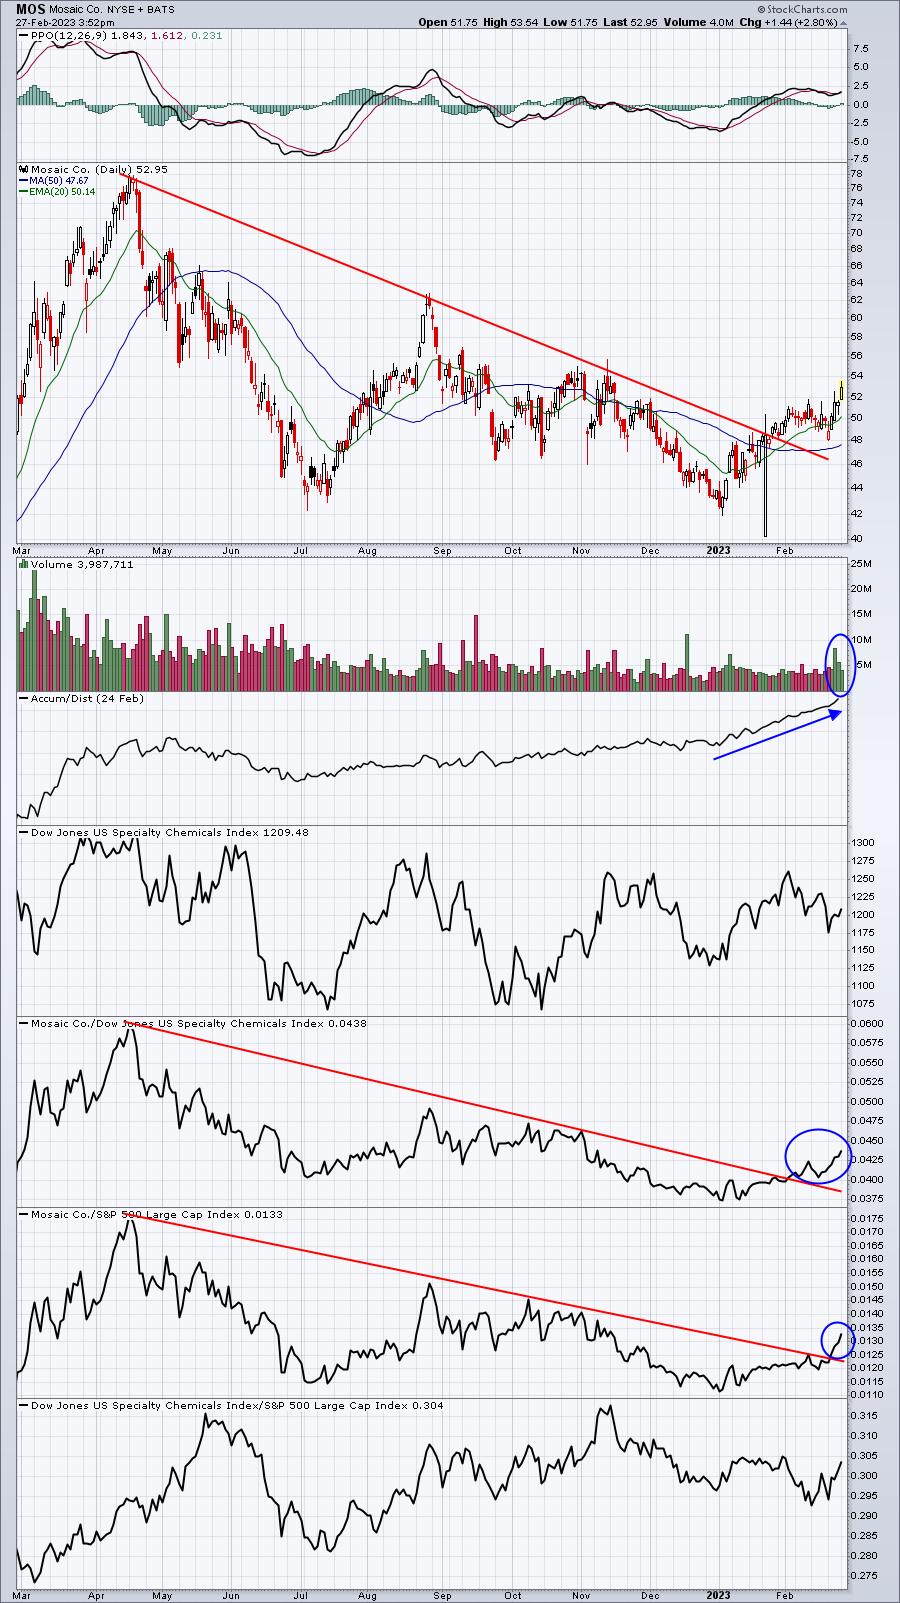
Just about everything on this chart seems to be turning bullish. Absolute and relative price downtrends have been broken, the industry group appears to be strengthening, and MOS is quickly becoming a leading stock in its industry. MOS appears poised technically to reach for higher prices over the next few weeks to months, though its seasonal tendencies cool off significantly from January and February, which were quite bullish.
S&P 500 March Performance
Here's a breakdown of the annualized performance of the S&P 500 (since 1950) during the month of March:
- March 1-5: +39.41%
- March 6-9: -21.18%
- March 10-18: +33.25%
- March 19-31: -0.46%
March is a slightly bullish month, but most of its strength is typically found in the first 2-3 weeks. The back end of the month has a history of being relatively flat. March has gained ground 47 of 73 years since 1950. Also, March's annualized return since 1950 is +12.66% and ranks 5th among all calendar months in terms of annualized return.
Sector Performance
Before we look at individual stocks, let's get an overview of how the various sectors and industries have performed during March (and April) over the past decade (during this secular bull market):
Sector Heat Map:
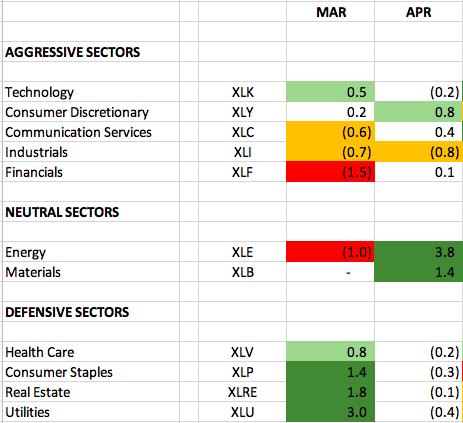
The numbers reflect how much a sector, on average, outperforms or underperforms the S&P 500 over the past 10 years. The dark green-shaded areas show significant outperformance (1.0 or greater). The light green-shaded areas show solid outperformance (from 0.5 to 1.0). The yellow-shaded areas show underperformance (-0.5 to -1.0). The red-shaded areas show significant underperformance (-1.0 or greater). Where there is no shading, there tends to be more neutral performance (-0.4 to 0.4).
The aggressive sectors tend to just ride along with the S&P 500 during March and are instead led by defensive sectors. Utilities (XLU), in particular, shine during the month of March and have a history of performing best during the third calendar month of each quarter (Mar, Jun, Sep, Dec). Here's how the XLU looks as we approach March:
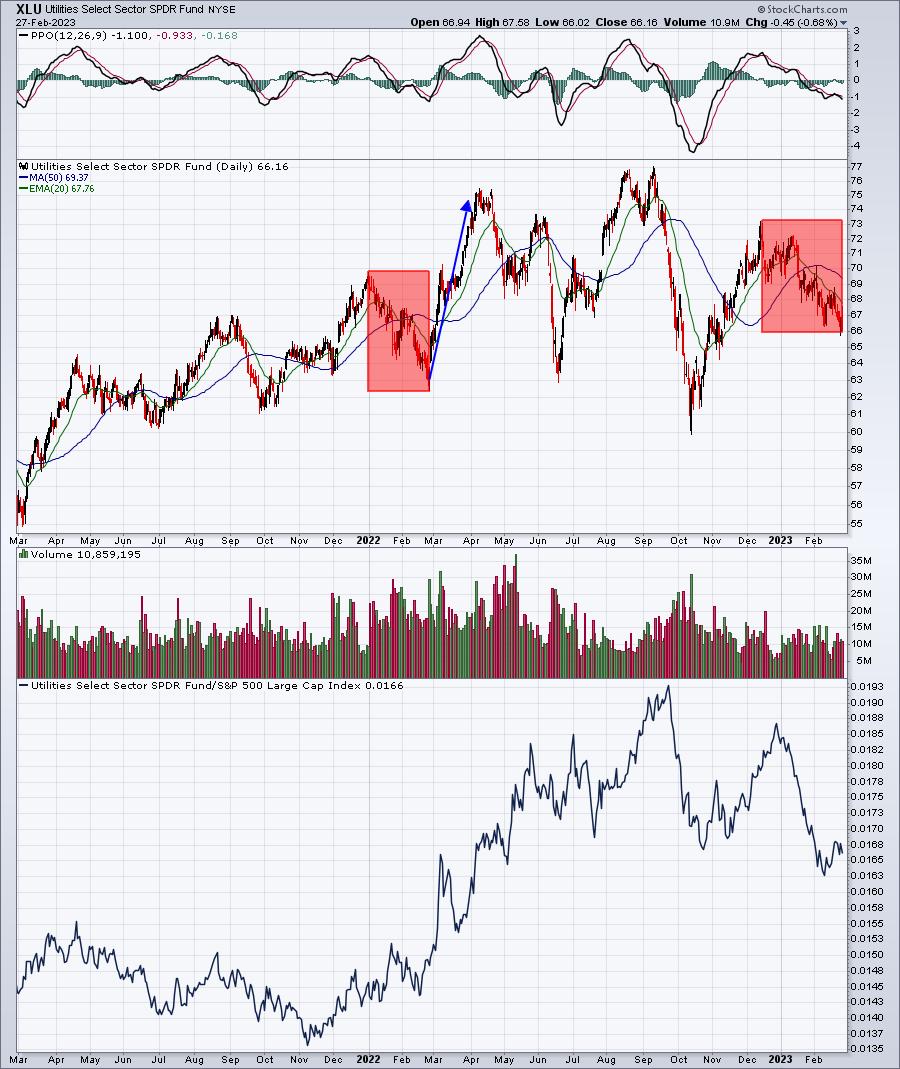
Note that March 2022 looked very similar to March 2023. We saw ugliness leading up to March 2022, the same as we're seeing now. And, on a dime, the XLU turned higher in March 2022 and produced an excellent month. It's quite possible we see something similar in 2023.
Industry Performance
Let's take a look at the industry heat map within utilities (XLU) to drill down to the best seasonal strength in March and April over the past decade among the various industry groups (relative to the S&P 500):
Utilities (XLU):
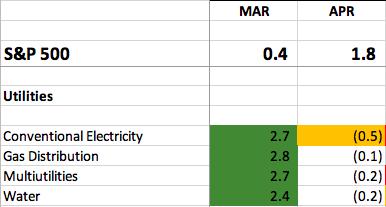
The strength in utilities has been fairly evenly distributed among its four industry groups in March, so if utilities strengthen in March 2023, I'd expect all of the groups to perform well - at least that's been the seasonal tendency.
Here are industry groups (within sectors other than utilities) that tend to perform much better than the benchmark S&P 500 during March:
Technology (XLK):
- computer hardware, computer services
Consumer Discretionary (XLY):
- broadline retailers
Communication Services (XLC):
- mobile telecommunications
Industrials (XLI):
- waste & disposal services, business support services, delivery services, heavy construction, industrial suppliers
Financials (XLF):
- specialty finance
Health care (XLV):
- health care providers, pharmaceuticals
Consumer staples (XLP):
- food products, brewers, distillers & vintners, food retailers & wholesalers, nondurable household products
Real Estate (XLRE):
- specialty REITs, industrial & office REITs
Energy (XLE):
- none
Materials (XLB):
- steel, gold mining, mining
Stocks for March
We've selected our Top 20 seasonal stocks for March. Several names represent sectors and industry groups that have been discussed above. Others simply stand out in March based on their own historical track record.
The stocks this month are as follows:
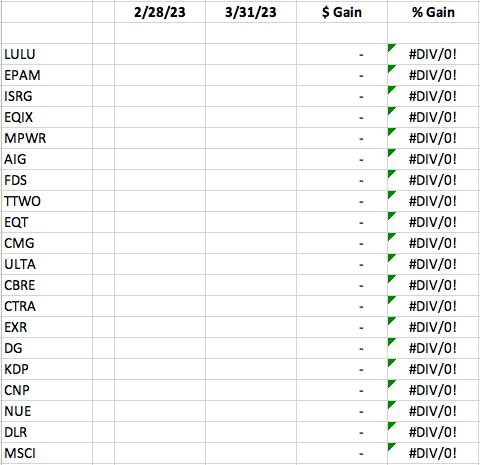
A "Seasonality - March 2023" ChartList (annotated with 1 or 2 support levels to watch) has been created and will be available for viewing/download on our website tomorrow morning. You must be a StockCharts.com Extra or Pro member to download our ChartLists. Basic members and non-StockCharts.com members can view the charts one at a time.
Happy trading!
Tom