
EB Monthly Seasonality Report - May 2023
A Look Back At April Stocks:
One month ago, we provided a list of the Top 20 stocks that had strong historical track records during the month of April. Here are how they performed in April 2023 (through the April 28th close):
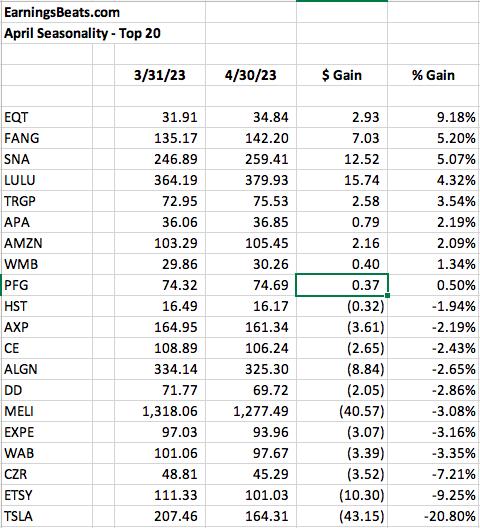
The percentages represent the returns from the March 31st close to the April 30th close. The average performance of -1.27% was below the S&P 500 performance (+1.60%) and the NASDAQ performance (+0.51%). Our Top 20 Seasonality stocks had a decent month, but Tesla's (TSLA, -20.80%) weakness weighed on the aggregate performance.
EQT was the best April performer on our list, but it's by no means in a nice uptrend:
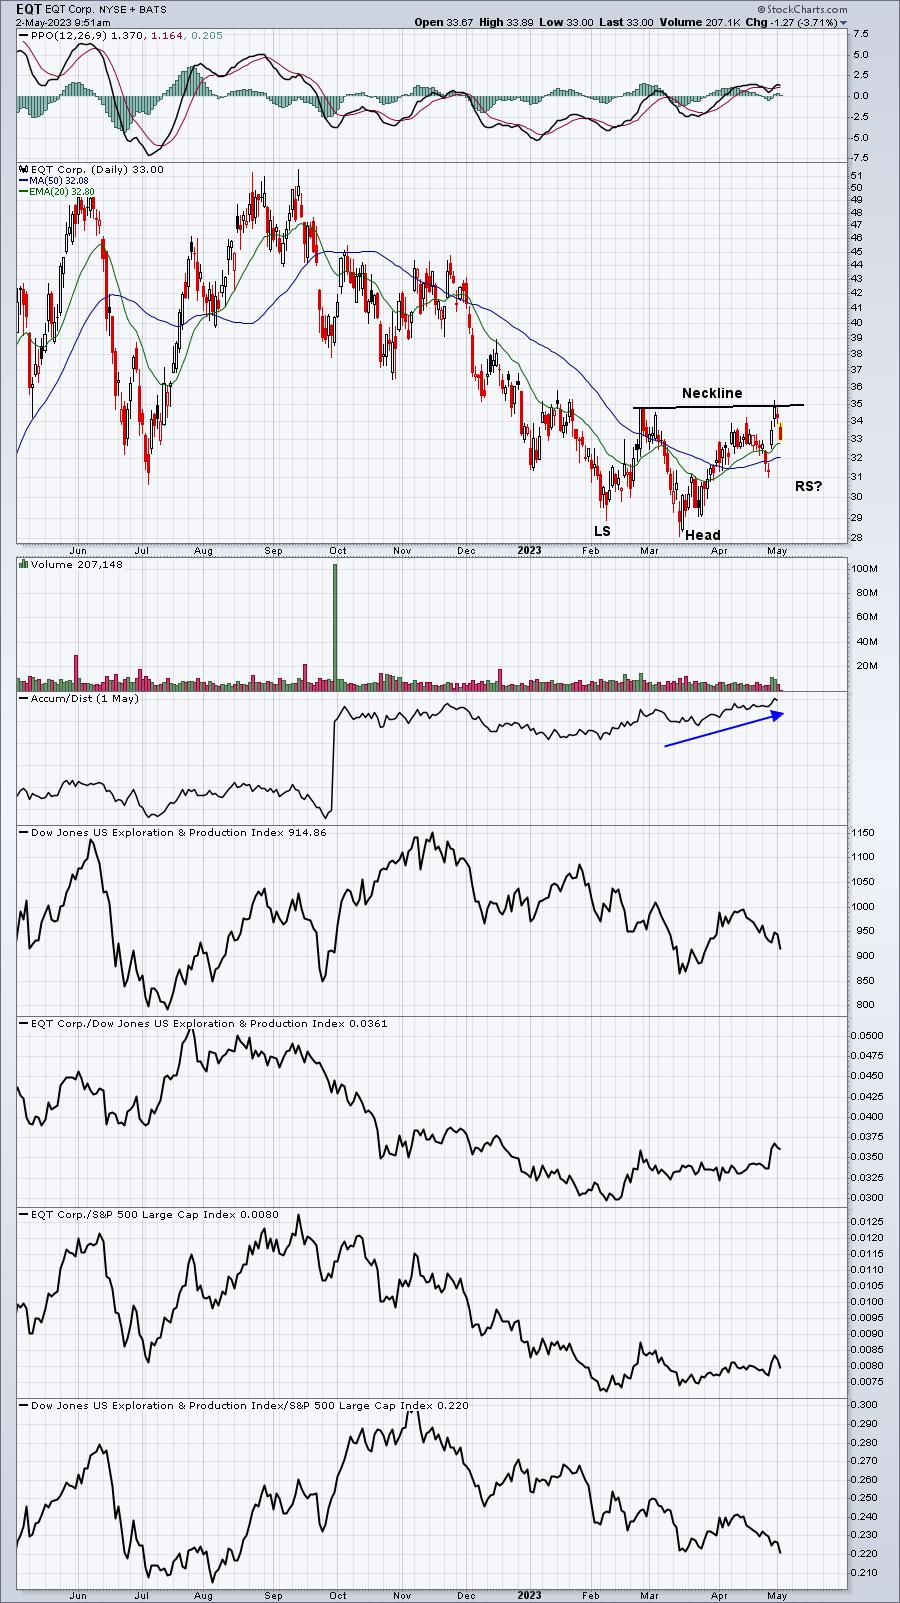
EQT could require some patience as a potential bottoming reverse head & shoulders pattern could be printing. If so, look for a bit more weakness to form a reverse right shoulder. I would expect that to take place somewhere between 29-31.
S&P 500 May Performance
Go away in May? Check this out and you be the judge.
Here's a breakdown of the annualized performance of the S&P 500 (since 1950) during the month of May:
- May 1-5: +32.26%
- May 6-11: -20.11%
- May 12-16: +2.95%
- May 17-25: -15.77%
- May 26-31: +37.01%
May is a mildly bullish month for the S&P 500, but its strength has clearly been in the first and last weeks of the month. May has gained ground 44 of 73 years since 1950. May's annualized return since 1950 is +2.75% and ranks 8th among all calendar months in terms of annualized return.
Growth tends to perform much better than value during May. One way to visualize this is to simply look at the NASDAQ's performance throughout May:
- May 1-5: +42.97%
- May 6-11: -22.74%
- May 12-16: +17.33%
- May 17-25: -15.95%
- May 26-31: +49.09%
Since 1971, May has produced NASDAQ annualized returns of +10.75%, ranking 5th among all calendar months. Since 1990, May's NASDAQ annualized return has been +13.05%. That's a very solid return over more than three decades.
Sector Performance
Before we look at individual stocks, let's get an overview of how the various sectors and industries have performed during May (and June) over the past decade (during this secular bull market):
Sector Heat Map:
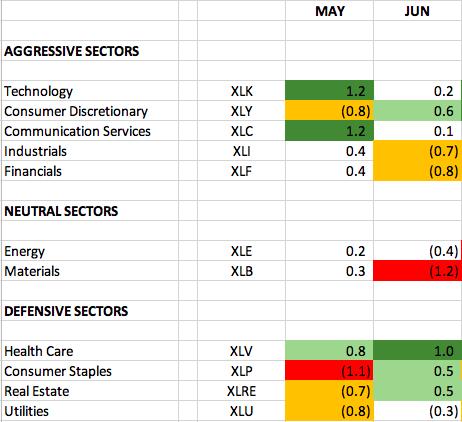
The numbers reflect how much a sector, on average, outperforms or underperforms the S&P 500 over the past 10 years. The dark green-shaded areas show significant outperformance (1.0 or greater). The light green-shaded areas show solid outperformance (from 0.5 to 1.0). The yellow-shaded areas show underperformance (-0.5 to -1.0). The red-shaded areas show significant underperformance (-1.0 or greater). Where there is no shading, there tends to be more neutral performance (-0.4 to 0.4).
Leadership in May has tended to come from technology (XLK). Here's what the XLK looks like as we enter May:
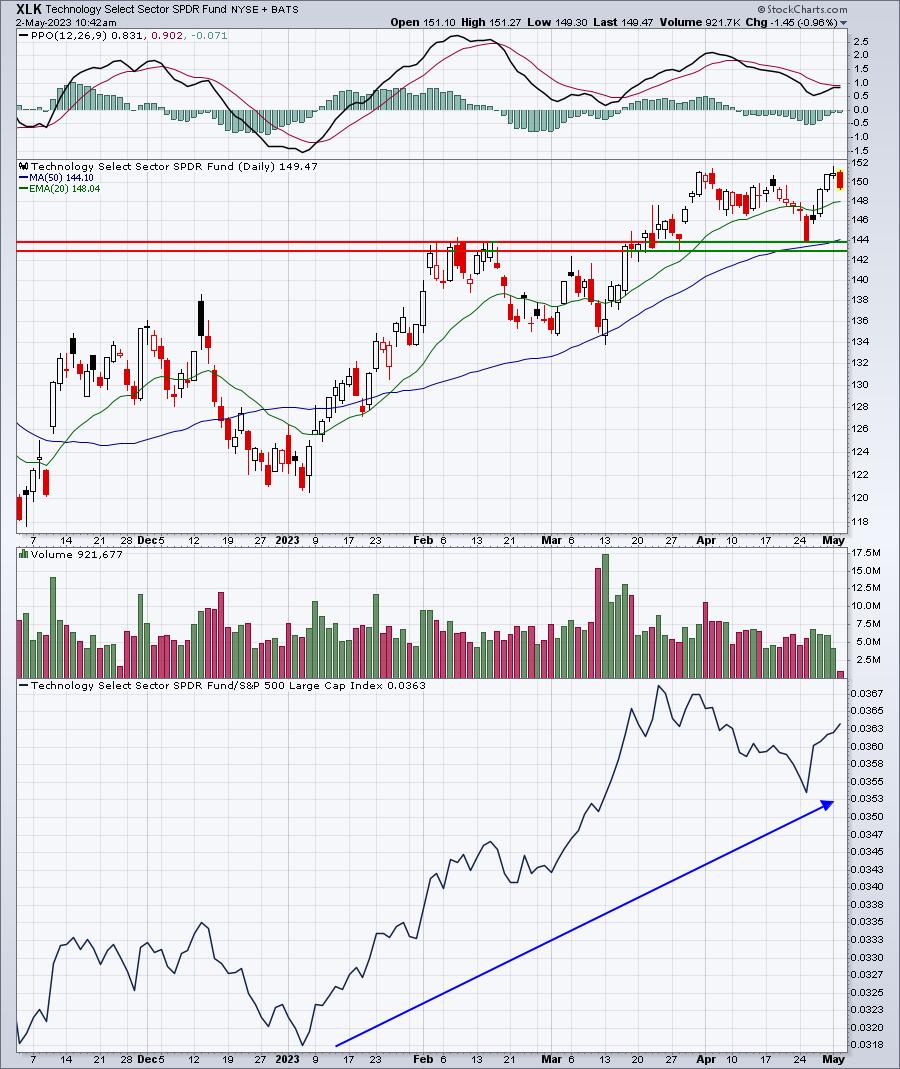
The XLK has trended higher throughout 2023, thus far, and May tends to be a very strong month for semiconductors ($DJUSSC). During the secular bull market, only November has proven to be a better month for semiconductors. It's also worth pointing out that technology CRUSHES the S&P 500 over the next 4 months, May through August. Its total relative outperformance is 4.4 percentage points, which is insanely bullish. Communication services (XLC) began its best 4-consecutive month stretch of relative outperformance in April. We're in a sweet spot for growth.
Industry Performance
Let's take a look at the industry heat map within technology to drill down to the best seasonal strength in May and June over the past decade among the various industry groups (relative to the S&P 500):
Technology (XLK):
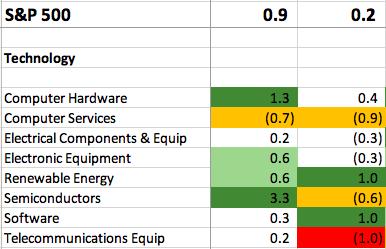
The May historical strength in technology has been led by semiconductors and computer hardware ($DJUSCR, think AAPL). In the communications services sector, internet stocks ($DJUSNS) love the month of May as well.
Here are industry groups (within sectors other than technology) that tend to perform much better than the benchmark S&P 500 during May:
Consumer Discretionary (XLY):
- toys, home construction, specialized consumer services
Communication Services (XLC):
- internet, mobile telecommunications
Industrials (XLI):
- building materials & fixtures, defense, business support services, marine transportation
Financials (XLF):
- full line insurance, mortgage finance, insurance brokers, specialty finance, financial administration, consumer finance, investment services
Health care (XLV):
- health care providers, medical supplies, medical equipment
Consumer staples (XLP):
- tires
Real Estate (XLRE):
- none
Utilities (XLU):
- none
Energy (XLE):
- coal
Materials (XLB):
- none
Stocks for May
We've selected our Top 20 seasonal stocks for May. Several names represent sectors and industry groups that have been discussed above. Others simply stand out in May based on their own historical track record.
The stocks this month are as follows:
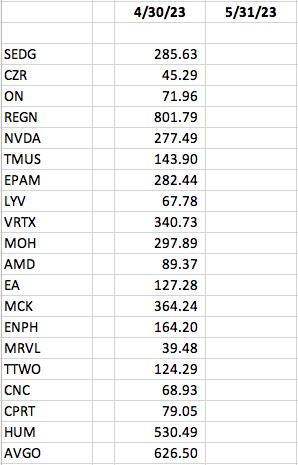
A "Seasonality - May 2023" ChartList (annotated with 1 or 2 support levels to watch) has been created and will be available for viewing/download on our website later today or tomorrow. You must be a StockCharts.com Extra or Pro member to download our ChartLists. Basic members and non-StockCharts.com members can view the charts one at a time.
Happy trading!
Tom