
EB Monthly Seasonality Report - July 2023
A Look Back At June Stocks:
One month ago, we provided a list of the Top 20 stocks that had strong historical track records during the month of June. Here are how they performed in June 2023 (through the June 30th close):
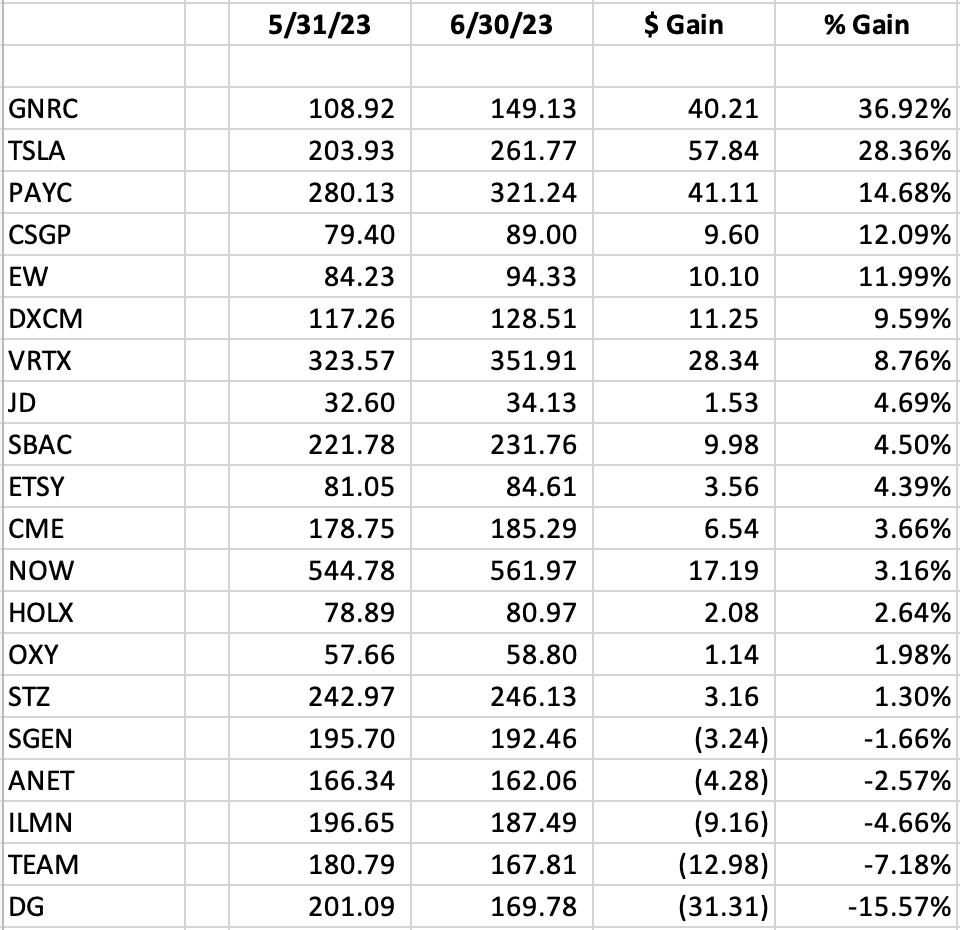
The percentages represent the returns from the May 31st close to the June 30th close. The average performance of +5.85% fell just shy of the S&P 500 performance (+6.48%) and the NASDAQ performance (+6.30%). Our Top 20 Seasonality stocks trailed the benchmark indices mostly because June tends to be a month that favors value over growth. That was not totally the case in June 2023 as consumer discretionary (XLY, +11.22%) was the top-performing sector. Also, a few of the really big market-cap weighted names like Apple (AAPL, +9.43%), NVIDIA (NVDA, +11.82%), Meta Platforms (META, +8.41%), Amazon.com (AMZN, +8.11%), and Visa (V, +7.44%) posted great returns in June, which is unusual from an historical perspective.
While Tesla (TSLA, +28.36%) was a standout June performer from out Top 20 list, Generac (GNRC, +36.92%) broke out of its doldrums with a bang:
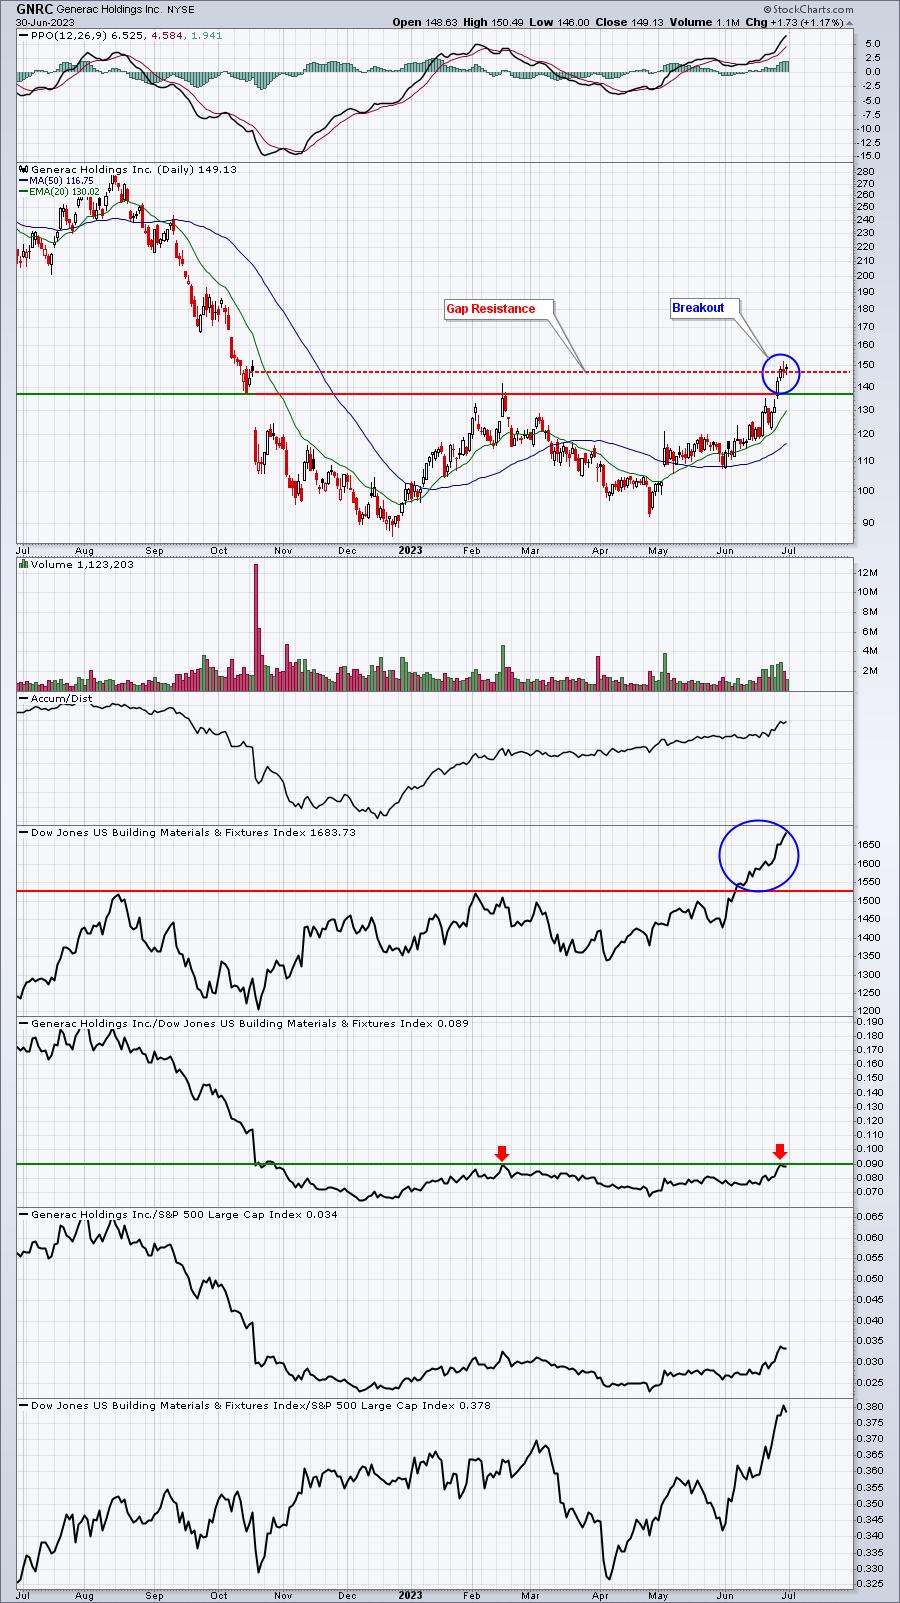
Despite the fact that GNRC just soared 36% in one month, I'm still not completely sold on the idea that GNRC is heading higher. The reason? Well, first check out the strength of its peer group, building materials & fixtures ($DJUSBD). The entire group EXPLODED higher and it's now one of the best industry groups in the stock market. So did GNRC go up because of its own merits? Or did the red-hot industry group simply carry it on its shoulders. Notice on the chart that GNRC has not yet broken out relative to its peers, meaning that we'd likely find better stocks in the group than GNRC. Also, recent volume has picked up noticeably, but it's much lighter than what we saw on the gap down and subsequent selling in October 2022. Lastly, that gap down was from the upper-140s, which is exactly where GNRC is now. It's got a bit more work to do before I'd be interested in owning it. Let's see a pullback to test its 20-day EMA, then another absolute price breakout with a simultaneous RELATIVE breakout vs. its peers. Then I might get more excited.
S&P 500 July Performance
How's that "Go Away in May" theory panning out? Not very well I'd say. And you know what? In April of 2024, we'll hear it all over again. Unfortunately for the bulls, we are getting closer and closer to the truly difficult period of the year historically.
Here's a breakdown of the annualized performance of the S&P 500 (since 1950) during the month of July:
- July 1-17: +25.91%
- July 18-24: -13.85%
- July 25-31: +21.07%%
July is typically a solid month for the S&P 500, but it has exceptional strength during the first 2-3 weeks of the month - likely due to upcoming earnings. It's routine pre-earnings behavior that we see in the first month of each calendar quarter (January, April, July, October). July has gained ground 43 of 73 years since 1950, which is average. July's annualized return since 1950 is +15.11% and ranks 4th among all calendar months in terms of annualized return, trailing only November (+19.91%), December (+18.62%), and April (+18.08%).
It's worth pointing out that the NASDAQ 100 (QQQ) usually sees outperformance vs. the S&P 500 (SPY). Check out this RELATIVE seasonality chart since this secular bull market began in 2013:
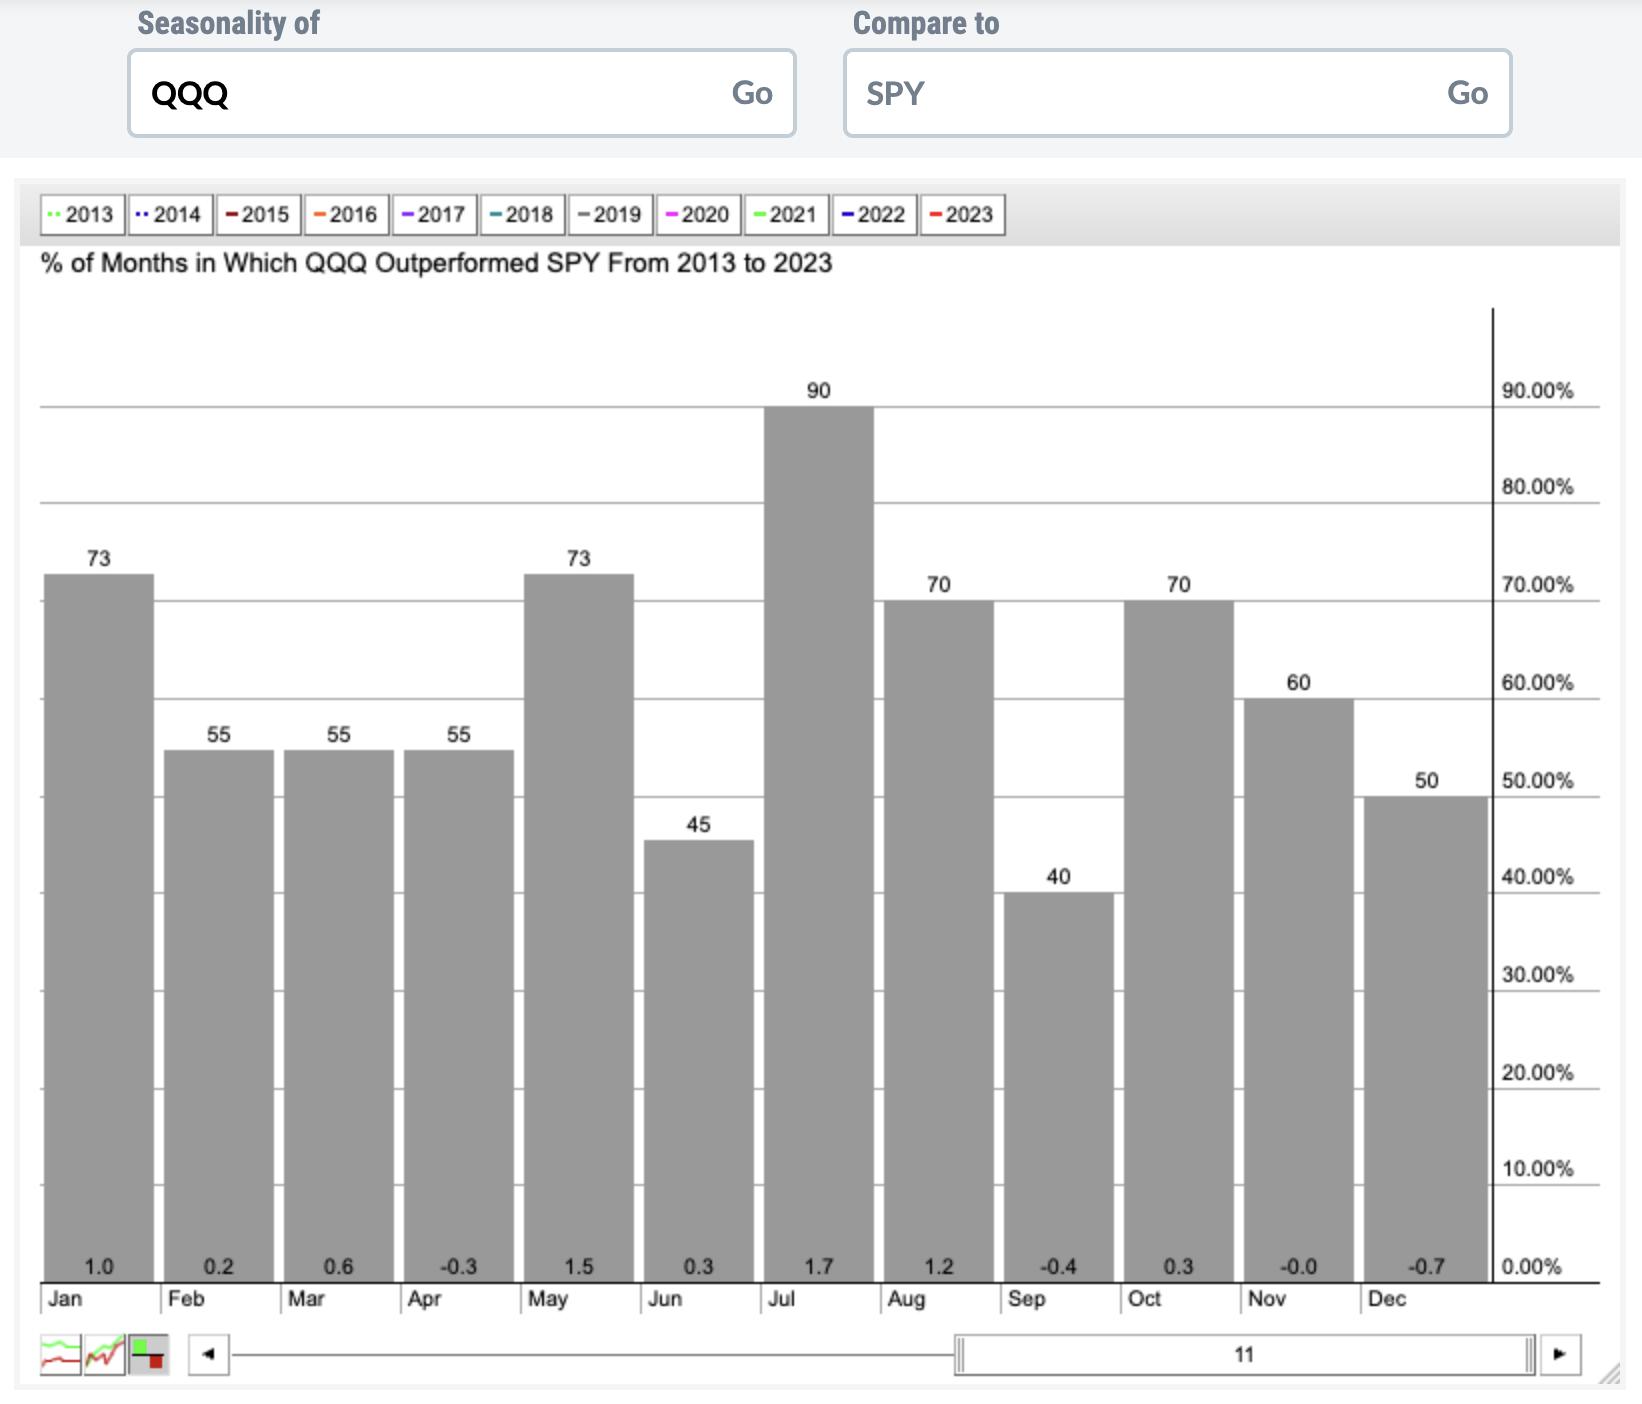
The QQQ has outperformed the SPY during 9 of the last 10 Julys by an average of 1.7 percentage points, which is also the highest level of outperformance of any month. If I go back the last two decades, the QQQ has outperformed the SPY 79% of Julys and by 1.1 percentage points, tied with May for the highest average monthly level of relative outperformance. That's significant and should be remembered as we head into July. I know stocks like AAPL, MSFT, TSLA, NVDA, AMZN, etc. have had big runs, but history tells us it could continue for the next month or two.
Sector Performance
Before we look at individual stocks, let's get an overview of how the various sectors and industries have performed during July (and August) over the past decade (during this secular bull market):
Sector Heat Map:
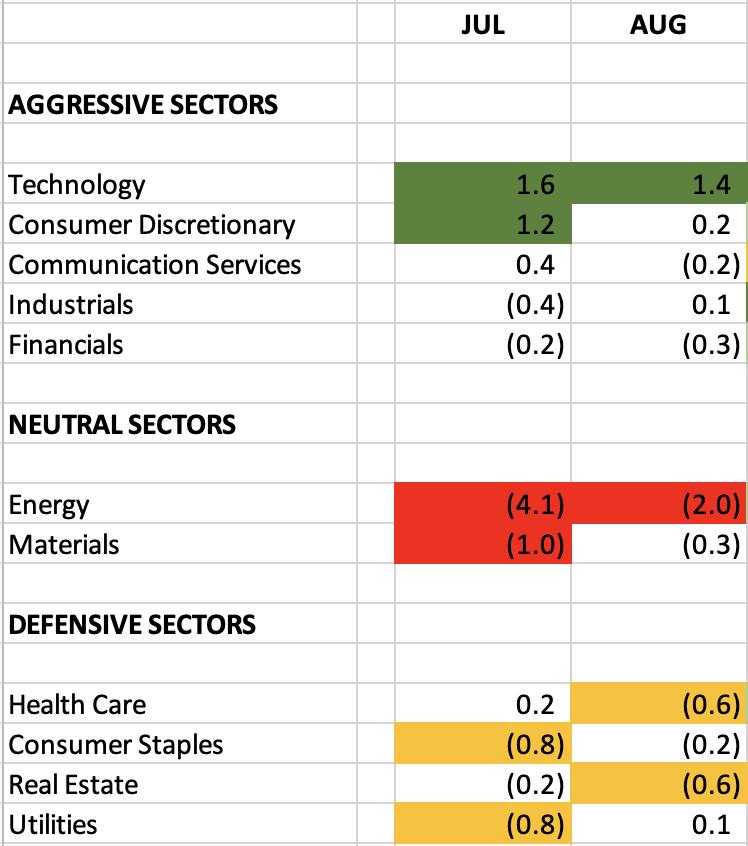
The numbers reflect how much a sector, on average, outperforms or underperforms the S&P 500 over the past 10 years. The dark green-shaded areas show significant outperformance (1.0 or greater). The light green-shaded areas show solid outperformance (from 0.5 to 1.0). The yellow-shaded areas show underperformance (-0.5 to -1.0). The red-shaded areas show significant underperformance (-1.0 or greater). Where there is no shading, there tends to be more neutral performance (-0.4 to 0.4).
Leadership in July (and August) has tended to come technology (XLK) - especially when we consider what follows in August. Here's what the XLK looks like as we enter July:
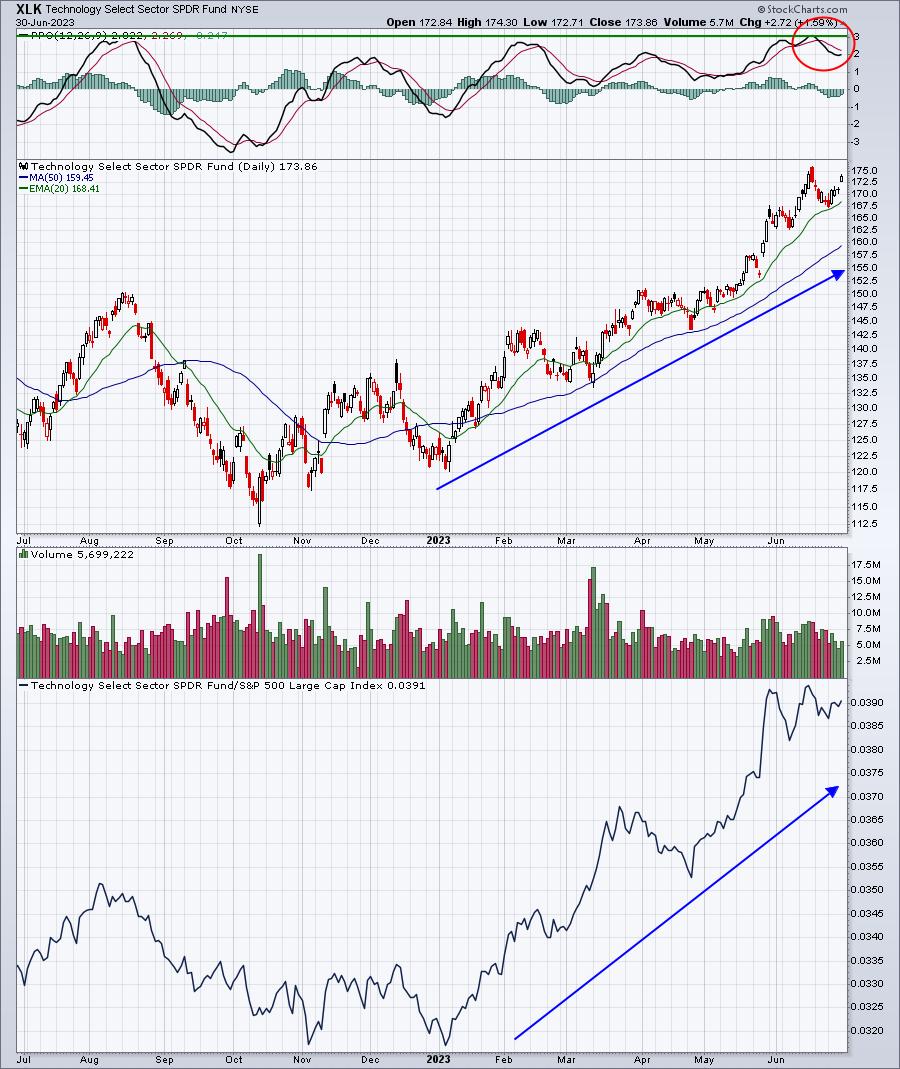
The XLK has been trending higher throughout 2023. My biggest concern on the XLK is that it's run so far and its daily PPO has reached the 3 level, which has been a problem in the recent past. When I pulled up a 10-year daily chart, the XLK has seen a PPO above 3 only one time - during the rapid push higher after the 2023 pandemic took prices lower in March of that year. So I suspect we could see some additional short-term strength, but that's very likely to be followed by either selling during the very bearish week from July 18 to July 24 or perhaps a period of sideways consolidation.
Industry Performance
Let's take a look at the industry heat map within consumer discretionary to drill down to the best seasonal strength in July and August over the past decade among the various industry groups (relative to the S&P 500). Let's zero in first on technology since that sector is usually red-hot during the summer months:
Technology (XLK):
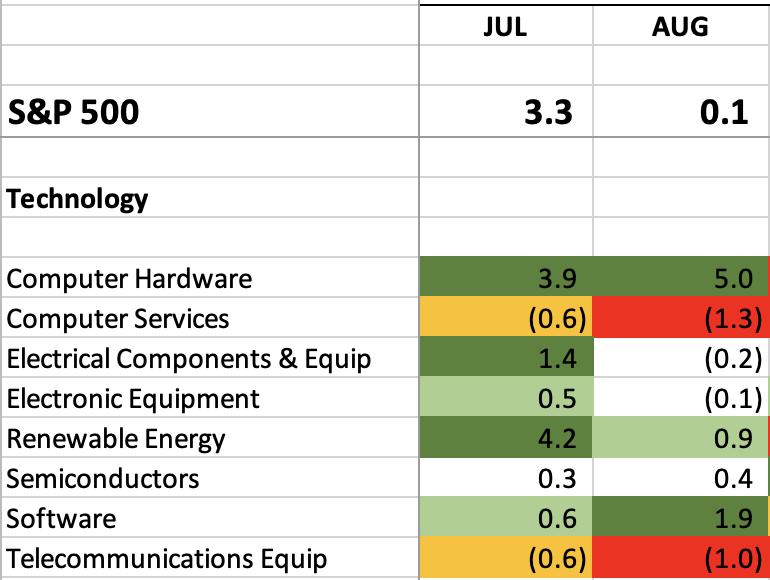
The July/August historical strength in technology has been led by a few industries, but most notably renewable energy ($DWCREE) and computer hardware ($DJUSCR). The DWCREE hasn't really participated in the rally of late, so I could definitely see a strong month or two ahead for this group:
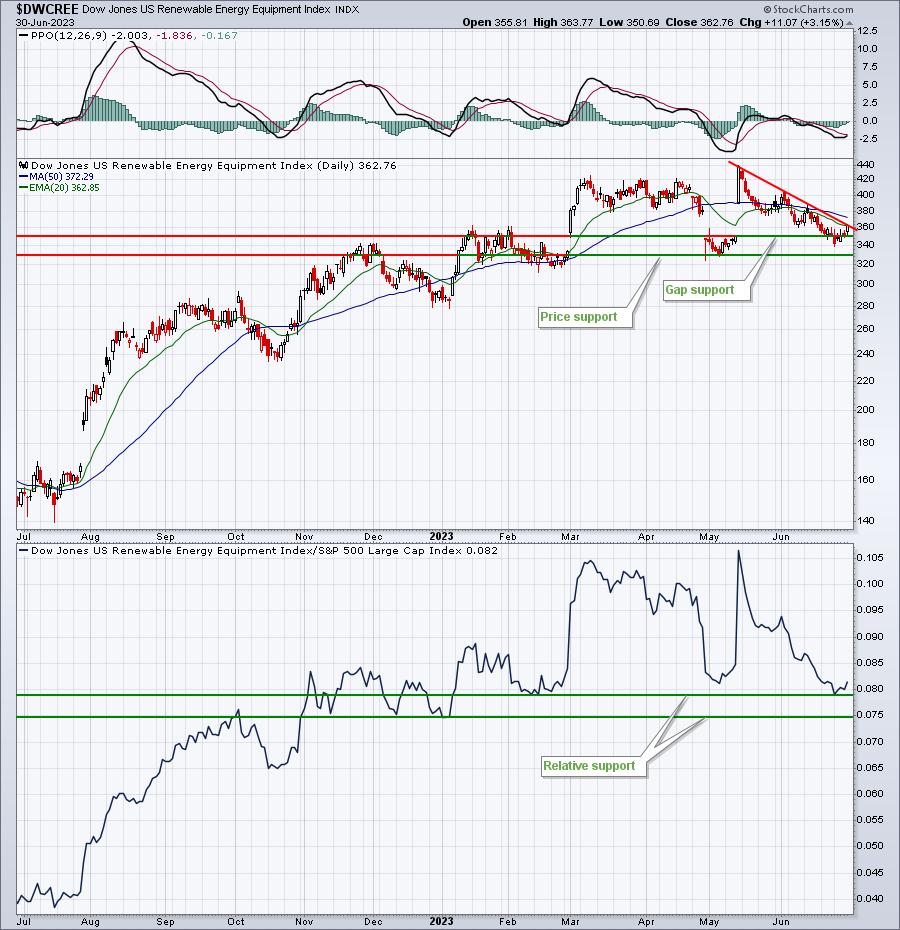
Watch key relative price support in the bottom panel and for a trendline break to the upside in the price chart. We ended June sitting squarely on this resistance line and just a few pennies beneath the 20-day EMA. If July gets off to a good start, the DWCREE could really take off.
Here are industry groups (within sectors other than technology) that tend to perform much better than the benchmark S&P 500 during July:
Consumer Discretionary (XLY):
- broadline retail, automobiles, specialized consumer services, recreational products, business training & employment agencies
Communication Services (XLC):
- internet
Industrials (XLI):
- trucking, delivery services
Financials (XLF):
- specialty finance, financial administration, mortgage finance
Health care (XLV):
- medical equipment, biotechnology
Consumer staples (XLP):
- none
Real Estate (XLRE):
- real estate services
Utilities (XLU):
- none
Energy (XLE):
- coal
Materials (XLB):
- steel, aluminum
Stocks for July
We've selected our Top 20 seasonal stocks for July. Several names represent sectors and industry groups that have been discussed above. Others simply stand out in July based on their own historical track record.
The stocks this month are as follows:
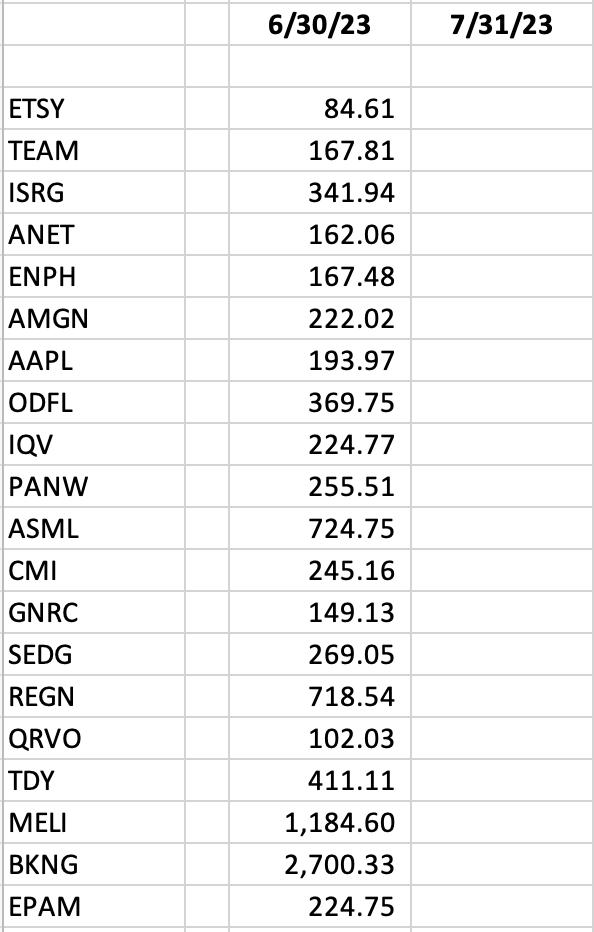
A "Seasonality - July 2023" ChartList (annotated with 1 or 2 support levels to watch) has been created and will be available for viewing/download on our website by Monday. You must be a StockCharts.com Extra or Pro member to download our ChartLists. Basic members and non-StockCharts.com members can view the charts one at a time.
Happy trading!
Tom