
EB Monthly Seasonality Report - November 2023
Notes
First, I apologize for the delay in getting this November Seasonality Report out to our members. I'm still catching up from my trip to meet with StockCharts in Redmond, WA. I have been discussing the current seasonal bullish period recently - in both DMRs and our EB Digest, so hopefully that's helped somewhat as the market has bounced.
In this Seasonality Report, you'll see that I'm providing more text and less pictures. The pictures (images) do help provide visual context, but it also creates scrolling issues in most emails. We'll continue to work on a better display, but hopefully this change will at least help us with regard to scrolling issues for now.
A Look Back At October Stocks:
One month ago, we provided a list of the Top 20 stocks that had strong historical track records during the month of October. Here are how they performed in October 2023, in order of best to worst performance:
- NFLX: +9.03%
- CBOE: +4.92%
- NDAQ: +2.08%
- MPC: -0.06%
- AAPL: -0.26%
- ICE: -2.35%
- AKAM: -3.01%
- TYL: -3.43%
- PSX: -5.06%
- GOOGL: -5.18%
- NUE: -5.47%
- FFIV: -5.93%
- LRCX: -6.15%
- KEYS: -7.75%
- FSLR: -11.84%
- GM: -14.47%
- ALK: -14.70%
- DAL: -15.54%
- UAL: -17.23%
- GNRC: -22.84%
The percentages represent the returns from the September 30th close to the October 31st close. The average performance of all 20 stocks (-6.26%) trailed both the S&P 500 performance (-2.17%) and the NASDAQ 100 performance (-2.07%). Our weakness stemmed almost exclusively from the transportation group, which was pummeled during October. 4 transports on our October Seasonality list (UAL, DAL, ALK, GM) lost from 14.5% to 17.23%. Our top 15 performers actually performed on a par with the S&P 500 and the NASDAQ 100. Unfortunately, transports put way too much pressure on the October Seasonality list. The poor performance of our September and October Seasonality lists underscores why I personally use seasonality as a secondary indicator. I typically follow it only if it further supports bullish technical price and volume action on the charts.
S&P 500 November Performance
Here's a breakdown of the annualized performance of the S&P 500 (since 1950) during the month of August:
- November 1-5: +66.76%
- November 6-9: -6.45%
- November 10-13: +21.90%
- November 14-20: -15.09%
- November 21-30: +42.10%
November has a very bullish reputation and for good reason. November, in the aggregate, has gained ground 50 of its last 73 Novembers - since 1950, which ranks 3rd among all calendar months, trailing only December and April for frequency of monthly gains. November's annualized return since 1950 is +20.52% and that ranks #1 among all calendar months.
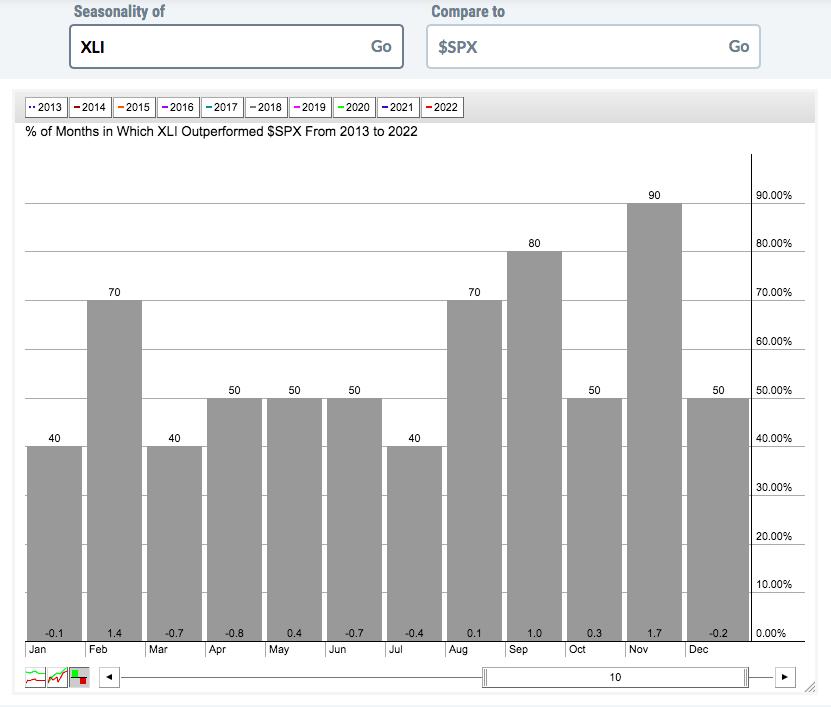
During the secular bull market, which began back in 2013, industrials (XLI) and financials (XLF) have been extraordinarily bullish on a relative basis in November. Let's check out these two seasonality charts, which we also featured in our October Seasonality Report. This time, however, I'll show them relative to the S&P 500:
XLI:
XLF:
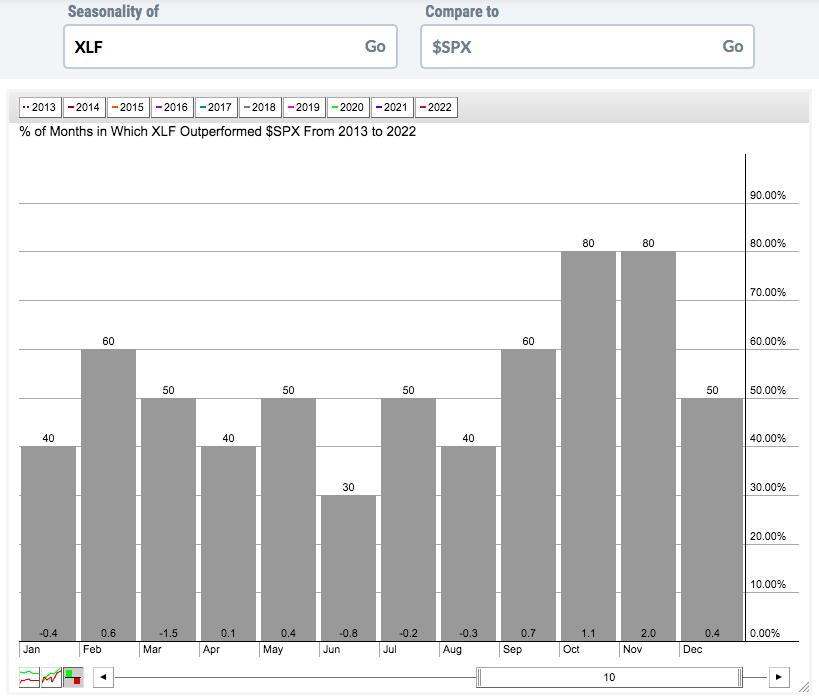
Both of these sectors typically perform very well in November, especially on a relative basis.
Sector Performance
Before we look at individual stocks, let's get an overview of how the various sectors and industries have performed during November over the past decade (during this secular bull market):
Sector Heat Map (no picture as images are causing our scrolling issue):
Financials (XLF) have been big winners during the month of November, averaging outperforming the S&P 500 by 2 full percentage points throughout this secular bull market. Industrials (XLI) are next in terms of November outperformance at 1.7%. Materials (XLB) round out the top 3, outperforming the benchmark by 1.0%.
We typically see November relative weakness in utilities (XLU), real estate (XLRE), and communication services (XLC), which have underperformed the S&P 500 in November by 3.0%, 1.7%, and .
Leadership in October has typically come from financials (XLF). Here's what the XLF chart looks like as we enter October this year:
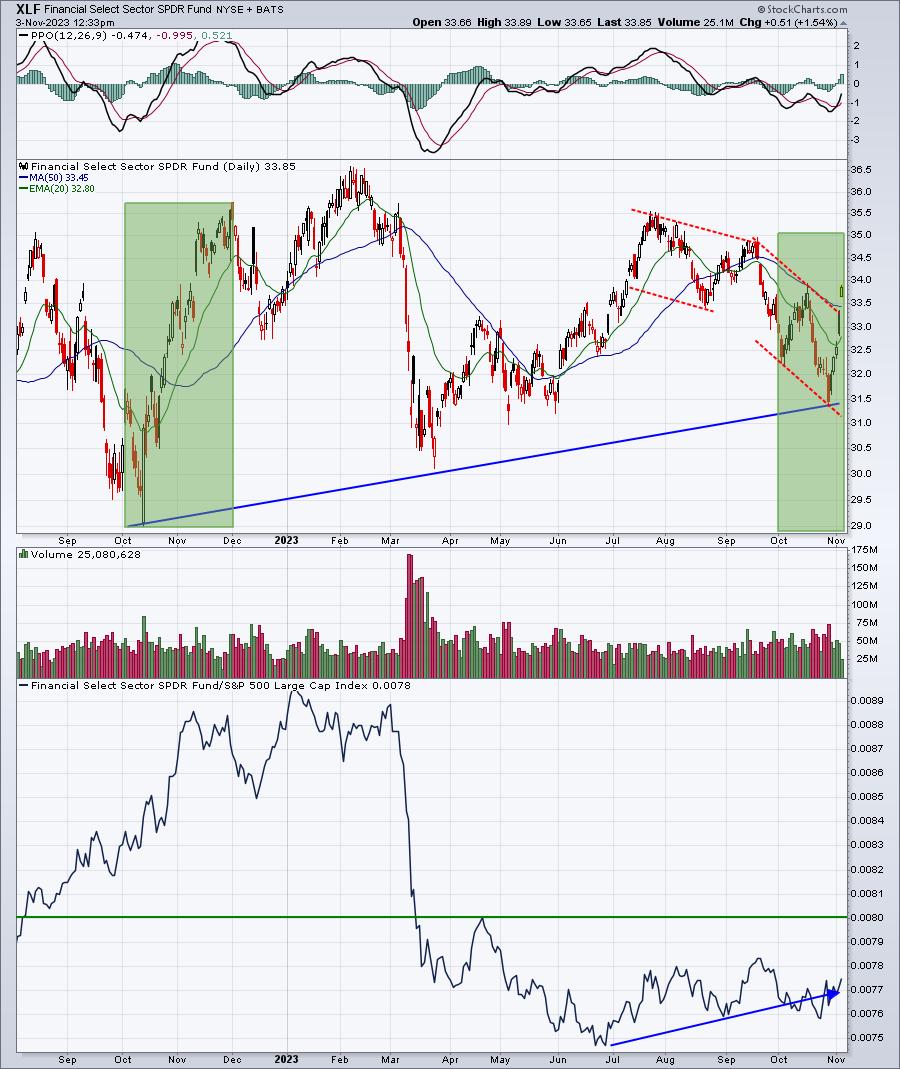
Last year, you can see in the green-shaded area how the XLF performed in October and November. This period in 2023 has not been nearly as bullish as we just set a new low in October. However, things have picked up in the first week of November. Also notice that the XLF has been trending higher on a RELATIVE basis, rising since the June low.
Industry Performance
Let's take a look at the industry heat map within industrials to drill down to the best seasonal strength in November over the past decade among the various industry groups (relative to the S&P 500):
Industrials (XLI):
- Airlines: +5.4%
- Transportation services: +4.0%
- Aerospace: +2.9%
- Railroads: +2.8%
- Industrial suppliers: +2.3%
- Commercial vehicles & trucks: +2.2%
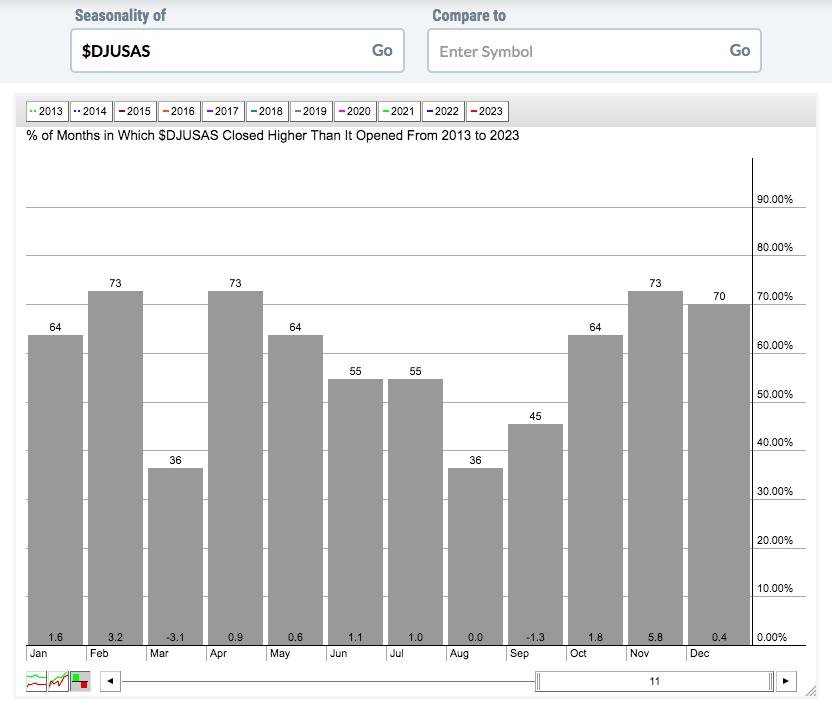
The November historical strength in industrials has been led by several industry groups, as you can see. One group that looks very interesting is aerospace ($DJUSAS). The short-term has turned quite bullish, but it's now reached a very key overhead price resistance zone:
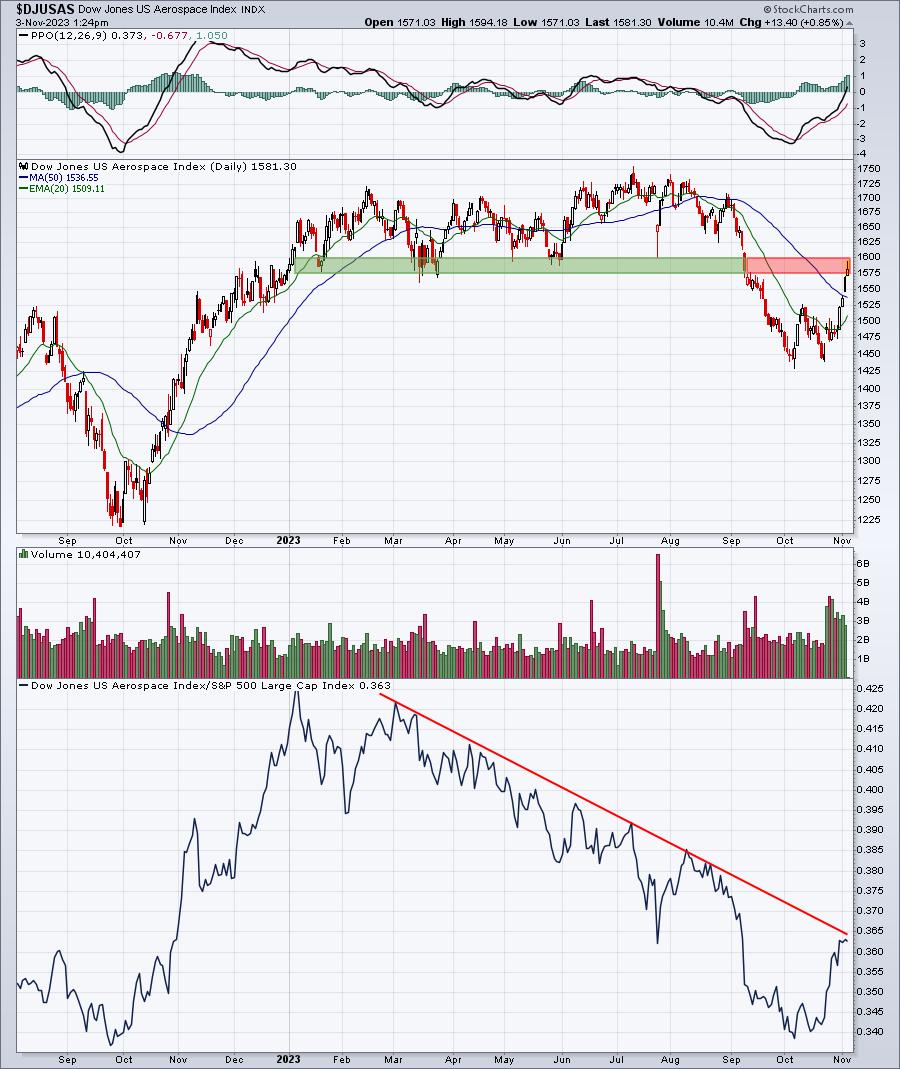
Not only have we seen the DJUSAS move up to test overhead price resistance, but it's also moving up on a relative basis to test its relative downtrend vs. the S&P 500. Watch these two absolute and relative resistance levels. A breakout above both could lead to much further strength in the group.
I mention this, because the DJUSAS loves November. You can see below that its average monthly return in November is EASILY its best of the year throughout this entire secular bull market (since 2013).
Here are industry groups (within sectors other than industrials) that tend to perform much better than the benchmark S&P 500 during November:
Technology (XLK):
- semiconductors, electrical components & equipment, electronic equipment
Consumer Discretionary (XLY):
- apparel retailers, home construction, footwear, tires, clothing & accessories, hotels, recreational products, automobiles, furnishings
Communication Services (XLC):
- publishing
Financials (XLF):
- asset managers, investment services, banks, life insurance
Health care (XLV):
- health care providers, biotechnology
Consumer staples (XLP):
- food retailers & wholesalers, drug retailers
Real Estate (XLRE):
- real estate services
Utilities (XLU):
- none
Energy (XLE):
- none
Materials (XLB):
- aluminum, nonferrous metals
Stocks for November
We've selected our Top 20 seasonal stocks for November. Several names represent sectors and industry groups that have been discussed above. Others simply stand out in November based on their own historical track record.
The stocks this month are as follows:
- AMD
- TSLA
- MNST
- NVDA
- ALK
- MTD
- ON
- MKTX
- HOLX
- DE
- ROK
- BBWI
- MSCI
- MRVL
- DXC
- ENPH
- ABBV
- NXPI
- CNC
- PH
A "Seasonality - November 2023" ChartList (annotated with 1 or 2 support levels to watch) will be created and will be available for viewing/download on our website over the weekend. You must be a StockCharts.com Extra or Pro member to download our ChartLists. Basic members and non-StockCharts.com members can view the charts one at a time.
Happy trading!
Tom