
EB Monthly Seasonality Report - December 2023
Notes
In this Seasonality Report, you'll see that I'm once again providing more text and less pictures. The pictures (images) do help provide visual context, but it also creates scrolling issues in most emails. We'll continue to work on a better display, but hopefully this change will at least help us with regard to scrolling issues for now.
A Look Back At November Stocks:
One month ago, we provided a list of the Top 20 stocks that had strong historical track records during the month of November. Here are how they performed in November 2023, in order of best to worst performance:
- ENPH: +26.94%
- AMD: +23.01%
- ALK: +19.54%
- TSLA: +19.54%
- NXPI: +18.36%
- MRVL: +18.02%
- PH: +17.84%
- NVDA: +14.69%
- DXC: +14.68%
- ON: +13.87%
- MKTX: +12.71%
- MTD: +10.83%
- MSCI: +10.76%
- BBWI: +10.69%
- MNST: +7.93%
- HOLX: +7.75%
- CNC: +6.81%
- ROK: +5.32%
- ABBV: +0.86%
- DE: -0.26%
The percentages represent the returns from the October 31st close to the November 30th close. The average performance of all 20 stocks (+12.99%) easily outperformed both the S&P 500 performance (+9.13%) and the NASDAQ 100 performance (+10.82%). Our biggest November winner, Enphase Energy (ENPH), looked awful on its price chart at the beginning of November. Quite honestly, I never would have bought it, because of its weak technical outlook. Always remember that these Top 20 stocks are provided every month based SOLELY upon historical tendencies. It's up to everyone to decide if strong seasonality warrants a trade, especially if technical conditions are suspect.
S&P 500 December Performance
Here's a breakdown of the annualized performance of the S&P 500 (since 1950) during the month of December:
- December 1-8: +19.07%
- December 6-15: -18.88%
- December 16-18: +53.15%
- December 19-20: -18.96%
- December 21-31: +40.21%
Here's another very interesting comparison for December performance on the S&P 500:
- December 1-15: +1.29%
- December 16-31: +34.73%
December has a very bullish reputation and for good reason. As you can see from the above, the second half of December is, by far, the best part of the month. Perhaps we get another week out of the current advance, but history tells us to expect a brief period of consolidation or selling sometime over the next couple weeks. December, in the aggregate, has gained ground 54 of its last 73 Decembers - since 1950, which ranks 1st among all calendar months. No other month, historically, finishes higher more often than December. December's annualized return since 1950 is +17.39% and that ranks #3 among all calendar months, trailing only November (1st) and April (2nd). If we look back only the past 52 years (when the NASDAQ was established in 1971), December's annualized return on the S&P 500 is 19.48%, which has been the BEST calendar month of the year. December ranks as the NASDAQ's 2nd best calendar month over that period, trailing only January, which has historically been a STELLAR month for NASDAQ stocks. If you recall, in January 2023, the NASDAQ exploded higher.
Since the financial crisis low in 2009, financials (XLF) have traded on a relative basis quite bullishly from September through February, rising on a relative basis in every single month since 2009. What's really interesting is that the XLF has UNDERperformed the S&P 500 in every month from March through August. Talk about seasonality! Check this out:
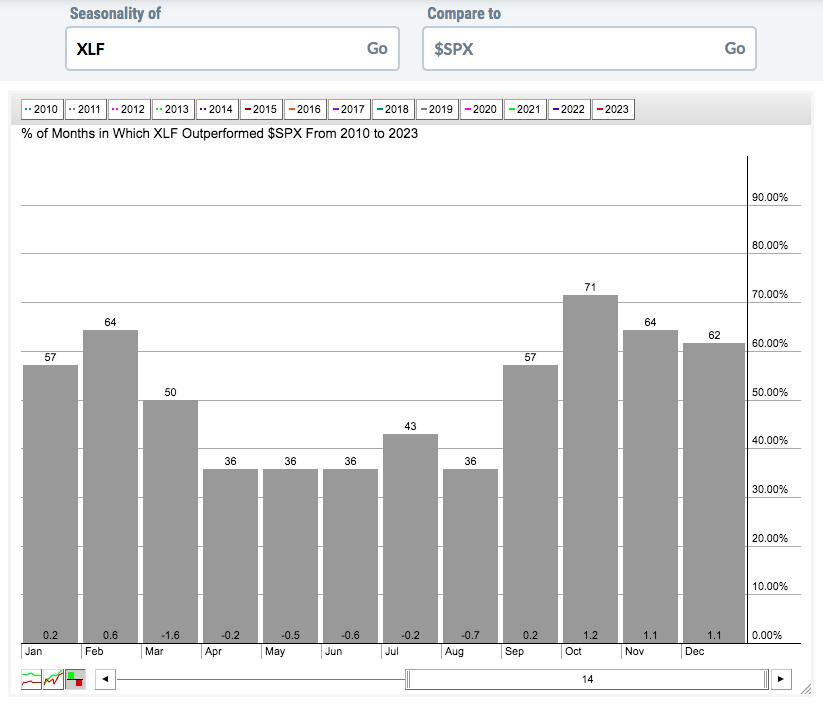
Since that financial crisis low, the XLF has averaged outperforming the S&P 500 by 4.4 percentage points during September through February, but has averaged underperforming the S&P 500 by 3.8 percentage points during March through August. Right now, the XLF is in its sweet spot.
Sector Performance
Before we look at individual stocks, let's get an overview of how the various sectors and industries have performed during December over the past decade (during this secular bull market):
Sector Heat Map (no picture as images are causing our scrolling issue):
While financials (XLF) has shown the most relative strength in December among aggressive sectors, we really should think about December as the month of value stocks, which financials are considered a part of. Historically, money tends to rotate to the dividend payers in December, as aggressive sectors take a breather.
It's quite different than other months, but December's historical strength is typically led by utilities (XLU), consumer staples (XLP), and real estate (XLRE), three defensive sectors that have outperformed the S&P 500 by an average of 1.6%, 1.2%, and 1.1%, respectively, in December.
Of these 3 sectors, the XLRE is receiving the most love:
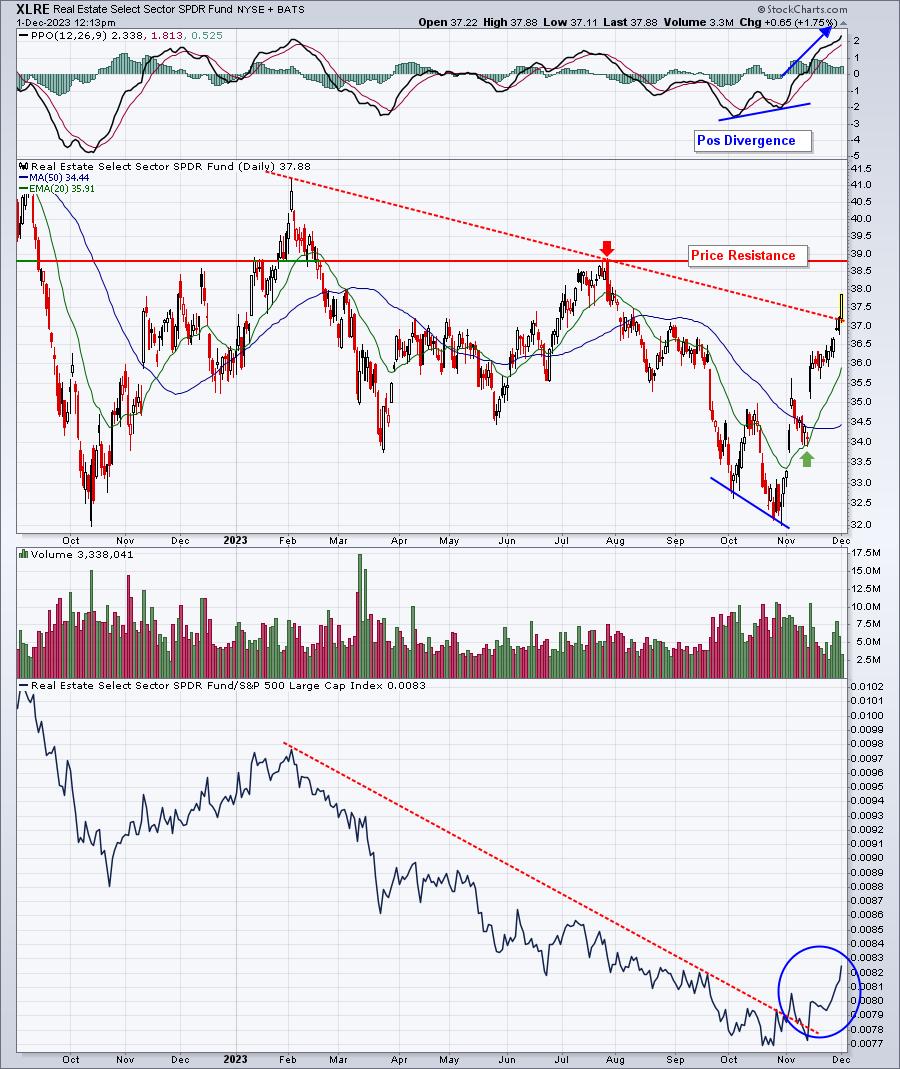
The XLRE isn't just rebounding on an absolute price basis. It's actually been leading the entire November advance. The bottom panel above shows the sudden relative strength in the XLRE. Here's a 1-month sector performance chart to show this strength another way:
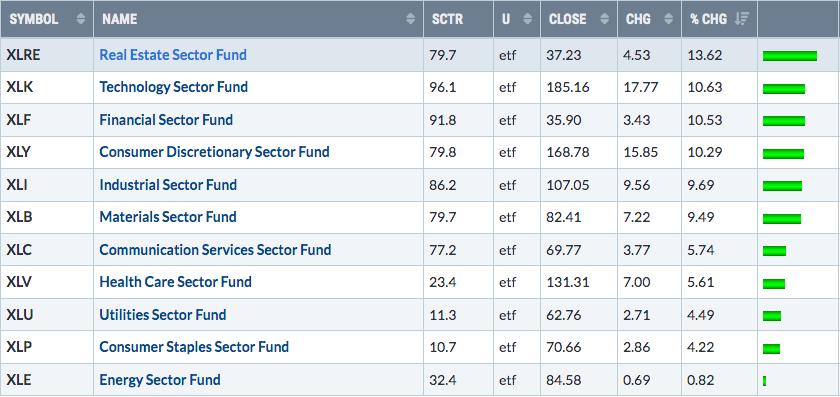
All 11 sectors are higher during this advance, but NO sector is seeing more positive rotation than real estate.
Industry Performance
Let's take a look at the industry heat map within the defensive sectors to drill down to the best seasonal strength in December over the past decade among the various industry groups (relative to the S&P 500):
Utilities (XLU):
- Water: +1.7%
- Conventional electricity: +1.3%
Consumer Staples (XLP):
- Nondurable household products: +2.2%
- Personal products: +1.8%
- Food products: +1.3%
- Tobacco: +1.1%
Real Estate (XLRE):
- Real estate holding & development: +3.8%
An industry that's really been beaten down and could be poised for a significant upside run is personal products ($DJUSCM). Just follow the chart and make sure the rising 20-day EMA holds as support:
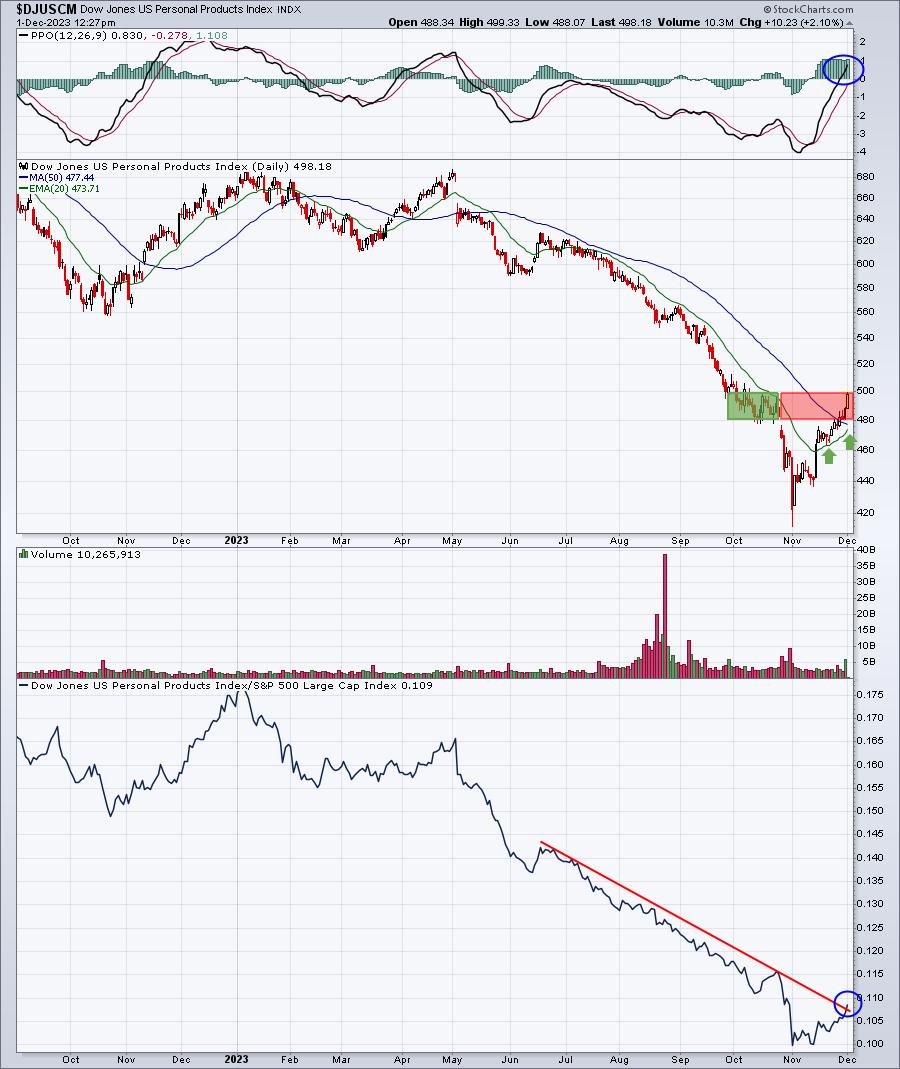
The two blue circles show that bullish price momentum has appeared for the first time since April and that the relative weakness downtrend line may just be breaking. Also, there was a bunch of congestion serving as support from 480-500 on the way down. Now we're trying to negotiate that resistance zone on the way back up. Printing a close above 500 would be another bullish development. On any pullbacks, watch that rising 20-day EMA. We already saw one successful test of it in mid November. We need to see that continue during periods of weakness.
Here are industry groups (within sectors other than utilities, consumer staples, and real estate) that tend to perform much better than the benchmark S&P 500 during December:
Technology (XLK):
- telecommunications equipment
Consumer Discretionary (XLY):
- toys, hotels, recreational services, home improvement retailers, footwear
Communication Services (XLC):
- none
Industrials (XLI):
- none
Financials (XLF):
- consumer finance, property & casualty insurance, reinsurance
Health care (XLV):
- pharmaceuticals
Energy (XLE):
- coal
Materials (XLB):
- aluminum, gold mining, mining, nonferrous metals
Stocks for December
We've selected our Top 20 seasonal stocks for December. Several names represent sectors and industry groups that have been discussed above. Others simply stand out in December based on their own historical track record.
The stocks this month are as follows:
- WDC
- BLDR
- ON
- HIG
- AVGO
- MOS
- STX
- VTR
- BC
- LEN
- LLY
- ARE
- MGM
- TMUS
- LYV
- VLO
- UNH
- CI
- AMG
- CF
A "Seasonality - December 2023" ChartList (annotated with 1 or 2 support levels to watch) will be created and will be available for viewing/download on our website over the weekend. You must be a StockCharts.com Extra or Pro member to download our ChartLists. Basic members and non-StockCharts.com members can view the charts one at a time.
Happy trading!
Tom