
EB Monthly Seasonality Report - January 2024
A Look Back At December Stocks:
One month ago, we provided a list of the Top 20 stocks that had strong historical track records during the month of December. Here are how they performed in December 2023, in order of best to worst performance:
- BLDR: +24.48%
- BC: +22.67%
- AVGO: +20.58%
- ON: +17.10%
- LEN: +16.51%
- ARE: +15.88%
- CI: +13.91%
- MGM: +13.29%
- AMG: +11.71%
- LYV: +11.14%
- VTR: +8.73%
- WDC: +8.40%
- STX: +7.93%
- TMUS: +6.57%
- CF: +5.79%
- VLO: +3.70%
- HIG: +2.84%
- MOS: -0.45%
- LLY: -1.37%
- UNH: -4.47%
The percentages represent the returns from the November 30th close to the December 31st close. The average performance of all 20 stocks (+10.25%) crushed both the S&P 500 performance (+4.14%) and the NASDAQ 100 performance (+5.32%). Our biggest December winner, (BLDR), added significantly to its bullish November reversal. Always remember that these Top 20 stocks are provided every month based SOLELY upon historical tendencies. It's up to everyone to decide if strong seasonality warrants a trade, especially if technical conditions are suspect.
S&P 500 January Performance
Here's a breakdown of the annualized performance of the S&P 500 (since 1950) during the month of January:
- January 1-6: +39.17%
- January 7-13: -12.46%
- January 14-18: +27.79%
- January 19-22: -23.22%
- January 23-31: +25.12%
January has a bullish reputation to kick off a brand new year. As you can see from the above, January tends to follow the normal historical pattern of most months. January, in the aggregate, has gained ground 44 of its last 74 Januarys - since 1950, which ranks tied for 6th among all calendar months (same as both July and October). January's annualized return since 1950 is +12.76% and that ranks #6 among all calendar months. If we look at the NASDAQ, however, January has been its BEST month of the calendar year, producing annualized gains of +31.13% since 1971. November, at +24.90%, is the only other month that's remotely close.
Sector Performance
Before we look at individual stocks, let's get an overview of how the various sectors and industries have performed during January over the past decade (during this secular bull market):
Sector Heat Map (no picture as images are causing our scrolling issue):
Last month, I pointed out that financials (XLF) had the most relative strength historically during the month of December. I also suggested that value tends to lead growth, with areas like consumer staples (XLP), utilities (XLU), and real estate (XLRE) typically showing relative strength as well.
Now December history is in our rear view mirror, so what happened? Well, leadership came in the form of real estate, industrials (XLI), and financials. Here's how they performed over the past month:
- Real estate (XLRE): +9.63%
- Financials (XLF): +8.24%
- Industrials (XLI): +6.44%
So let's move on to January. Where should we look for relative strength and weakness?
During the current secular bull market, there is no doubt where we should look for leadership. It's communication services (XLC) and 2nd place isn't very close - consumer discretionary (XLY). The XLC LOVE January. This sector has gone up EVERY January during this secular bull market (11 years and counting) AND it's outperformed the S&P 500 every January as well. The XLC averages outperforming the S&P 500 by 2.8% in January over the past 11 years. Here's what the XLC looks like technically:
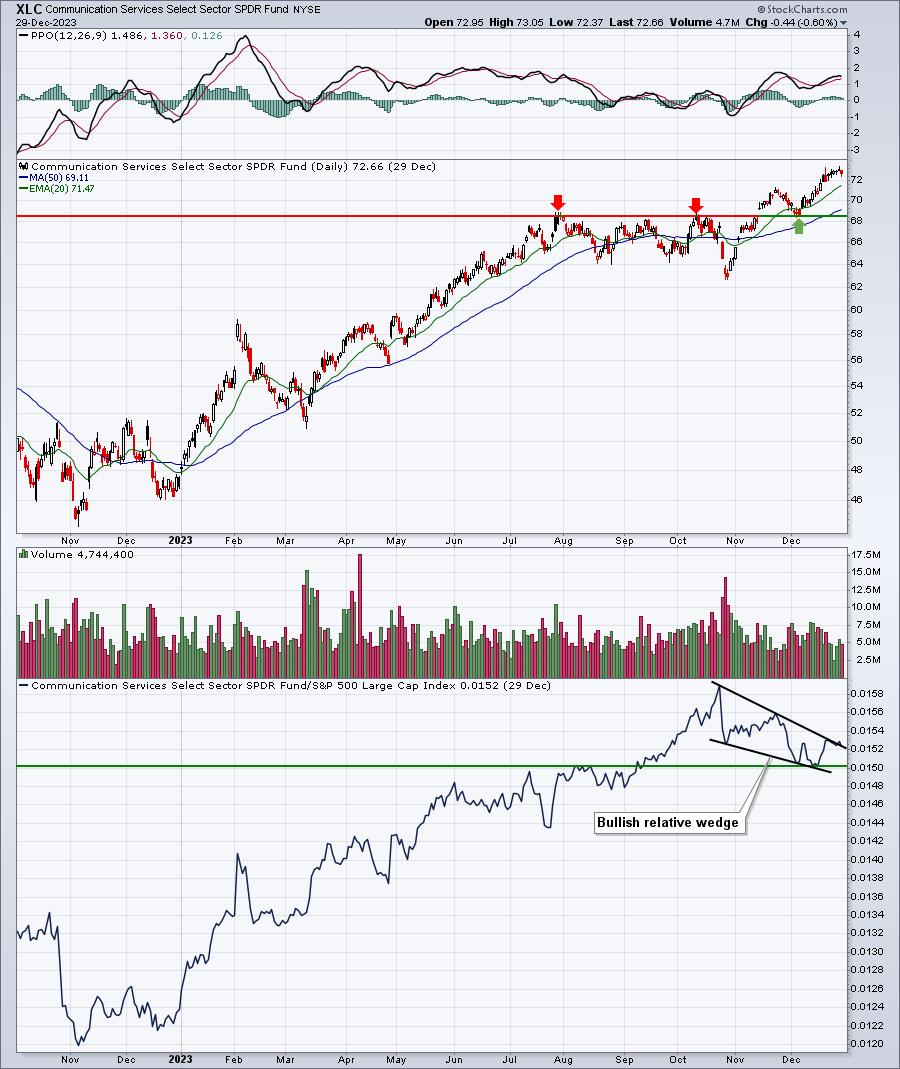
Technically, it looks set up to go higher as well. I love the bullish relative wedge, which is a popular continuation pattern. Anything can happen in the stock market (and usually does), but I'll be surprised if the XLC doesn't outperform the S&P 500 in January 2024.
Industry Performance
Let's start with the strongest industry group within the communication services sector - internet ($DJUSNS). This group has averaged gaining 4.6% during January over the past 11 years and has averaged outperforming the S&P 500 by 3.9% in January. Technically, the DJUSNS appears solid as well:
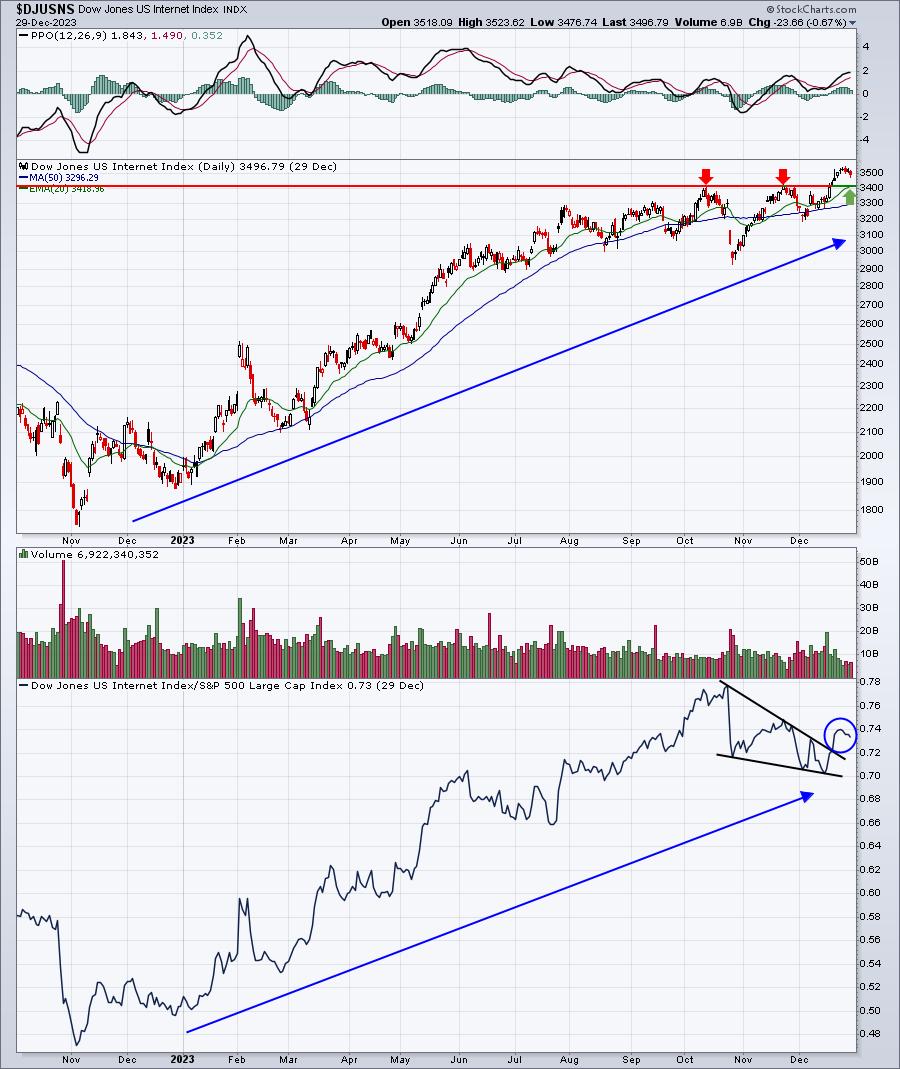
Unlike the XLC, the DJUSNS has already broken out of its bullish relative wedge. I'm expecting another strong January for internet stocks.
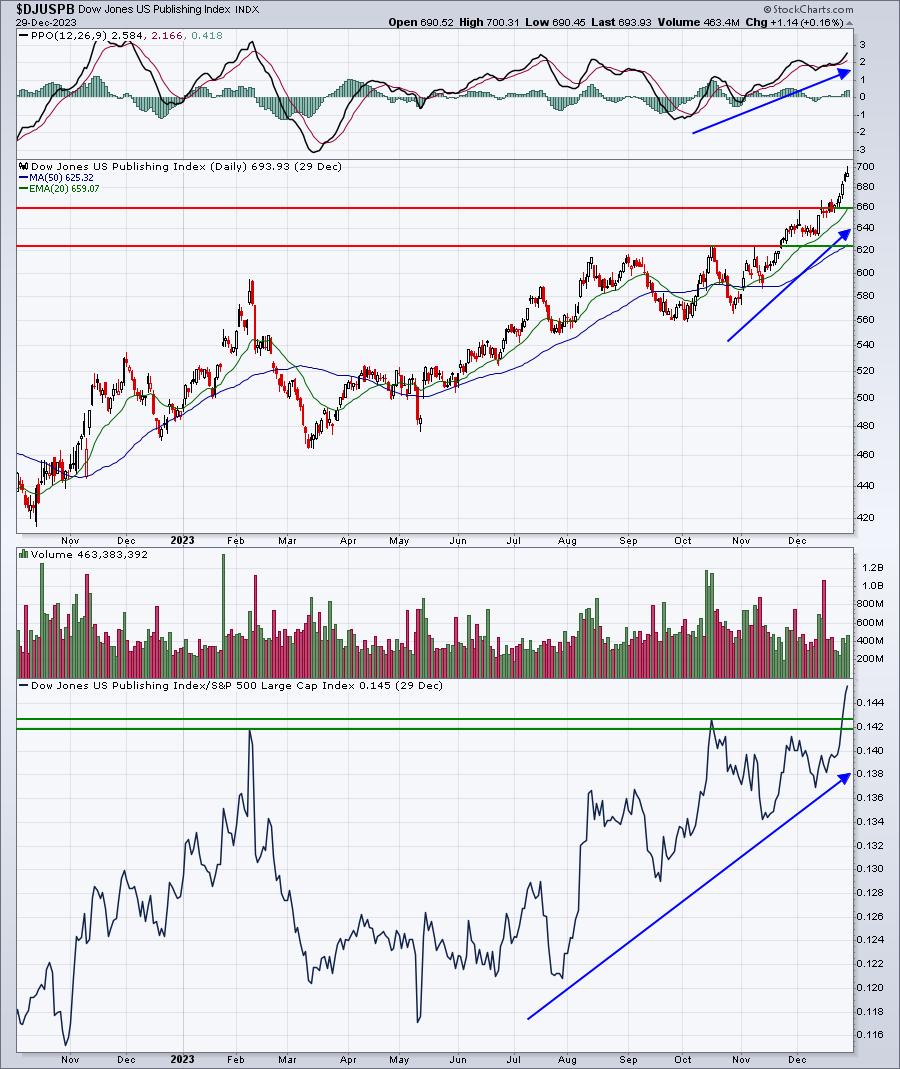
Publishing ($DJUSPB) is another industry group within the XLC that looks solid technically. It's been a very strong run, so a pull back at some point certainly would make some sense. I don't believe this rally has ended, though:
Here are industry groups (within other sectors) that tend to perform much better than the benchmark S&P 500 during January:
Technology (XLK):
- renewable energy, software
Consumer Discretionary (XLY):
- automobiles, broadline retailers, home construction, gambling, toys, business training, recreational services, recreational products, specialty retailers
Industrials (XLI):
- airlines
Financials (XLF):
- specialty finance
Health care (XLV):
- medical equipment
Consumer staples (XLP):
- brewers, tobacco, drug retailers
Real estate (XLRE):
- mortgage REITs, specialty REITs, retail REITs
Utilities (XLU):
- multiutilities, gas distribution
Energy (XLE):
- oil equipment & services, pipelines, exploration & production
Materials (XLB):
- gold mining, mining
Stocks for January
We've selected our Top 20 seasonal stocks for January. Several names represent sectors and industry groups that have been discussed above. Others simply stand out in January based on their own historical track record.
The stocks this month are as follows:
- NFLX
- CIVI
- CELH
- ILMN
- TSLA
- META
- NXPI
- VLO
- FANG
- DXCM
- PHM
- HOLX
- NOW
- JD
- SGEN
- HCA
- INCY
- DPZ
- HAL
- KMI
A "Seasonality - January 2024" ChartList (annotated with 1 or 2 support levels to watch) will be created and will be available for viewing/download later today or early tomorrow morning. You must be a StockCharts.com Extra or Pro member to download our ChartLists. Basic members and non-StockCharts.com members can view the charts one at a time.
Happy trading!
Tom