
EB Monthly Seasonality Report - March 2024
A Look Back At February Stocks:
One month ago, we provided a list of the Top 20 stocks (actually 19 as SPLK was one of our featured 20 that was acquired by CSCO) that had strong historical track records during the month of February. Here are how they performed in February (through Thursday, February 29th), in order of best to worst performance:
- NVDA: +28.58%
- TTD: +24.84%
- AMAT: +22.92%
- ZBRA: +16.67%
- ON: +10.95%
- AVGO: +10.21%
- CF: +7.60%
- FTNT: +7.16%
- HLT: +7.07%
- AON: +5.88%
- CDNS: +5.52%
- MOS: +1.47%
- SWKS: +1.09%
- BKNG: -1.10%
- APTV: -2.26%
- FLT: -3.68%
- FCX: -4.74%
- MELI: -6.81%
- PANW: -8.26%
The percentages represent the returns from the January 31st close to the February 29th (yesterday) close. The average performance of all 20 stocks (+6.48%) beat both the S&P 500 performance (+5.22%) and the NASDAQ 100 performance (+5.28%). Our biggest February winner was NVIDIA Corp (NVDA), but what else is there left to say about this ridiculously strong performer? Keep in mind that these Top 20 stocks are provided every month based SOLELY upon historical tendencies. It's up to everyone to decide if strong seasonal stocks warrant a trade, especially if technical conditions are suspect.
S&P 500 March Performance
Here's a breakdown of the annualized performance of the S&P 500 (since 1950) during the month of March:
- March 1-5: +40.79%
- March 6-9: -24.59%
- March 10-18: +32.83%
- March 19-22: -21.84%
- March 23-31: +12.20%
March performs similar to most calendar months. We open the month with strength, but profit taking kicks in for a few days after that opening strength. Then we typically see another strong run through the middle of the month, before options expiration (perhaps?) serves as another profit-taking period. The end of March shows tepid strength as we prepare for Q1 earnings, beginning in mid-April.
Sector Performance
Before we look at individual stocks, let's get an overview of how the various sectors and industries have performed during March over the past decade (during this secular bull market):
Sector Heat Map (no picture as images are causing our scrolling issue):
As mentioned last month, industrials (XLI) love the month of February and seasonality once again provided us a very nice hint about what we might see in February 2024. Industrials were close to leading all sectors in February. Here's a 1-month snapshot of February performance by sector:
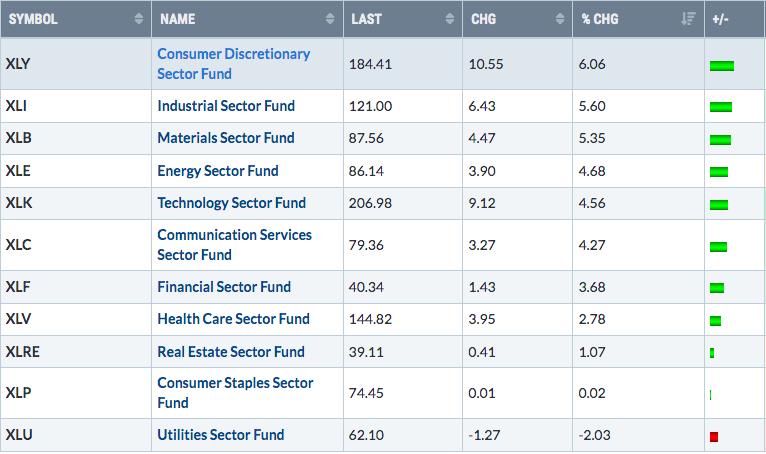
The February seasonal clue was nice, but where should we expect March sector strength based on history?
Defensive sectors have a history of outperforming the S&P 500 during March. Here's the AVERAGE outperformance of the four defensive sectors during March throughout this current secular bull market (since 2013):
- Utilities (XLU): +2.8%
- Consumer staples (XLP): +1.3%
- Real estate (XLRE): +1.2%
- Health care (XLV): +0.6%
All four defensive groups show excellent relative strength during March, which helps to underscore the "risk off " mentality that U.S. equities typically adopt - not only during March, but generally during the 3rd calendar month of all calendar quarters (so also June, September, and December).
I should also point out that technology (XLK) does perform well in March, but industrials (XLI) and, especially financials (XLF), tend to show relative weakness.
Utilities (XLU) doesn't look particularly attractive right now technically, but that's normally how it works. They suddenly awaken in March as a "risk off" environment replaces the "risk on" environment that is more typical of January and February. Here's how the XLU chart looks, along with how it's looked the past several years heading into March:
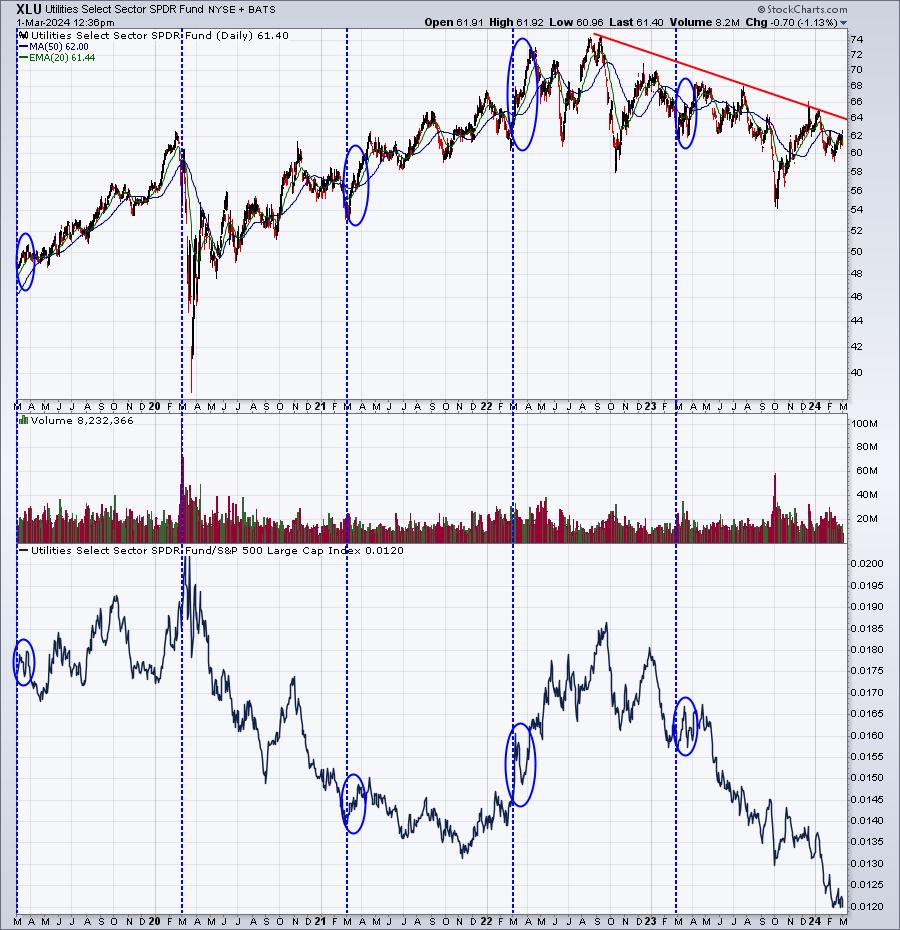
Even a test of the downtrend line would represent a 4% advance in the XLU. The blue-dotted vertical lines mark the start of March during each of the past 5 years. The blue circles highlight March absolute and relative price performance. March 2020 was awful as the 2020 pandemic actually resulted in more weakness among defensive sectors than aggressive sectors. But check out those other 4 years. Utilities came to life, despite showing little technical bullishness. It's simply the cyclical rotation that benefits this group. So the obvious question will be, "do we see this typical seasonal pattern occur again in 2024?" For those with a conservative mindset, overweighting utilities for the next 4 weeks make a lot of historical sense.
Industry Performance
Let's focus on the strongest sector, which is utilities (XLU), though history also tells us that technology (XLK) may still continue to run. Within the XLU, all industry groups tend to perform well. Conventional electricity ($DJUSVE) does have a slight edge and its chart is very similar to that of the XLU:
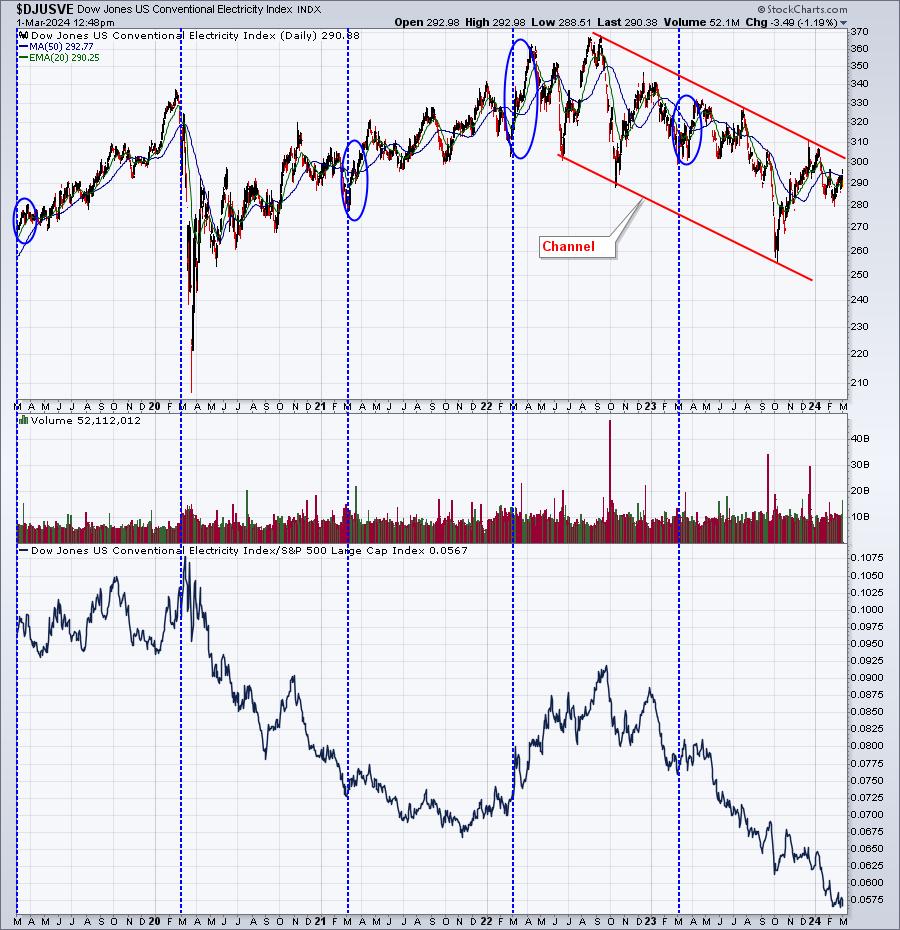
The DJUSVE has been downtrending vs. the S&P 500 for much of the past 5 years, but it's March absolute and relative strength has been undeniable. Again, these defensive-area investments are hedges during the month of March, not long-term investments. They could be great positions to take, especially if you're among the very conservative investor types.
Here are industry groups that tend to perform much better than the benchmark S&P 500 during March:
Technology (XLK):
- computer hardware, semiconductors, telecommunications equipment, software, computer services
Consumer Discretionary (XLY):
- broadline retailers, toys
Communication Services (XLC):
- none
Industrials (XLI):
- waste & disposal services, delivery services, business support services
Financials (XLF):
- specialty finance
Health care (XLV):
- none
Consumer staples (XLP):
- food products, food retailers & wholesalers, nondurable household products, distillers & vintners
Real estate (XLRE):
- specialty REITs
Utilities (XLU):
- conventional electricity, multiutilities, gas distribution, water
Energy (XLE):
- none
Materials (XLB):
- gold mining, mining, steel
Stocks for March
We've selected our Top 20 seasonal stocks for March. Several names represent sectors and industry groups that have been discussed above. Others simply stand out in March based on their own historical track record.
The stocks this month are as follows:
- LULU
- EQIX
- EPAM
- ANET
- MPWR
- CMG
- TTWO
- ULTA
- EQT
- CTRA
- AAPL
- KDP
- BLDR
- STLD
- MSCI
- FDS
- EXR
- DLTR
- MCO
- DG
A "Seasonality - March 2024" ChartList (annotated with 1 or 2 support levels to watch) has been created and will be available for viewing/download later today or over the weekend. You must be a StockCharts.com Extra or Pro member to download our ChartLists. Basic members and non-StockCharts.com members can view the charts one at a time.
Happy trading!
Tom