
EB Monthly Seasonality Report - April 2024
A Look Back At March Stocks:
One month ago, we provided a list of the Top 20 stocks that had strong historical track records during the month of March. Here are how they performed in March (through Friday, March 28th at 10:15am), in order of best to worst performance:
- STLD: +10.85%
- CMG: +8.78%
- CTRA: +8.76%
- BLDR: +7.24%
- DG: +6.88%
- EXR: +5.70%
- ANET: +4.31%
- KDP: +3.43%
- MCO: +3.23%
- TTWO: +0.84%
- MSCI: -0.48%
- EQT: -2.21%
- FDS: -2.89%
- AAPL: -5.24%
- ULTA: -5.35%
- MPWR: -6.33%
- EQIX: -8.16%
- EPAM: -8.97%
- DLTR: -9.60%
- LULU: -15.82%
The percentages represent the returns from the February 29th close to the March 28th (today) intraday price as of 10:15am ET. The average performance of all 20 stocks (-0.25%) failed to keep up with both the S&P 500 performance (+3.28%) and the NASDAQ 100 performance (+1.37%). Our biggest March winner was Steel Dynamics (STLD), which has been climbing parabolically for the past 2-3 weeks. Keep in mind that these Top 20 stocks are provided every month based SOLELY upon historical tendencies. It's up to everyone to decide if strong seasonal stocks warrant a trade after considering the overall market environment and the specific technical conditions present for each stock.
S&P 500 April Performance
Here's a breakdown of the annualized performance of the S&P 500 (since 1950) during the month of April:
- April 1-18: +31.39%
- April 19-24: -8.77%
- April 25-30: +10.55%
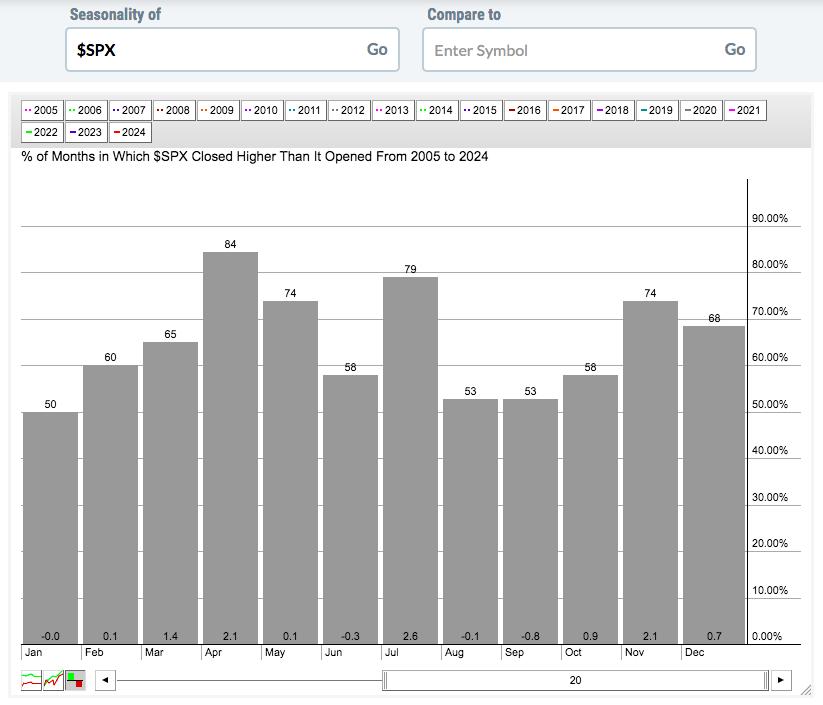
The pre-earnings run in early April accounts for nearly all of April's strength. Over the past two decades, April has moved higher more often than any other month, though it's average April return over that period is tied with November for 2nd, while both months trail July. Here are the numbers:
Sector Performance
Before we look at individual stocks, let's get an overview of how the various sectors and industries have performed during April over the past decade (during this secular bull market):
Sector Heat Map (no picture as images are causing our scrolling issue):
For March, history tells us to be more cautious as defensive sectors tend to outperform as profit taking hurts aggressive sectors on a relative basis. For March 2024, this is how the various sectors performed:
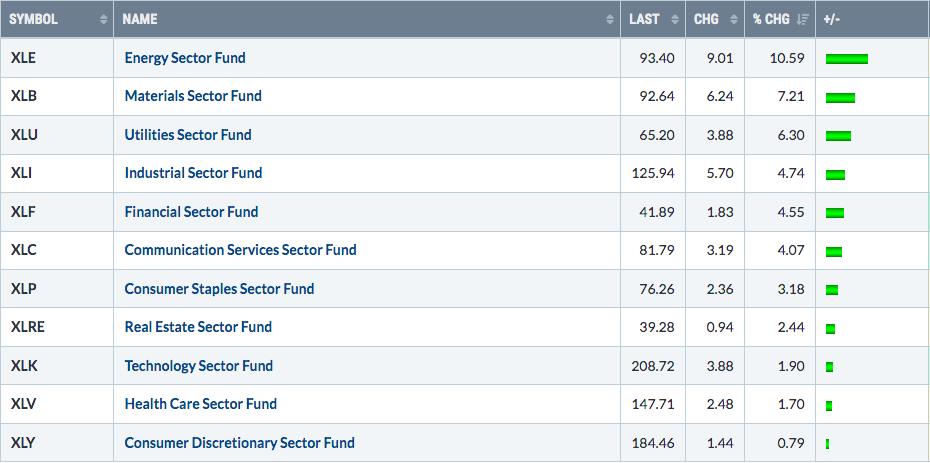
The neutral energy (XLE) and materials (XLB) sectors performed best, but all 11 sectors were higher. Utilities (XLU) tend to perform quite well in March and they did so again, gaining more than 6% during the month.
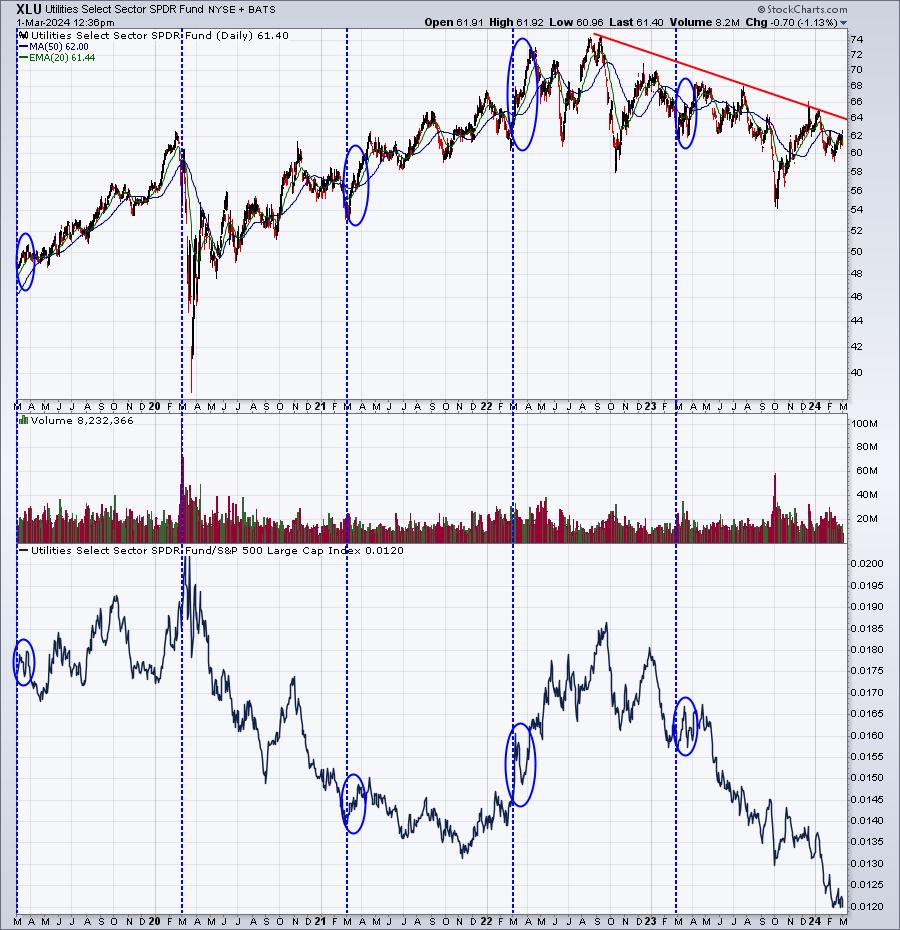
I had pointed out that utilities had looked awful heading into March in prior years and they were looking bad again at the end of February 2024. But, once again, that didn't seem to matter as traders sought out this defensive group. Here's the XLU chart as it appeared one month ago:
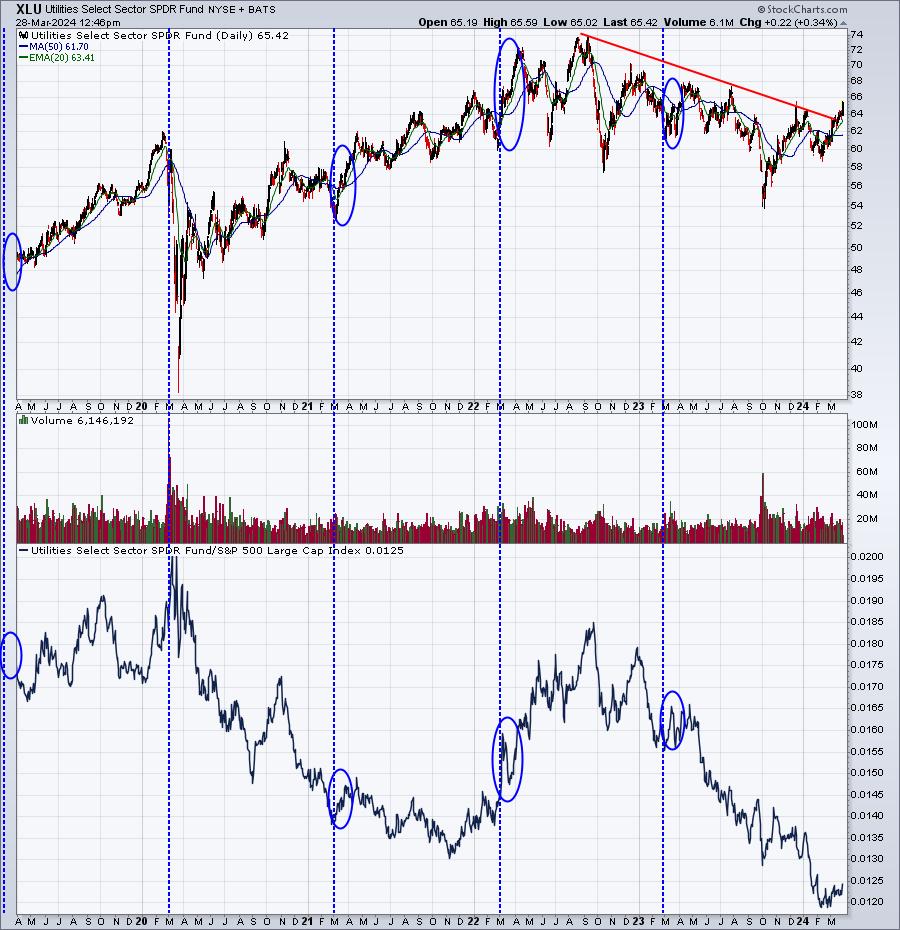
Here's the same chart one month later:
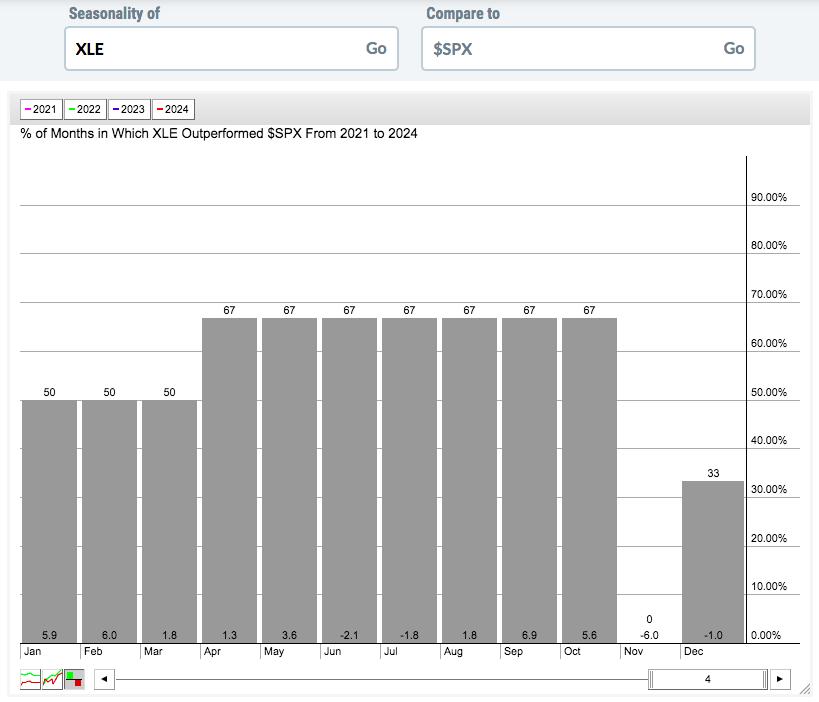
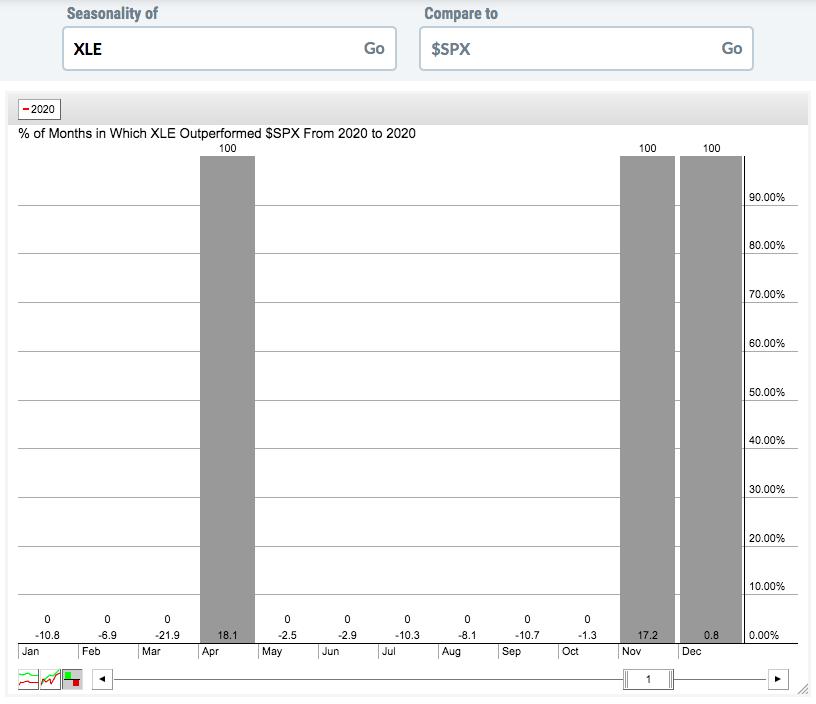
So what does history tell us about sector performance in April? Energy (XLE) and materials (XLB) may very well lead the market higher again, as they tend to perform extremely well in April. We do need to recognize, though, that the XLE's outperformance is partially due to its extreme outperformance in April 2020, as we rebounded from the March 2020 pandemic low. I'll show you 3 seasonality charts on the XLE that covers the past dozen years (since this secular bull market began). The first will be from 2021-2024, the second represents only 2020, and then the third represents the period 2013-2019:
XLE seasonality (2021-2024):
XLE seasonality (2020):
XLE seasonality (2013-2019):
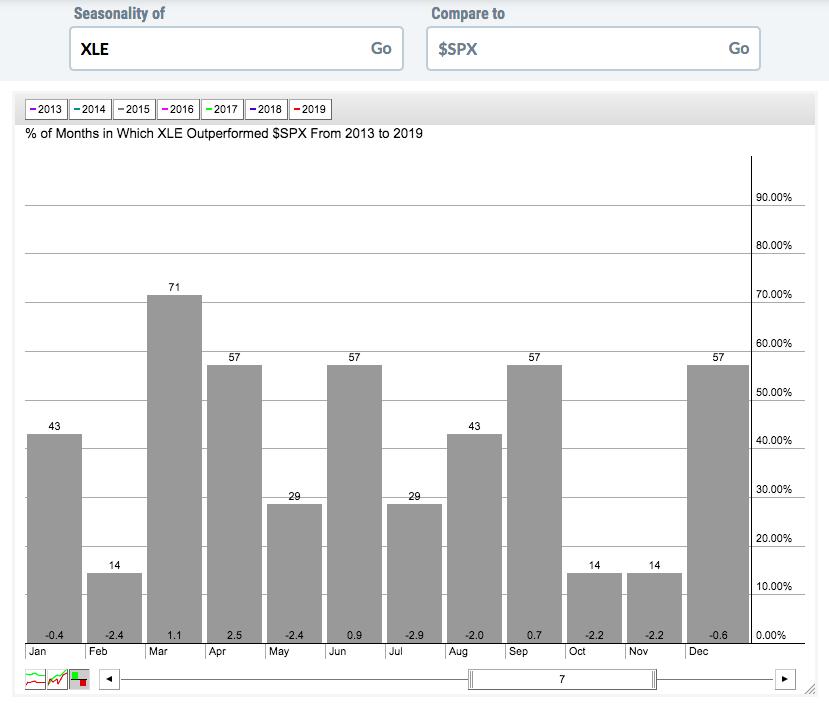
While April 2020 certainly skews the results in favor of strong seasonality over the entire 12-year period, it's important to note that if I break out the XLE seasonality using 3 different periods, all 3 periods show XLE outperformance. Therefore, we should respect the April strength that the XLE has enjoyed throughout this secular bull market.
Industry Performance
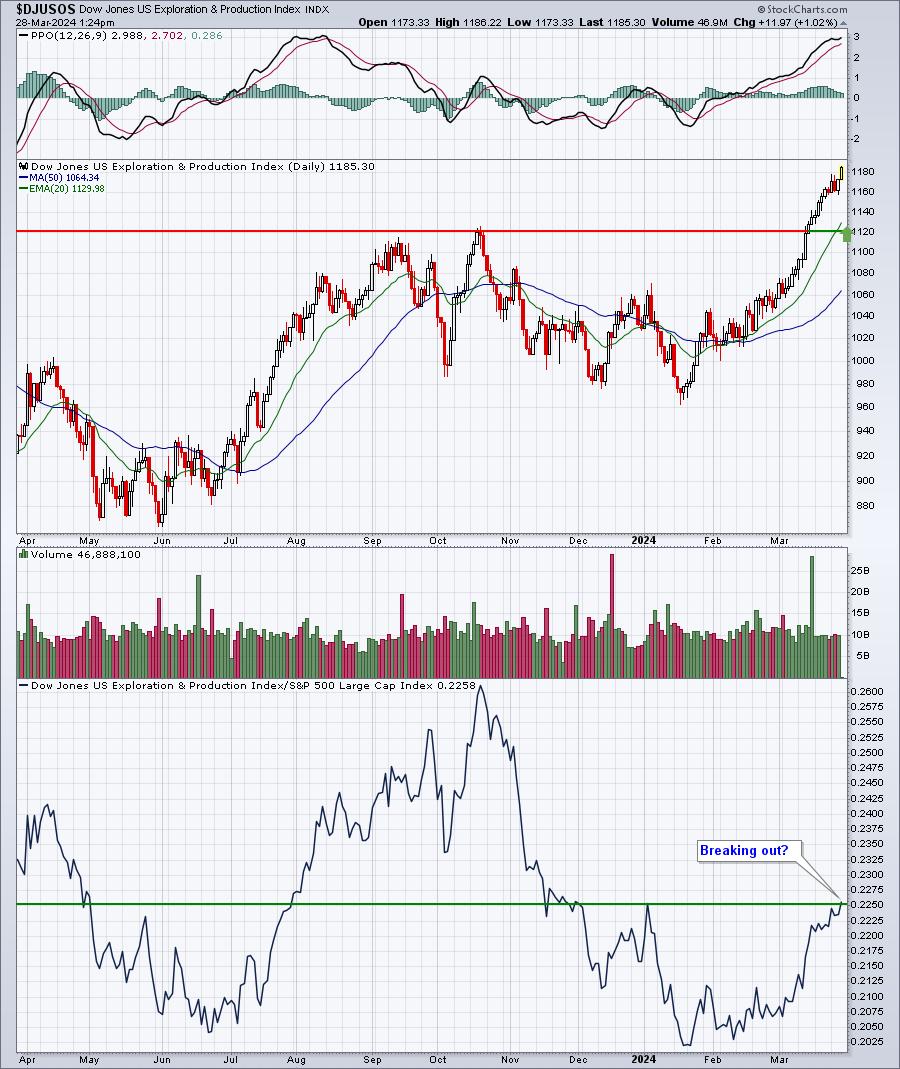
Let's focus on the strongest sector in April, which is energy (XLE). Within the XLE, all industry groups tend to perform well, but exploration & production ($DJUSOS) tends to be exceptionally strong. Heading into April, the DJUSOS is quite strong technically:
Here are all industry groups that tend to perform much better than the benchmark S&P 500 during April:
Technology (XLK):
- renewable energy, software
Consumer Discretionary (XLY):
- broadline retailers, restaurants & bars, home construction, home improvement retailers, hotels
Communication Services (XLC):
- internet
Industrials (XLI):
- marine transportation, transportation services
Financials (XLF):
- life insurance, consumer finance, specialty finance, full line insurance
Health care (XLV):
- none
Consumer staples (XLP):
- distillers & vintners, brewers
Real estate (XLRE):
- none
Utilities (XLU):
- none
Energy (XLE):
- exploration & production, coal, integrated oil & gas, oil equipment & services, pipelines
Materials (XLB):
- nonferrous metals, mining, gold mining, paper, specialty chemicals, commodity chemicals
Stocks for April
We've selected our Top 20 seasonal stocks for April. Several names represent sectors and industry groups that have been discussed above. Others simply stand out in April based on their own historical track record.
The stocks this month are as follows:
- BLDR
- EQT
- TTD
- ALGN
- FANG
- CE
- DVN
- MRO
- LULU
- AXP
- PXD
- BKR
- PFG
- SNA
- WAB
- AMZN
- HST
- EXPE
- META
- DFS
A "Seasonality - April 2024" ChartList (annotated with 1 or 2 support levels to watch) will be created and will be available for viewing/download before Monday's opening bell. You must be a StockCharts.com Extra or Pro member to download our ChartLists. Basic members and non-StockCharts.com members can view the charts one at a time.
Happy trading!
Tom