
EB Monthly Seasonality Report - July 2024
A Look Back At June Stocks:
One month ago, we provided a list of the Top 20 stocks that had strong historical track records during the month of June. Here are how they performed in June 2024, in order of best to worst performer:
- NOW: +19.75%
- ANET: +17.73%
- PODD: +13.89%
- ZS: +13.08%
- TSLA: +11.11%
- EW: +6.28%
- TTD: +5.27%
- VRTX: +2.94%
- OXY: +0.82%
- HOLX: +0.64%
- ILMN: +0.10%
- SBAC: -0.19%
- FTV: -0.43%
- PAYC: -1.57%
- LULU: -4.25%
- DXCM: -4.55%
- CSGP: -5.16%
- ETSY: -7.07%
- GNRC: -10.16%
- DECK: -11.54%
The percentages represent the returns from the May 31st close to the June 30th close. The average performance of all 20 stocks (+2.33%), while solid, underperformed both the S&P 500 performance (+3.53%) and the NASDAQ 100 performance (+6.47%). Our biggest June winner was NOW, which belongs to a software group ($DJUSSW) that just broke out. I really like NOW moving forward, but ZS, another software stock, could be quite interesting as it literally just cleared price resistance, reaching its highest level in 3 months:
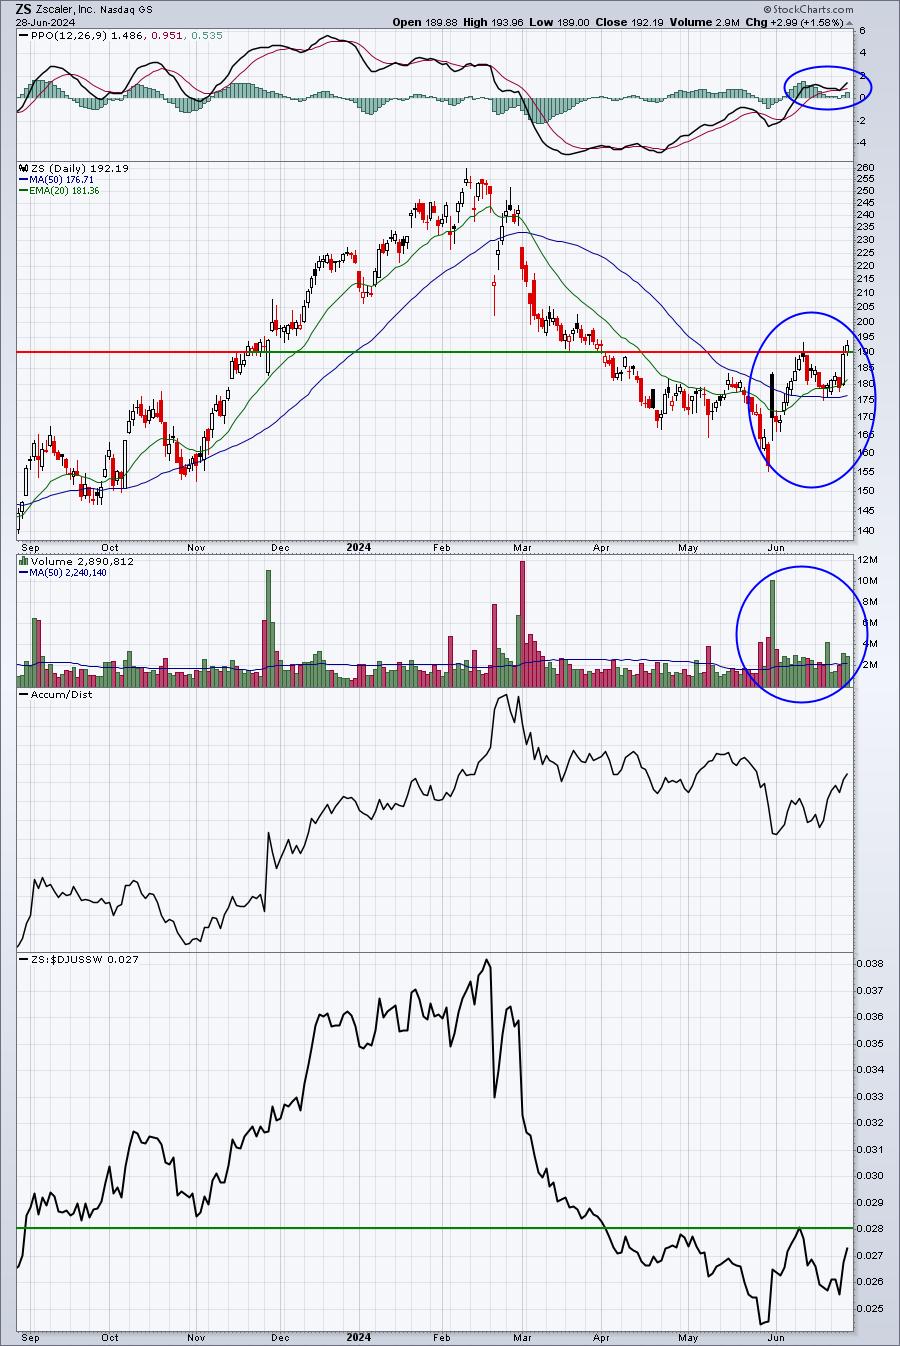
I want to see more relative strength vs. the software group. If I see that, then ZS could be a very strong July trading candidate.
S&P 500 July Performance
Here's a breakdown of the annualized performance of the S&P 500 (since 1950) during the month of July:
- July 1-17: +26.10%
- July 17-23: -16.37%
- July 24-31: +19.58%
July tends to perform quite well right up until the start of earnings season. Be careful during the week of July 17-23, though, as it represents one of the three worst periods of the year, trailing only October 22-27 and September 16-27.
Sector Performance
Before we look at individual stocks, let's get an overview of how the various sectors and industries have performed during July over the past 12 years (during this secular bull market):
After seasonal tendencies helped me identify sector winners in both April and May, this is what I had to say last month as we headed into June:
Well, let me start with the fact that June is the ONLY month in which consumer discretionary (XLY) has been the clear leader during this secular bull market. Don't be shocked to see Tesla, Inc. (TSLA) come back to life. If you look towards the bottom of this report, you'll see that TSLA is one of the better historical performers in June. Looking at the XLY chart, I see a potential head & shoulders top. But it must execute and close beneath the neckline to trigger a much broader decline:
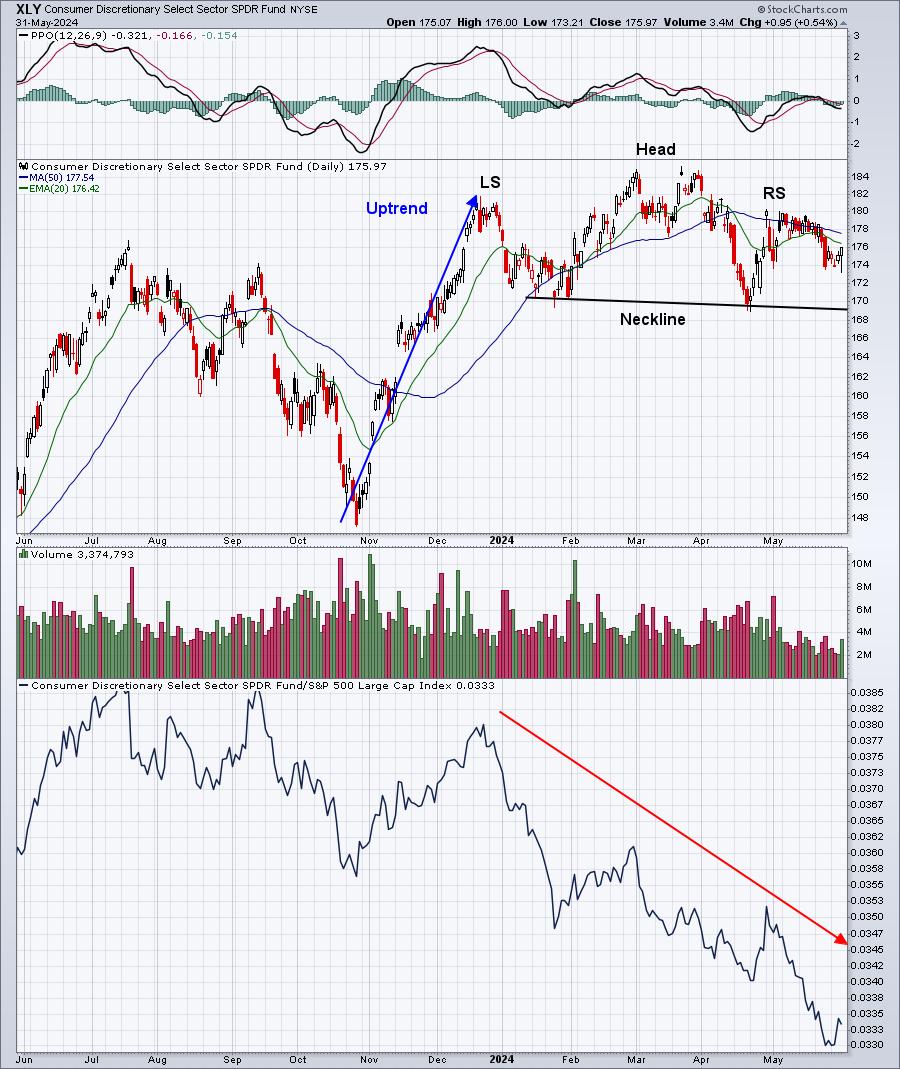
Hey, I'll be the first to admit that this doesn't look great technically. But again, I also know that a bearish pattern is NO GOOD until it executes - and they RARELY do during secular bull market advances. So I'll give the benefit of the doubt to the bulls for now. Let's see if the XLY can begin to right the ship in June. History certainly says it's a very real possibility.
Now we have the opportunity to see what actually happened. First, here's the 1-month sector performance:
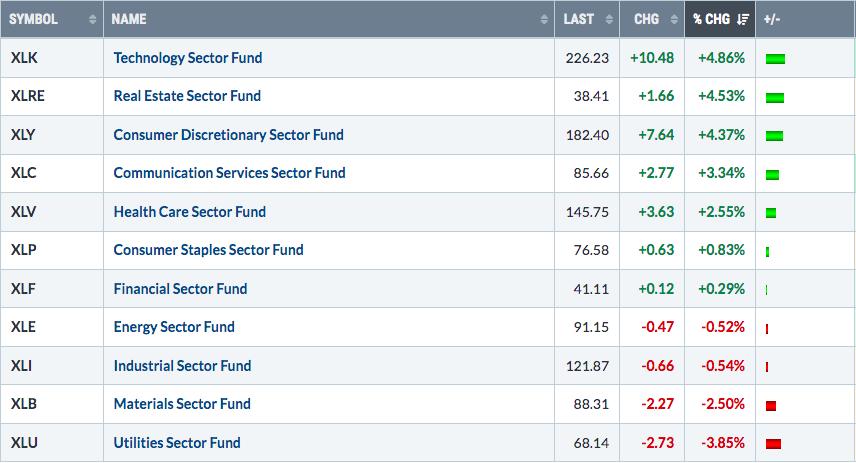
It wasn't the best-performing sector, but the XLY was close. The group came back to life, despite that ugly head & shoulders pattern being in play. As I said last month, these bearish patterns carry no weight unless they execute. Instead of executing, the XLY ran higher nearly all month and ended June testing key price resistance and attempting to break out:
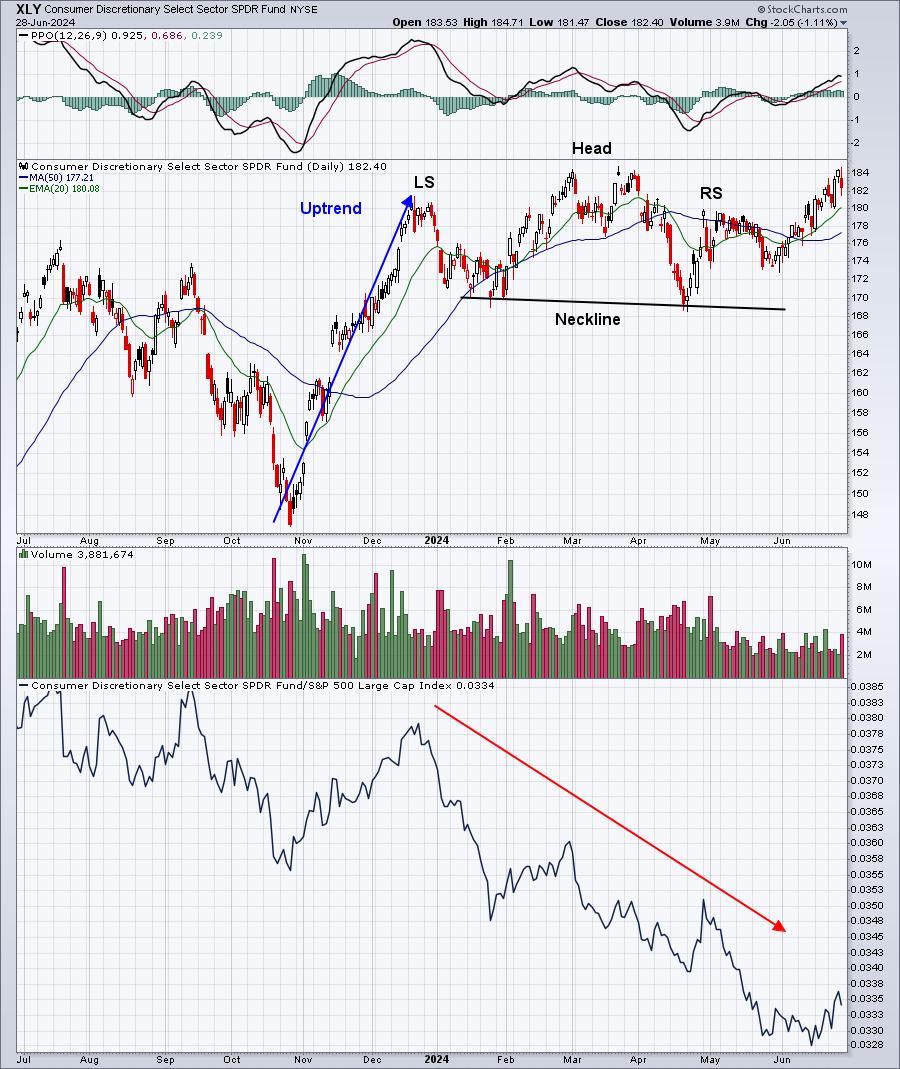
During the 2nd half of June, the XLY began outperforming the S&P 500. That's really what we all need to be watching in July. Does the XLY's relative outperformance continue. If so, it would be a very bullish development for U.S. equities.
So what might we see in July? History says we should be looking for further strength in consumer discretionary and perhaps more gains in technology as earnings season kicks into high gear once again. But July is not a great month for semiconductors, so the recent weakness there may very well continue. Computer hardware ($DJUSCR) and broadline retail ($DJUSRB) are a couple areas to watch closely. I see higher prices likely in both.
Industry Performance
Well, if I'm going to take credit for the seasonality calls made on sectors the past few months, then I need to also be critical of last month's seasonal industry pick of footwear ($DJUSFT). For much of June, we simply saw consolidation in this group, but then Nike (NKE), a major footwear component, reported quarterly results late last week and NKE dropped 20% on Friday alone.
Here are all industry groups that tend to perform much better than the benchmark S&P 500 during July:
Technology (XLK):
- renewable energy, computer hardware, electrical components & equipment
Consumer Discretionary (XLY):
- broadline retailers, automobiles, travel & tourism, business training & employment agencies, recreational products, specialized consumer services
Communication Services (XLC):
- internet
Industrials (XLI):
- trucking, delivery services
Financials (XLF):
- specialty finance, financial administration, mortgage finance
Health care (XLV):
- biotechnology, medical equipment
Consumer staples (XLP):
- none
Real estate (XLRE):
- real estate services
Utilities (XLU):
- none
Energy (XLE):
- coal
Materials (XLB):
- aluminum, steel, paper
Stocks for July
We've selected our Top 20 seasonal stocks for July. Several names represent sectors and industry groups that have been discussed above. Others simply stand out in July based on their own historical track record.
The stocks this month, with average July performance, are as follows:
- ETSY: +13.1%
- ISRG: 10.2%
- AMGN: 8.3%
- AAPL: 7.7%
- CTLT: 7.7%
- REGN: 7.5%
- ANET: 7.3%
- IQV: 7.2%
- PANW: 7.1%
- GNRC: 7.0%
- CF: 6.6%
- CMI: 6.4%
- ODFL: 6.3%
- PYPL: 6.2%
- ASML: 5.9%
- MPC: 5.8%
- EPAM: 5.8%
- META: 5.8%
- GOOGL: 5.8%
- TDY: 5.6%
A "Seasonality - July 2024" ChartList (annotated with 1 or 2 support levels to watch) will be created and will be available for viewing/download later today. You must be a StockCharts.com Extra or Pro member to download our ChartLists. Basic members and non-StockCharts.com members can view the charts one at a time.
Happy trading!
Tom