
EB Monthly Seasonality Report - September 2024
A Look Back At August Stocks:
Roughly one week ago, we released our list of the Top 20 stocks that had strong historical track records during the month of August. Here are how they've performed in August 2024 thus far, in order of best to worst performer:
- MELI: +19.86%
- TTD: +16.82%
- WDAY: +14.45%
- NVDA: +10.55%
- DXCM: +9.22%
- BLDR: +8.81%
- CF: +5.94%
- BKNG: +3.11%
- ANET: +2.50%
- AAPL: +2.26%
- CRM: +1.99%
- INCY: -1.43%
- PAYC: -1.91%
- MTCH: -2.15%
- BR: -2.31%
- HUM: -2.43%
- CZR: -4.16%
- PODD: -4.79%
- TSLA: -5.07%
- EPAM: -7.52%
The percentages represent the returns from the July 31st close to the August 23rd close. The average performance of all 20 stocks (+3.19%) outperformed both the S&P 500 (+2.06%) and the NASDAQ 100 (+1.90%). Our biggest August winner was MELI, a specialized consumer services company ($DJUSCS). MELI's August strength has resulted in a nice breakout with vastly-improved relative strength and a surging AD line:
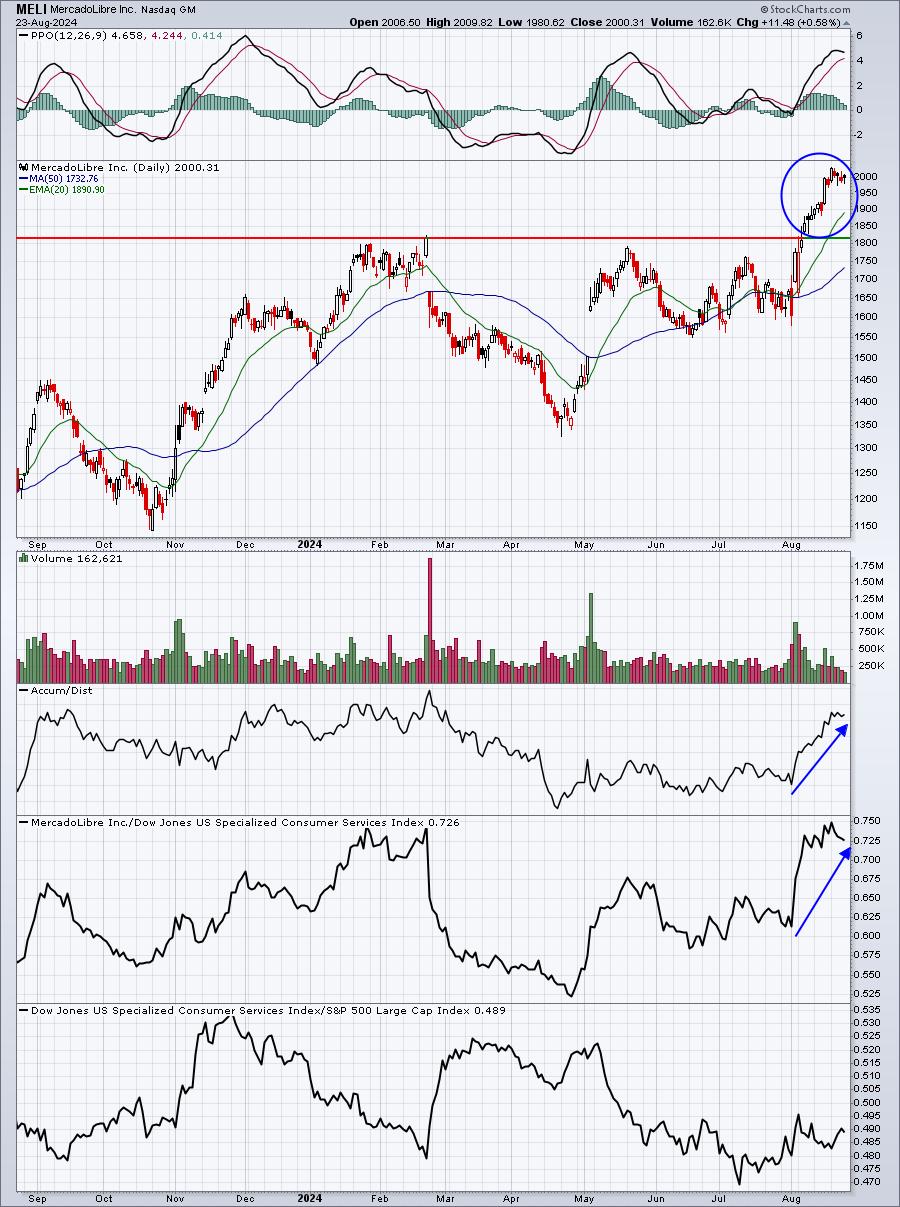
MELI's all-time candle body high was on January 21, 2021, when it opened at 2020. It wouldn't take much more price strength to clear that resistance level.
S&P 500 September Performance
Here's a breakdown of the annualized performance of the S&P 500 (since 1950) during the month of September, providing you the historical pockets of strength and weakness:
- September 1-3: +31.80%
- September 4-10: -14.91%
- September 11-16: +22.79%
- September 17-30: -26.77%
Broken down a different way, you can see that the 1st half of September isn't really that bad. It's the 2nd half that gives September its bearish reputation:
- September 1-16: +8.14%
- September 17-30: -26.77%
Sector Performance
Recently, when I published our August Seasonality Report, I pointed out that AAPL's two favorite months are July and August. Through Friday, August 23rd, AAPL has seen a moderate move higher during these two months in 2024 from 210.38 to 226.84. That's roughly an 8% higher, helping to lift the computer services group ($DJUSCR), which I also pointed out historically likes the month of August. It was also pointed out that software ($DJUSSW) tends to provide relative strength in August. However, that has not been the case in August 2024 as the $DJUSSW:$SPX relative strength line is currently testing a 52-week relative low.
Since this secular bull market began in 2013, energy (XLE) has been the best-performing sector during September. I'm going to instead focus on financials (XLF), however, because they're the 2nd best sector in the month and they have been the BEST sector performer in both October and November during the secular bull market. Here's an interesting relative performance stat for the XLF since 2013:
- XLF relative performance September through December: +4.3%
- XLF relative performance January through August: -2.8%
Here's the Seasonality chart where this information was derived:
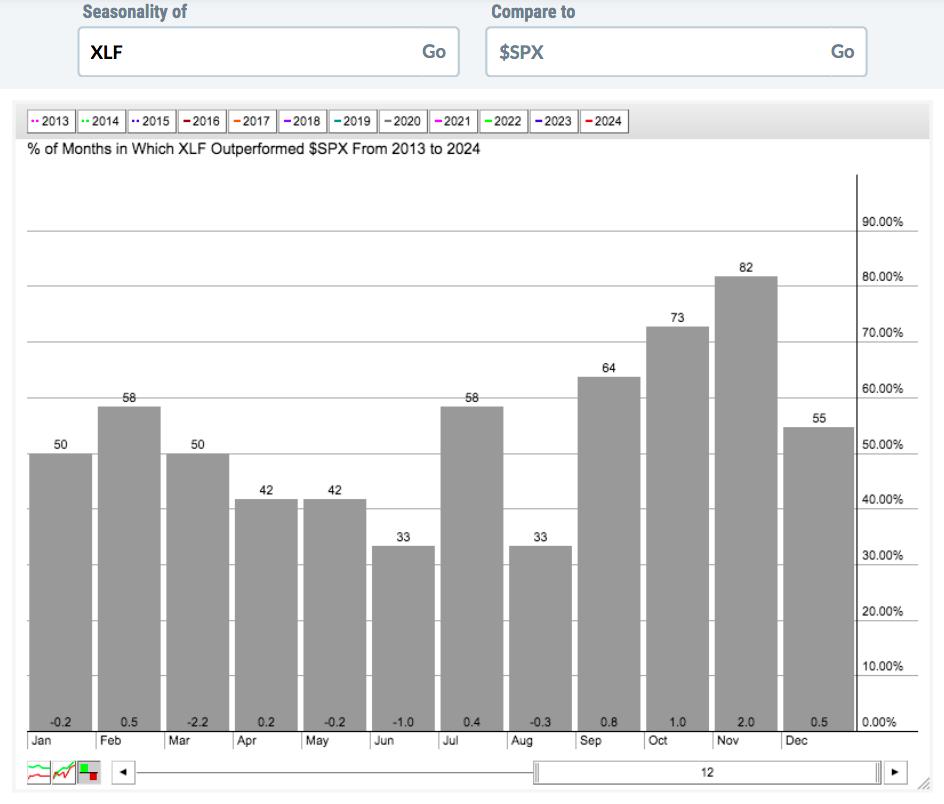
We are about to enter the best time of the year to be invested in financials and we'll be using this information to stack our portfolios with financials for next quarter. Tune into our Portfolio DRAFT on Monday, August 26th at 5:30pm ET to find out which financial stocks make it into our Portfolios.
Industry Performance
Insurance brokers ($DJUSIB) and life insurance ($DJUSIL) both tend to perform well in September, lifting financials, but it's the latter group that seems poised for a strong September ahead, given the 2024 breakout above multi-year price resistance:
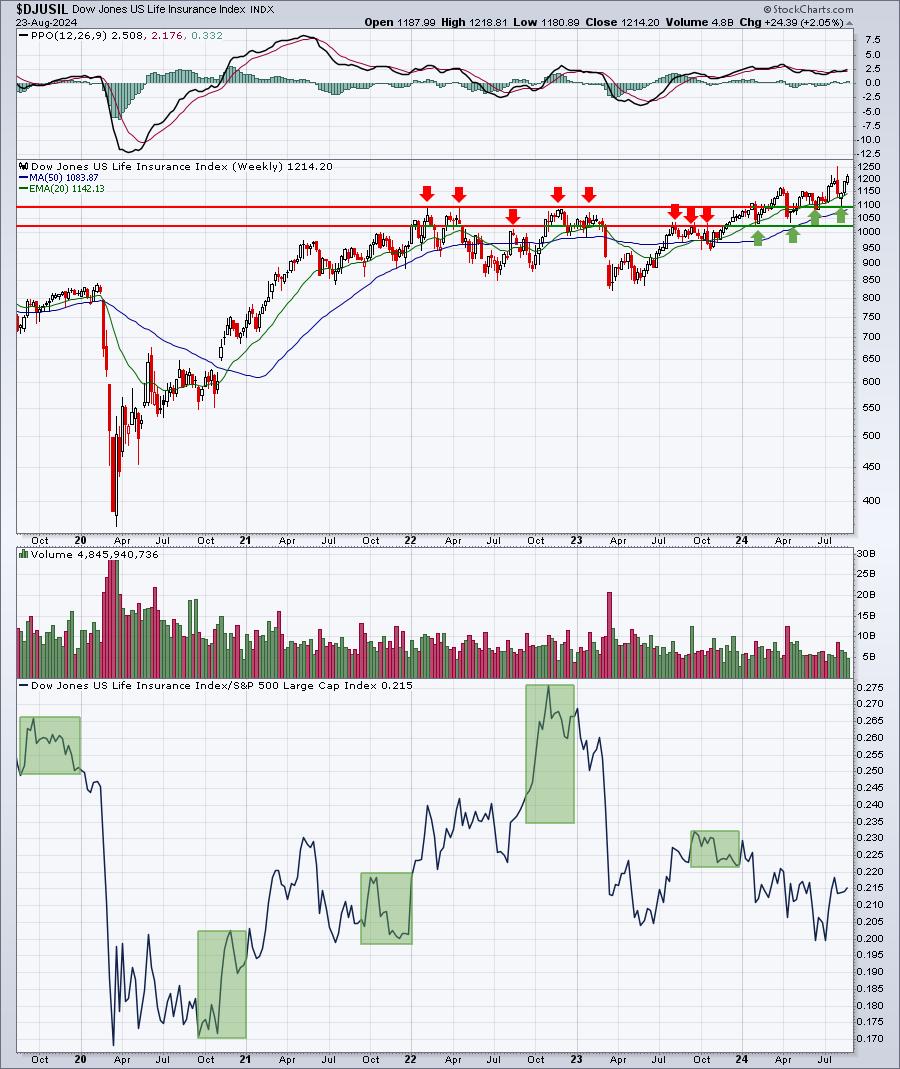
The top panel shows the bullish absolute price action and the bottom panel highlights the relative performance of the $DJUSIL during September through December over the prior 5 years. While it's not straight up every year, the group most definitely holds its own during the final four months of the year.
Here are all industry groups that tend to perform much better than the benchmark S&P 500 during September:
Technology (XLK):
- none
Consumer Discretionary (XLY):
- footwear, recreational products, home improvement retailers, apparel retailers, auto parts, hotels, restaurants & bars
Communication Services (XLC):
- fixed line communications, media agencies
Industrials (XLI):
- defense, railroads, airlines, heavy construction, trucking, industrial suppliers
Financials (XLF):
- insurance brokers, life insurance, full line insurance, property & casualty insurance, reinsurance
Health care (XLV):
- none
Consumer staples (XLP):
- brewers, tires, distillers & vintners
Real estate (XLRE):
- none
Utilities (XLU):
- none
Energy (XLE):
- exploration & production, integrated oil & gas
Materials (XLB):
- none
Stocks for September
We've selected our Top 20 seasonal stocks for September. Several names represent sectors and industry groups that have been discussed above. Others simply stand out in September based on their own historical track record.
The stocks this month, with average September performance, are as follows:
- ULTA: +8.8%
- TTD: +6.20%
- NKE: +3.90%
- ALGN: +3.80%
- LULU: +3.60%
- CME: +3.60%
- GRMN: +3.40%
- AXON: +3.30%
- URI: +3.20%
- BBWI: +3.00%
- RCL: +2.80%
- GPN: +2.70%
- DECK: +2.60%
- COP: +2.40%
- JBL: +2.40%
- DAL: +2.40%
- AMZN: +2.30%
- ACGL: +2.30%
- ALL: +2.20%
- ABNB: +1.80%
A "Seasonality - September 2024" ChartList (annotated with 1 or 2 support levels to watch) has been created and will be available for viewing/download on Monday. You must be a StockCharts.com Extra or Pro member to download our ChartLists. Basic members and non-StockCharts.com members can view the charts one at a time.
Happy trading!
Tom