
EB Monthly Seasonality Report - October 2024
ChartLists Update:
The following ChartLists have been updated and should be updated on our website within the hour:
- Strong Earnings (SECL)
- Strong Future Earnings (SFECL)
- Raised Guidance (RGCL)
- Short Squeeze (SSCL)
- Bullish Trifecta (BTCL)
There will be few earnings reports out over the next week, so I'll plan to update all ChartLists again in two weeks. From there, earnings season will begin to pick up and we'll move back to updating the end of each week.
A Look Back At September Stocks:
Last month, we released our list of the Top 20 stocks that had strong historical track records during the month of September. Here are how they performed in September 2024, in order of best to worst performer:
- DAL: +19.53%
- ULTA: +10.28%
- JBL: +9.65%
- AXON: +9.49%
- URI: +9.24%
- ABNB: +8.10%
- RCL: +7.99%
- ALGN: +7.21%
- NKE: +6.57%
- TTD: +4.90%
- LULU: +4.58%
- AMZN: +4.39%
- BBWI: +3.77%
- CME: +2.81%
- ALL: +0.38%
- DECK: -0.27%
- ACGL: -1.07%
- GRMN: -3.57%
- COP: -7.48%
- GPN: -7.53%
The percentages represent the returns from the August 31st close to the September 30th close. The average performance of all 20 stocks (+5.78%) crushed both the S&P 500 (+2.10%) and the NASDAQ 100 (+2.62%). Our biggest September winner was DAL, an airline ($DJUSAR). Airline stocks tend to be quite volatile and many times fail to sustain short-term rallies. DAL has advanced roughly 40% in just under 2 months, so profit taking in October would not be a surprise at all. I do want to point out, however, that if there's one time of the year for airlines, and DAL specifically, to continue tacking on gains, it's the September to November period:
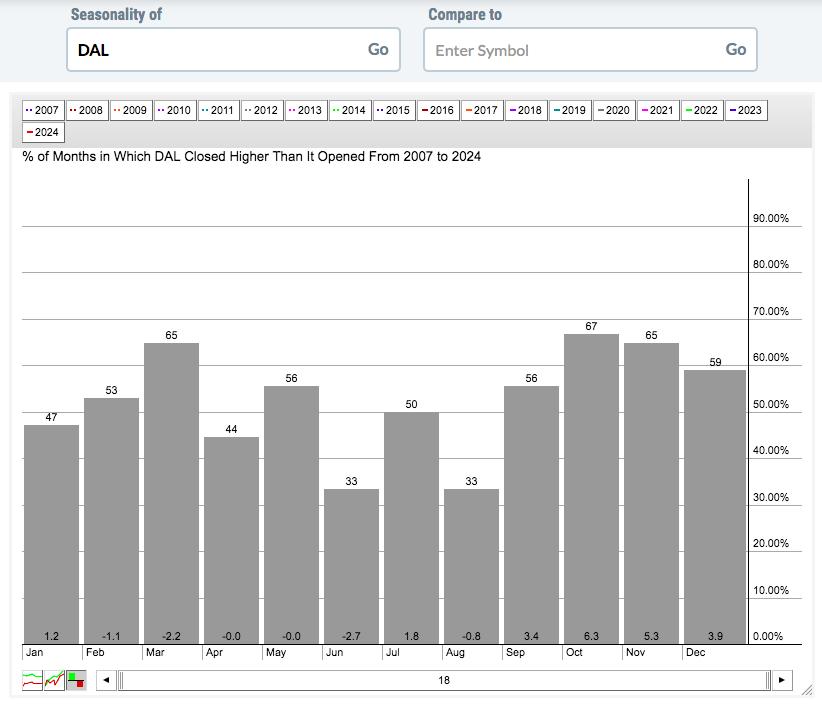
This seasonality chart shows how DAL has performed since 2007. The September through December period has resulted in DAL averaging gains of nearly 19% per year for the past 18 years. That's excellent performance. The other 8 calendar months combined show DAL losing an average of 3.8%. Clearly, we're in DAL's historical "sweet spot."
S&P 500 October Performance
Here's a breakdown of the annualized performance of the S&P 500 (since 1950) during the month of October, providing you the historical pockets of strength and weakness:
- October 1-6: +38.70%
- October 7-9: -32.21%
- October 10-21: +14.74%
- October 22-27: -42.45%
- October 28-31: +70.62
Broken down a different way, you can see that most of October is nothing more than back and forth action. It's the final few days of October that turn a "less than average" month into a "slightly better than average" month:
- October 1-27: +2.29%
- October 28-31: +70.62%
October's average annual return since 1950 is +10.86%, which ranks as the S&P 500's 7th best month. The end of month strength does mask relative weakness during the first 4 weeks of the month, though. The October 27th close through the January 18th close has absolutely been the most bullish stretch, rising 63 of the past 74 years. That's an 85% win rate for the bulls. We do have years when this period declines, but the overwhelming majority of years see gains, sometimes very sizable gains. When we reach October 27th, bet against this secular bull market at your own risk.
Sector Performance
Last month, I featured the financials (XLF), because of their tendency to outperform the S&P 500 not only in September, but also throughout Q4. The XLF didn't have a bad September, but it did underperform the S&P 500. There are still a few months of solid historical outperformance ahead, however, where the XLF typically provides leadership, so I won't be too quick to judge here.
Financials are also the best sector for the month of October and November, so let's take a quick look at the current technical picture:
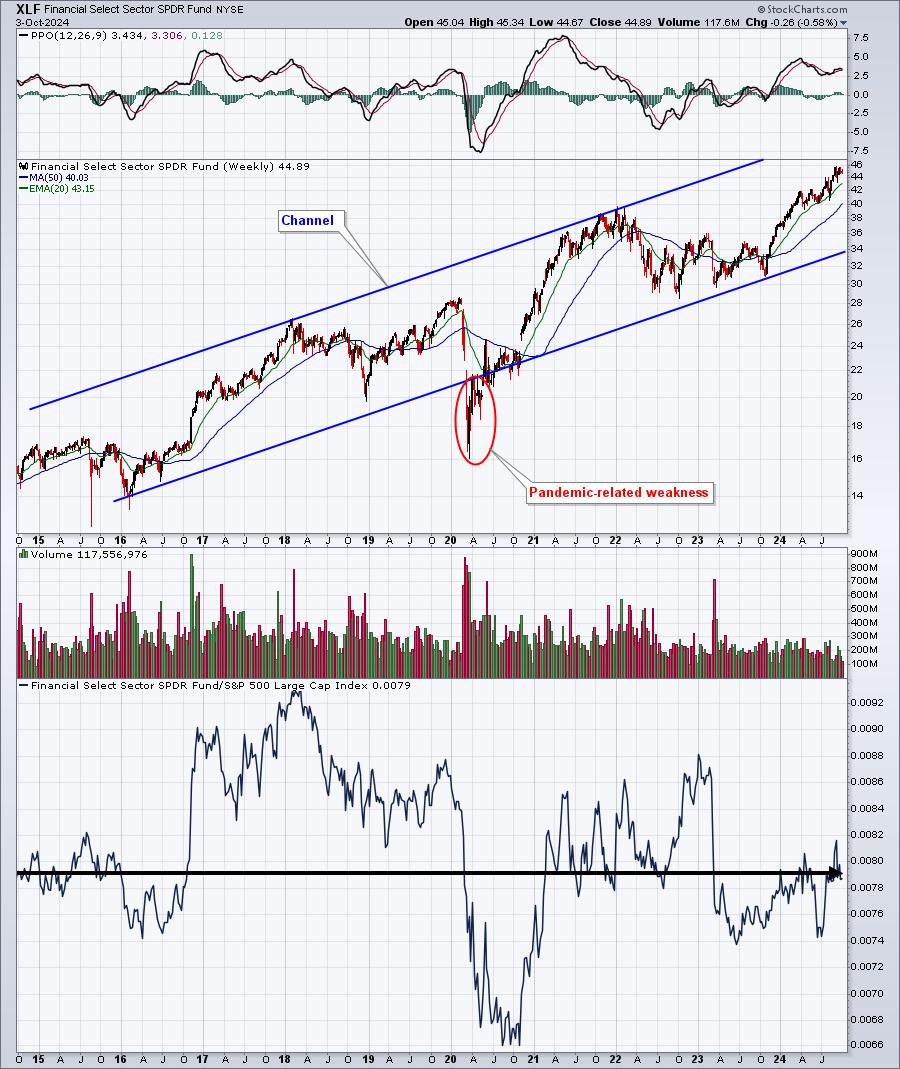
This is a 10-year weekly chart that illustrates the clear uptrend that financials have enjoyed. The bottom panel, however, shows that financials typically go along for the ride in a secular bull market, they don't usually lead. Financials are the best-performing sector in only two calendar months - October and November. Given that, and the fact that interest rates are just beginning to fall, I fully expect to see more leadership from financials ahead.
Industry Performance
Full line insurance ($DJUSIF) and property & casualty insurance ($DJUSIP) both tend to perform well in October, lifting financials. The latter is currently sitting near its all-time high, while the former has consolidated over the past several months after a very strong advance and is now testing its 50-week SMA:
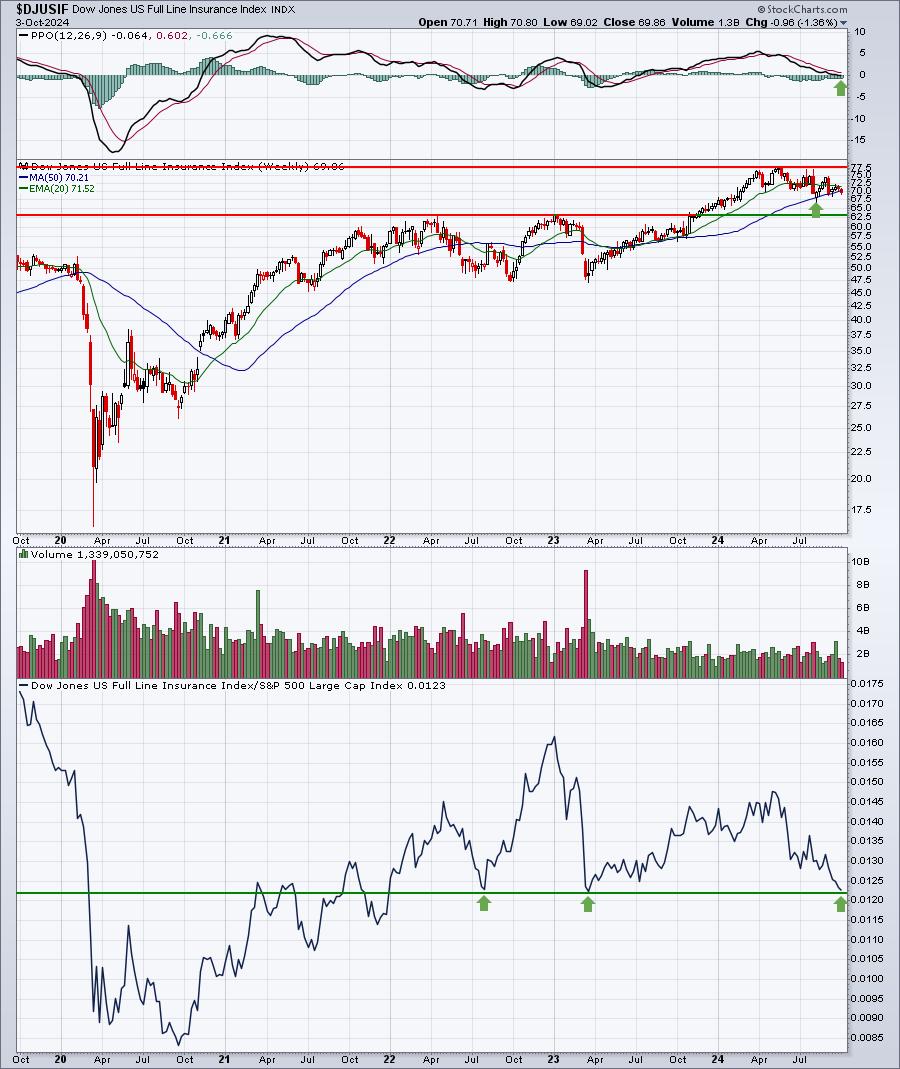
The DJUSIF also has reached a point of solid relative support, having touched this area in March 2023 and July 2022. While there are never any guarantees, the reward to risk on the DJUSIF appears to be strong. I like entry anywhere from the current price down to major price support near 63.
Here are all industry groups that tend to perform much better than the benchmark S&P 500 during October:
Technology (XLK):
- renewable energy, computer hardware, software
Consumer Discretionary (XLY):
- hotels
Communication Services (XLC):
- none
Industrials (XLI):
- diversified industrials, airlines
Financials (XLF):
- full line insurance, property & casualty insurance, banks, mortgage finance, asset managers, investment services
Health care (XLV):
- health care providers
Consumer staples (XLP):
- tobacco
Real estate (XLRE):
- none
Utilities (XLU):
- water, conventional electricity
Energy (XLE):
- none
Materials (XLB):
- steel, paper, nonferrous metals
Stocks for October
We've selected our Top 20 seasonal stocks for October. Several names represent sectors and industry groups that have been discussed above. Others simply stand out in October based on their own historical track record.
The stocks this month, with average October performance, are as follows:
- GOOGL: +8.6%
- UAL: +8.0%
- GM: +7.6%
- GNRC: +7.6%
- DAL: +6.8%
- MPC: +6.7%
- FFIV: +6.6%
- NFLX: +6.6%
- AAPL: +6.2%
- TYL: +5.8%
- ICE: +5.4%
- CBOE: +5.3%
- NDAQ: +5.2%
- HII: +5.1%
- PSX: +4.9%
- LRCX: +4.8%
- MSFT: +4.7%
- CB: +4.7%
- NOW: +4.7%
- TRV: +4.5%
A "Seasonality - October 2024" ChartList (annotated with 1 or 2 support levels to watch) has been created and will be available for viewing/download later today or over the weekend. You must be a StockCharts.com Extra or Pro member to download our ChartLists. Basic members and non-StockCharts.com members can view the charts one at a time.
Happy trading!
Tom