
EB Monthly Seasonality Report - November 2024
A Look Back At October Stocks:
Last month, we released our list of the Top 20 stocks that had strong historical track records during the month of October. Here are how they performed in October 2024, in order of best to worst performer:
- UAL: +37.15%
- GM: +13.20%
- DAL: +12.99%
- NFLX: +6.59%
- FFIV: 6.21%
- TRV: +5.05%
- NOW: +4.32%
- CBOE: +4.25%
- GNRC: +4.20%
- TYL: +3.75%
- GOOGL: +3.17%
- NDAQ: +1.25%
- CB: -2.06%
- ICE: -2.97%
- AAPL: -3.04%
- MSFT: -5.57%
- PSX: -7.33%
- LRCX: -8.90%
- MPC: -10.71%
- HII: -30.04%
The percentages represent the returns from the September 30th close to the October 31st close. The average performance of all 20 stocks (+1.58%) outperformed both the S&P 500 (-0.89%) and the NASDAQ 100 (-0.86%). Our biggest October winner was UAL, an airline ($DJUSAR). Airline stocks tend to be quite volatile and many times fail to sustain short-term rallies. However, Delta (DAL) was our top performing seasonal stock in September and now it's UAL in October. Last month, I showed how DAL loves the September to December period, gaining an average of 18.9% from September through December over the past 17 years. You can see that DAL was 3rd on our list for October. UAL has a similar track record from September through December, check this out:
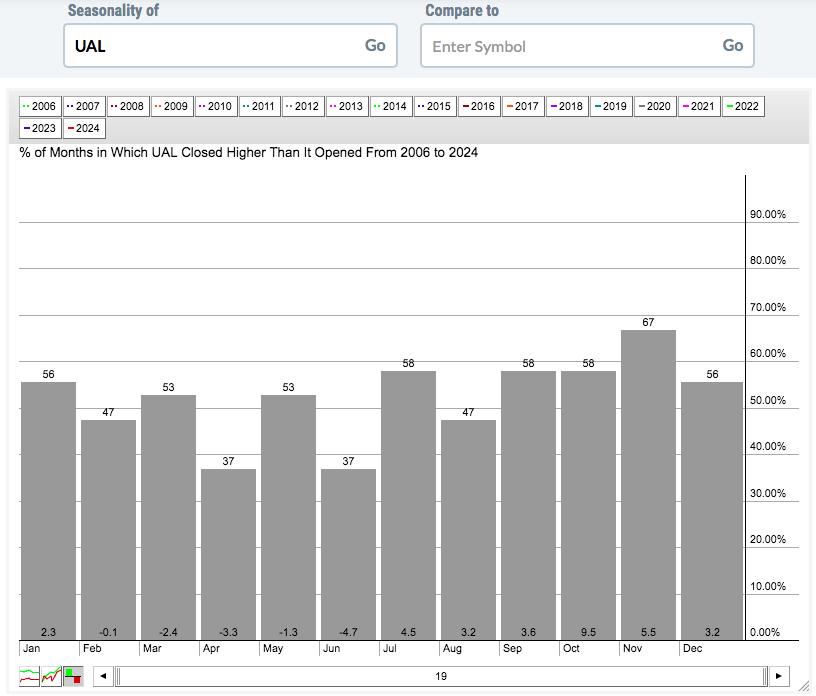
This seasonality chart shows how UAL has performed since 2006. The July through December period has resulted in UAL averaging gains of 29.5% per year for the past 19 years. That's incredible performance and it's consistent during both Q3 and Q4. The other 6 calendar months (first half of year) combined show UAL losing an average of 9.5%. I think it's rather clear when you want to own UAL.
S&P 500 November Performance
Here's a breakdown of the annualized performance of the S&P 500 (since 1950) during the month of November, a very bullish month historically. Since 1950, the S&P 500 has averaged gaining 21.40% during November, easily the best calendar month of the year. Here's a breakdown of strong and weak performance throughout November:
- November 1-5: +69.86%
- November 6-9: -6.63%
- November 10-13: +23.51%
- November 14-20: -13.05% (most of the weakness falls on the 19th and 20th, the rest is basically flat)
- November 21-30: +41.71%
As mentioned above, November's average annual return since 1950 is +21.40%, which ranks as the S&P 500's best calendar month. .
Sector Performance
For the last two months, I've featured financials (XLF), because of their tendency to outperform the S&P 500 from September through November. The XLF underperformed the S&P 500 in September and outperformed in October. It's also the best sector historically during November, and this is what I said last month about financials:
"Financials are the best-performing sector in only two calendar months - October and November......I fully expect to see more leadership from financials ahead."
I'll focus this month on the 2nd best sector, industrials (XLI). Let's take a quick look at the current technical picture for the XLI:
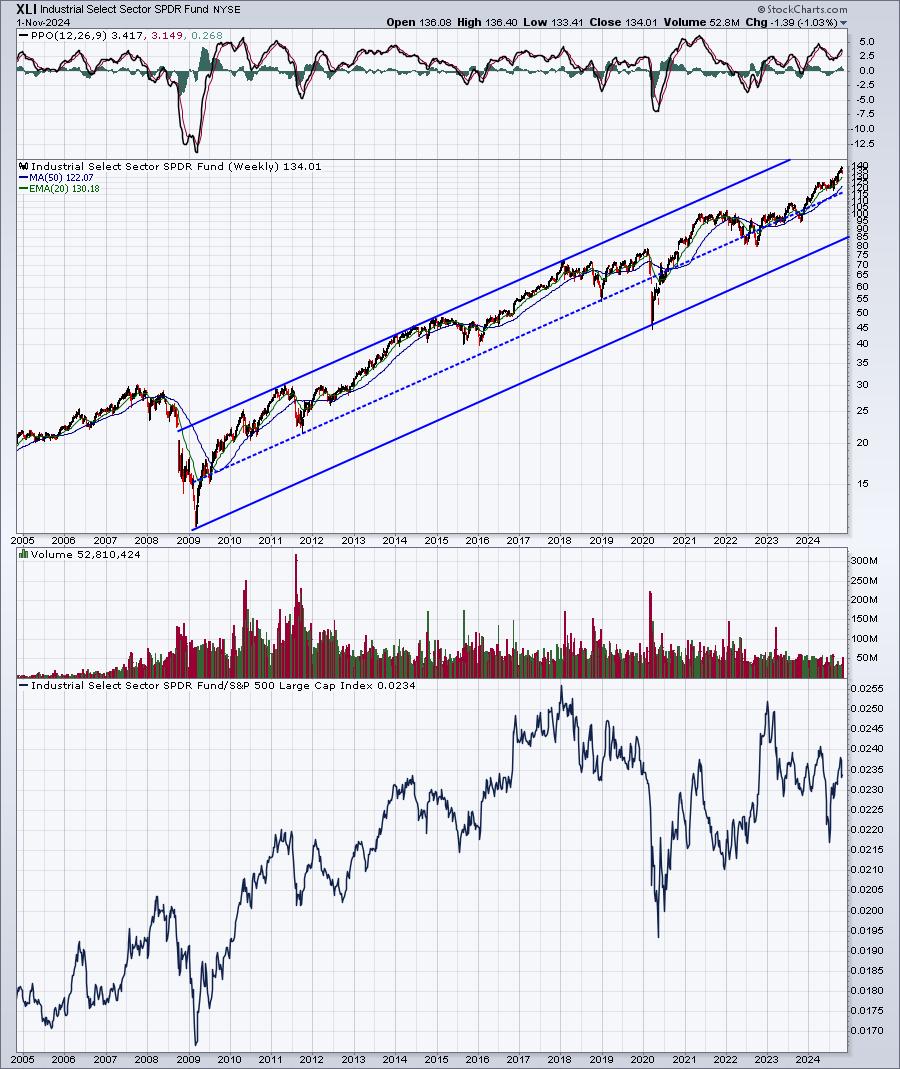
Industrials have clearly been in a long-term uptrend since the 2009 bottom. It's still quite a distance from the upper trendline, though, so plenty of potential upside remains here. Relative strength was strong from 2009 to 2018, but it's been very weak over the past 5-6 years. I wouldn't be surprised if industrials provide significant leadership over the balance of this decade.
Industry Performance
Last month, I pointed out that I really liked both full-line insurance ($DJUSIF) and property & casualty insurance ($DJUSIP) during the month of October. I thought DJUSIF was better suited for an advance, because the group had already consolidated for awhile, whereas the DJUSIP was sitting near record highs, potentially meaning more risk. The DJUSIF did, in fact, perform much better than the DJUSIP, so when you consider historical strength and weakness, it doesn't mean we should ignore technical indicators.
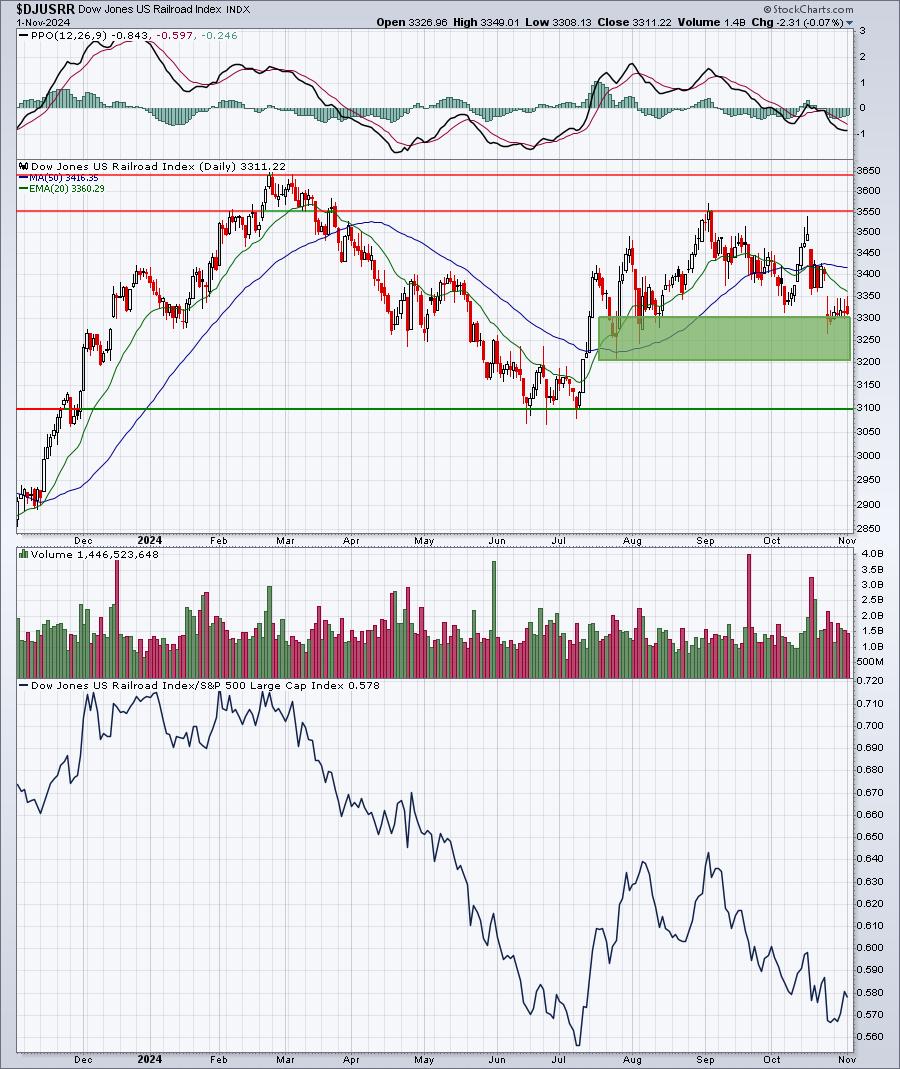
For this month, there are several leading industries within the industrial sector. The best November performer is airlines ($DJUSAR), but I spent time above detailing strength in a couple key names there, so let's focus on another area of transports - railroads ($DJUSRR). Trucking ($DJUSTK) broke out just this week to join a red-hot airline group, so that leaves railroads. I expect them to begin to play "catchup" with the other transports and I see short-term support from 3200-3300. I won't be surprised to see a rally from this level of support:
Here are all industry groups that tend to perform much better than the benchmark S&P 500 during October:
Technology (XLK):
- semiconductors, electronic equipment, electrical components
Consumer Discretionary (XLY):
- home construction, apparel retailers, footwear, automobiles, clothing & accessories, hotels, recreational products, gambling, durable household products, home improvement retailers, recreational services, restaurants & bars, specialized consumer services
Communication Services (XLC):
- publishing
Industrials (XLI):
- airlines, aerospace, railroads, industrial suppliers, building materials & fixtures, commercial vehicles & trucks, industrial machinery, delivery services, trucking, heavy construction, business support services
Financials (XLF):
- asset managers, banks, investment services, life insurance
Health care (XLV):
- biotechnology
Consumer staples (XLP):
- tires, drug retailers, food retailers & wholesalers
Real estate (XLRE):
- real estate services, hotel & lodging REITs
Utilities (XLU):
- none
Energy (XLE):
- none
Materials (XLB):
- aluminum, nonferrous metals, steel
Stocks for November
We've selected our Top 20 seasonal stocks for November. Several names represent sectors and industry groups that have been discussed above. Others simply stand out in November based on their own historical track record.
The stocks this month, with average November performance, are as follows:
- MRNA: +33.90 (only 6 years of history, so it's a stretch to include it; it has gained ground every November)
- AMD: +11.10%
- TSLA: +9.80%
- ALK: +9.00%
- ENPH: +8.30%
- MRVL: +8.20%
- NVDA: +8.00%
- MTD: +7.80%
- MKTX: +7.50%
- MNST: +7.40%
- DXC: +7.30%
- BBWI: +7.20%
- NXPI: +7.10%
- MSCI: +7.10%
- HOLX: +6.80%
- DE: +6.80%
- ROK: +6.70%
- PH: +6.60%
- CNC: +6.60%
- ABBV: +6.10%
A "Seasonality - November 2024" ChartList (annotated with 1 or 2 support levels to watch) will be created and made available for viewing/download over the weekend. You must be a StockCharts.com Extra or Pro member to download our ChartLists. Basic members and non-StockCharts.com members can view the charts one at a time.
Happy trading!
Tom