
EB Monthly Seasonality Report - January 2025
A Look Back At December Stocks:
Last month, we released our list of the Top 20 stocks that had strong historical track records during the month of December. Here are how they performed in December 2024, in order of best to worst performer:
- AVGO: +43.42%
- LLY: -2.94%
- IVZ: -3.37%
- RCL: -5.26%
- LYV: -6.33%
- SMCI: -6.62%
- ILMN: -7.30%
- VTR: -7.38%
- MGM: -9.62%
- ARE: -10.29%
- TMUS: -10.61%
- ON: -11.35%
- NVR: -11.44%
- EXR: -11.59%
- LW: -13.48%
- STX: -14.19%
- MHK: -14.19%
- WDC: -18.30%
- LEN: -21.80%
- BLDR: -23.35%
The percentages represent the returns from the November 30th close to the December 31st close. The average performance of all 20 stocks (-8.30%) significantly underperformed both the S&P 500 (-2.41%) and the NASDAQ 100 (+0.45%). Our biggest December winner was Broadcom, Inc., a semiconductor stock ($DJUSSC), which soared during December on extremely heavy volume after its quarterly earnings were released mid-month. On the flip side, Builders FirstSource, Inc. (BLDR), was our worst December performer and had only 3 hollow candles (daily close above daily open) the entire month.
19 of our 20 stocks were DOWN in December, with only AVGO finishing the month higher than it started. It was BY FAR the worst monthly performance by our Top 20 monthly seasonal stocks during all of 2024. Interestingly, December 2023 was the best monthly performance by our Top 20 monthly seasonal stocks during all of 2023. So we've seen extreme December performance in both directions among these strong seasonal stocks in the last two years.
Real estate (XLRE) and utilities (XLU) tend to perform extremely well during the month of December. However, December 2024 was an anomaly as the XLRE and XLU posted losses of -8.65% and -7.97%, respectively. Quite clearly, this led to the awful seasonal performance produced last month.
S&P 500 January Performance
Here's a breakdown of the annualized performance of the S&P 500 (since 1950) during the month of January, a slightly bullish month historically. It is important to note that while January is just mildly bullish on the S&P 500, the NASDAQ does produce much more bullish results as January (+30.19%) ranks as the NASDAQ's best month of the year, easily outpacing November (+25.36%), which is the NASDAQ's 2nd best month. Here's a breakdown of strong and weak performance periods throughout January on the S&P 500:
- January 1-6: +37.03%
- January 7-9: -30.34%
- January 10-18: +16.34%
- January 19-22: -21.15%
- January 23-31: +24.71%
January's annualized return since 1950 is +12.84%, which ranks as the S&P 500's 6th best calendar month. So again, January is bullish on the S&P 500 historically, just not nearly as bullish as it is on the NASDAQ.
Sector Performance
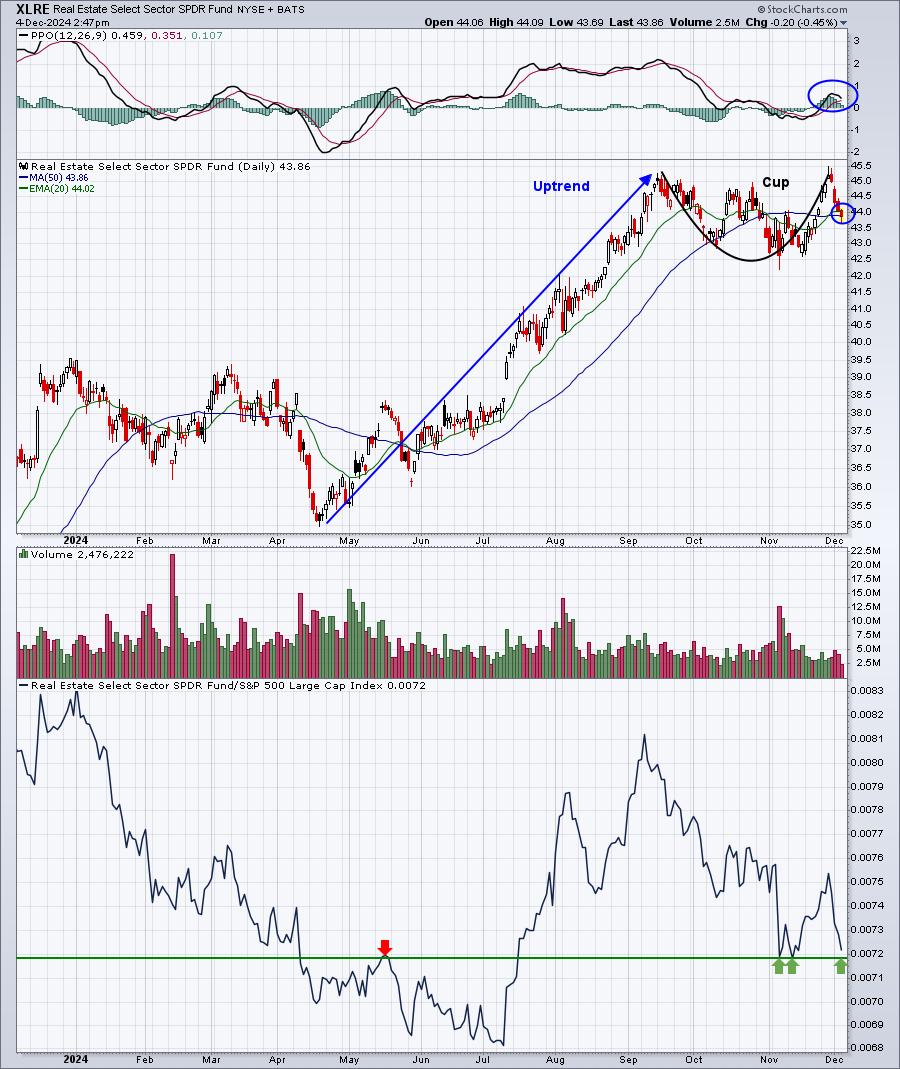
Last month, I thought we'd see a nice bounce in real estate (XLRE) off of 50-day SMA support after it appeared that the handle in a bullish cup with handle continuation pattern was complete. Here's what I was looking at on the XLRE chart in early December:
That never materialized, however, and you can now see the rest of the December story:
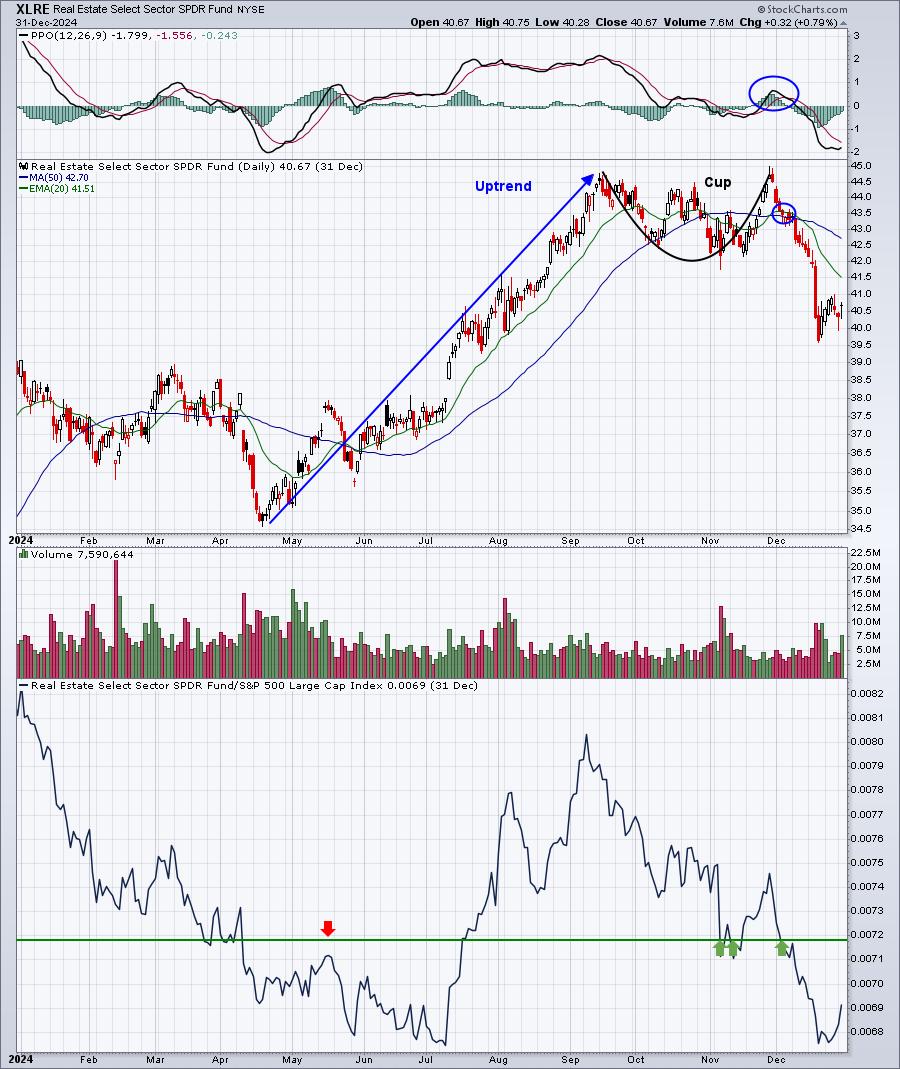
I mentioned a month ago that I wanted "to see the XLRE:$SPX relative support (3 green arrows in bottom panel) level hold. If it does, we should begin to see real estate showing up more often at the top of the sector leaderboard in the next few days to few weeks." That relative support level was lost and more pain ensued in December, taking down many of our Top 20 seasonal stock picks for December.
In January, we typically see a very strong communications services sector (XLC), which has averaged gaining 3.7% during the month since 2013, the year the current secular bull market was confirmed. The XLC has performed way better than the S&P 500, which has gained an average of 0.8% during January since 2013. Technically, the XLC struggled in December as it fought a negative divergence, which ultimately resulted in a 50-day SMA test and is closing in on a PPO centerline test after earlier printing a negative divergence. It now appears that the PPO has been reset near the centerline, so it wouldn't be a big surprise to see the XLC start to outperform in January 2025. Check out the current XLC chart:
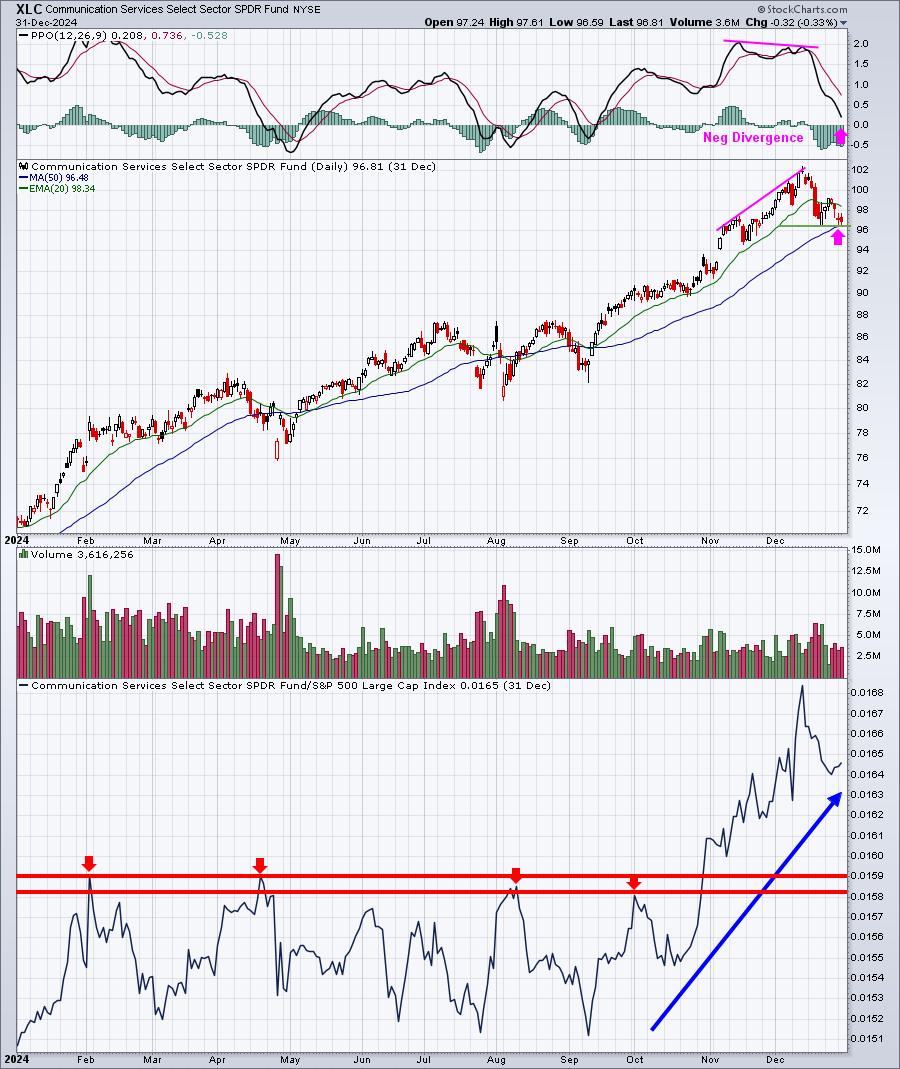
The pink arrows highlight perfectly what I look for after a negative divergence prints - a zero line test on the PPO (rapidly approaching) and/or a 50-day SMA test.
Industry Performance
Internet ($DJUSNS) is a group within the XLC that LOVES the calendar month of January. Its average January gain since 2013 is 4.5% as you can see on the seasonality chart below:
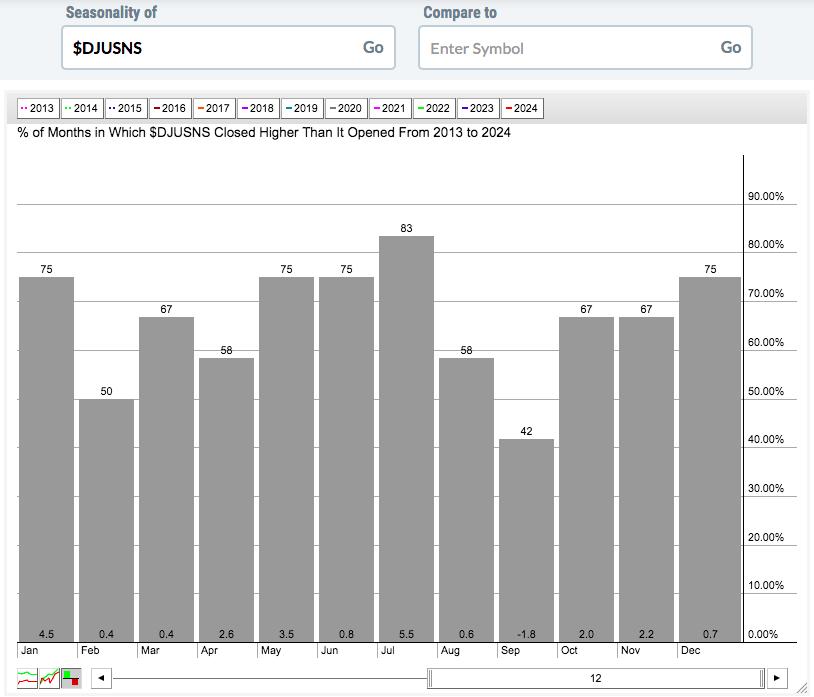
You can see above that July appears to be a better month for internet stocks and it's true if you only consider the absolute performance. But let's look at relative performance and I think you'll see why I believe January is the group's best month:
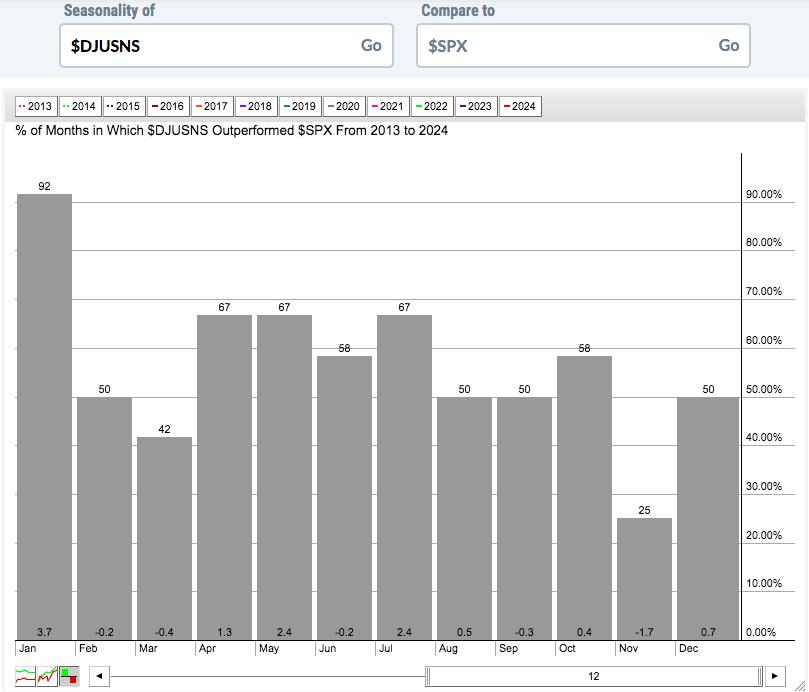
Internet has outperformed the S&P 500 during EVERY January since 2013, except one. That was in January 2022 as that year's cyclical bear market began that month. The relative performance of internet stocks in January has been truly remarkable, so keep an eye on stocks like NFLX, META, and GOOGL as the month gets underway.
Here are all industry groups that tend to perform much better than the benchmark S&P 500 during January:
Technology (XLK):
- software, renewable energy
Consumer Discretionary (XLY):
- broadline retail, home construction, gambling, toys, specialty retail, automobiles, business training & employment agencies
Communication Services (XLC):
- internet
Industrials (XLI):
- airlines
Financials (XLF):
- specialty finance
Health care (XLV):
- medical equipment
Consumer staples (XLP):
- general retail, drug retail, brewers, tobacco
Real estate (XLRE):
- mortgage REITs
Utilities (XLU):
- none
Energy (XLE):
- oil equipment & service, pipelines
Materials (XLB):
- gold mining
Stocks for January
We've selected our Top 20 seasonal stocks for January. Several names represent sectors and industry groups that have been discussed above. Others simply stand out in January based on their own historical track record.
The stocks this month, with average January performance and next earnings dates, will be updated on our website later today. In the meantime, I can tell you that stocks that typically perform well in January include NFLX, SMCI, ILMN, META, PHM, VLO, NXPI, HOLX, FANG, NOW, TSLA, DXCM, TEAM, WBD, and MU. Expect these stocks minus perhaps 1 or 2, to be on our Final Top 20 list later today.
A "Seasonality - January 2025" ChartList (annotated with 1 or 2 support levels to watch) will be created and should be available for viewing/download later today. You must be a StockCharts.com Extra or Pro member to download our ChartLists. Basic members and non-StockCharts.com members can view the charts one at a time.
Happy trading!
Tom