
EB Monthly Seasonality Report - March 2025
Note
I apologize for the week delay in providing you the March seasonality information. In hindsight, it turned out to be rather fortuitous since March has gotten off to such a rough start. Still, thanks for your patience and understanding as I took my medical-related trip to Florida recently. We are now caught up on all of our Reports and ChartLists. The Seasonality ChartList for March hasn't been posted, but should be available on our website later today or tomorrow.
A Look Back At February Stocks:
Last month, we released our list of the Top 20 stocks that had strong historical track records during the month of February. Here are how they performed in February 2025, in order of best to worst performer:
- TPL: +10.08%
- FTNT: +7.07%
- BKNG: +5.88%
- NVDA: +4.04%
- NXPI: +3.38%
- PANW: +3.26%
- CPAY: -3.53%
- ENPH: -7.95%
- AVGO: -9.87%
- CDW: -10.52%
- CF: -12.14%
- AMAT: -12.35%
- MOS: -14.23%
- URI: -15.27%
- CDNS: -15.83%
- BLDR: -16.91%
- ANET: -19.25%
- ZBRA: -19.62%
- SWKS: -24.90%
- TTD: -40.75%
The percentages represent the returns from the January 31st close to the February 28th close. The average performance of all 20 stocks (-9.47%) was the worst of any month that I can recall and badly lagged the S&P 500 (-1.27%) and the NASDAQ 100 (-2.70%). Our biggest February winner was Texas Pacific Land (TPL), an exploration & production stock ($DJUSOS), which was odd given that the DJUSOS was flat for the month.
14 of our 20 stocks were DOWN in February, with more than half of them down at least 10%. Overall, it was a brutally-weak February for our Seasonality Top 20 picks, one month after having such a strong January.
S&P 500 March Performance
The annualized performance of the S&P 500 (since 1950) during the month of March has been solid historically, but has favored more defensive and value-oriented stocks. Since 1950, March has produced an annualized return of 13.38% on the S&P 500, which ranks 5th among all calendar months. Here's a breakdown of strong and weak performance periods throughout March on the S&P 500:
- March 1-5: +43.17%
- March 6-9: -23.18%
- March 10-18: +32.69%
- March 19-22: -19.50%
- March 23-31: +12.31%
The NASDAQ isn't quite as strong during March as the S&P 500, likely due to a larger presence of growth stocks. The NASDAQ has produced annualized returns of 9.90% during March since 1971, ranking 8th out of the 12 calendar months.
Sector Performance
Last month, I said, "February is not a great month, but we do typically see seasonal strength in industrials (XLI), which has outperformed the benchmark S&P 500 by an average of 1.5 percentage points during February since 2012. The XLI has also outperformed the S&P 500 in February during 9 of the last 12 years, or 75% of the time."
The XLI did slightly outperform the S&P 500 last month, though both finished lower.
Moving into March, there's no question what sectors perform best. It's the defensive sectors. We've discussed many times that growth tends to take a back seat to value during the 2nd half of calendar months. So it should come as no surprise that March favors more defensive and value-oriented stocks.
Industry Performance
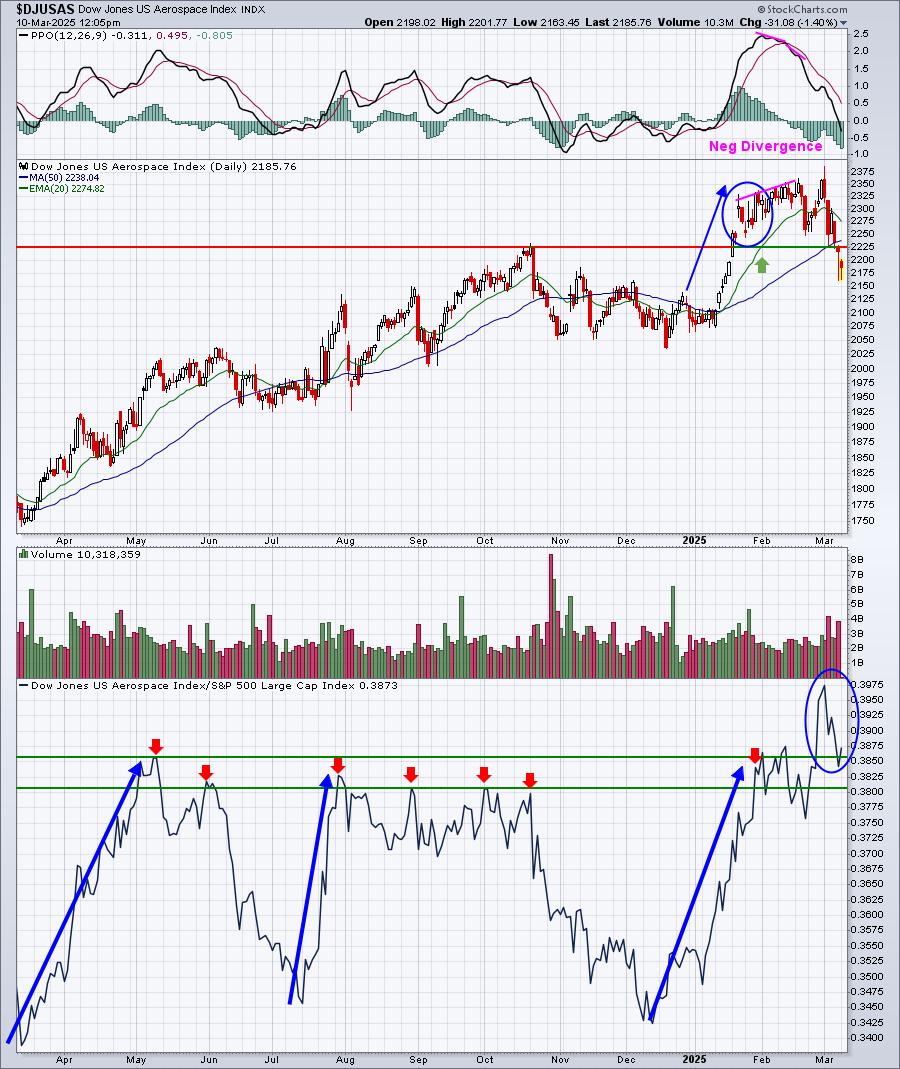
I highlighted aerospace ($DJUSAS) and defense ($DJUSDN) as areas that typically perform well during February. In particular, I liked aerospace as it looked better technically. Despite a lot of selling in February across most areas of the market, the DJUSAS did hold up well. An emerging negative divergence and a final false breakout derailed the group late in February:
So let's move on to March and focus on utilities (XLU), consumer staples (XLP), and real estate (XLRE). These 3 groups have shown consistent relative strength in March, outperforming the S&P 500 by 2.9%, 1.2%, and 1.0%, respectively, during this secular bull market (since 2013). The strongest industry group in all 3 sectors has been conventional electricity ($DJUSVE). It's a boring group, but boring can be good if the rest of the stock market struggles. Here's how the DJUSVE looks currently:
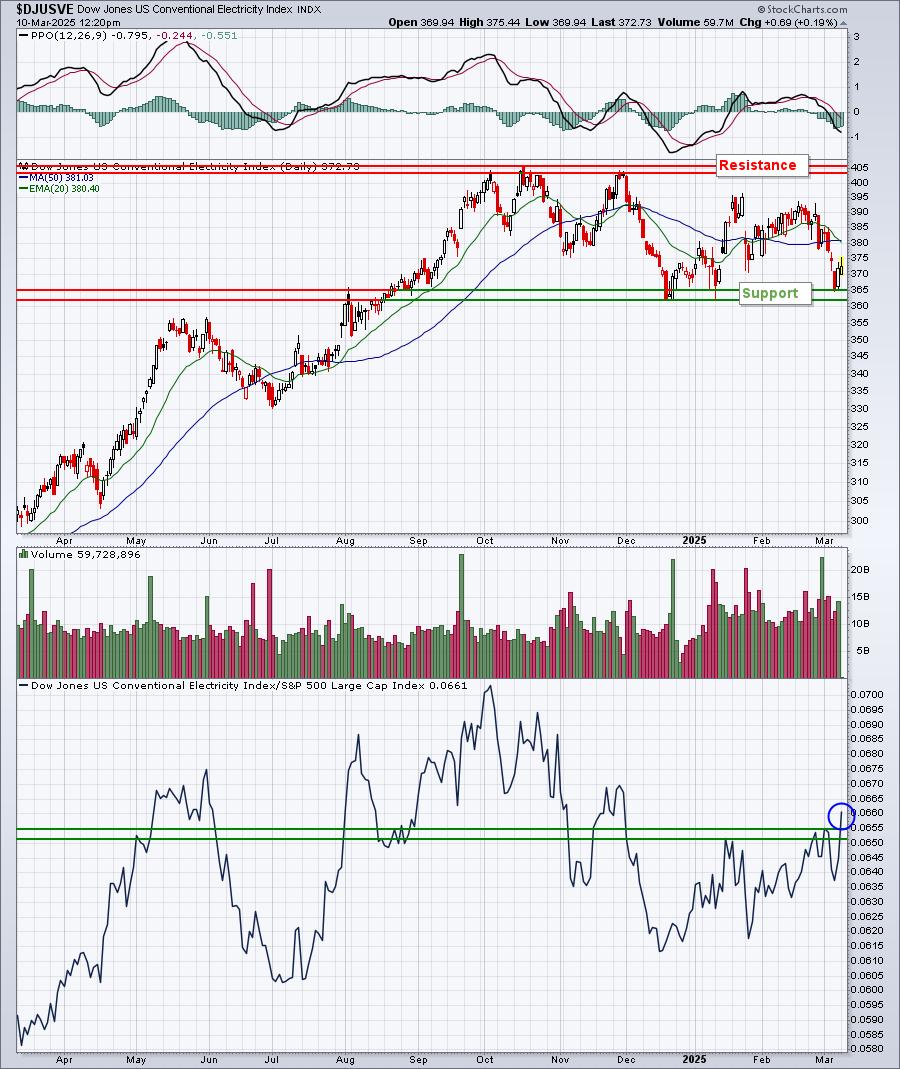
Utilities and conventional electricity got off to a weak start to March, but the latter is definitely strengthening in both absolute and relative terms. It's now trading at a 3-month plus relative high (blue circle). Also, the DJUSVE is now trading much closer to key support than it is to key resistance, providing a fairly strong reward-to-risk trade for those wanting to be in more defensive positions this month.
Here are all industry groups that tend to perform much better than the benchmark S&P 500 during March:
Technology (XLK):
- semiconductors, computer hardware, telecommunication equipment
Consumer Discretionary (XLY):
- broadline retailers
Communication Services (XLC):
- none
Industrials (XLI):
- waste & disposal services, delivery services, business support services
Financials (XLF):
- specialty finance
Health care (XLV):
- none
Consumer staples (XLP):
- food products, food retailers & wholesalers, nondurable household products, brewers, distillers & vintners
Real estate (XLRE):
- specialty REITs
Utilities (XLU):
- conventional electricity, multiutilities, gas distribution, water
Energy (XLE):
- none
Materials (XLB):
- gold mining, mining, steel
Stocks for March
We've selected our Top 20 seasonal stocks for March. Several names represent sectors and industry groups that have been discussed above. Others simply stand out in March based on their own historical track record. I apologize for the delay this month, but the good news is that many of the following stocks have been laggards in early March. We'll track these stocks (and the S&P 500 and NASDAQ 100), beginning from the Friday, March 7th close. Here are our Top 20 Seasonality stocks for March:
- LULU
- ANET
- CMG
- EQIX
- EPAM
- MPWR
- CTRA
- FSLR
- TPL
- STLD
- TTWO
- EQT
- NUE
- VST
- BLDR
- ULTA
- CAG
- WST
- EXR
- KDP
A "Seasonality - March 2025" ChartList (annotated with 1 or 2 support levels to watch) has been created and will be available for viewing/download later today or tomorrow. You must be a StockCharts.com Extra or Pro member to download our ChartLists. Basic members and non-StockCharts.com members can view the charts one at a time.
Happy trading!
Tom