
EB Monthly Seasonality - May 2025
A Look Back At April Stocks:
Last month, we released our list of the Top 20 stocks that had strong historical track records during the month of April. Here are how they performed in April 2025, in order of best to worst performer:
- MELI: +19.48%
- ALGN: +9.09%
- WAB: +1.87%
- HST: -0.63%
- AXP: -0.65%
- WMB: -1.99%
- TTD: -1.99%
- AMZN: -3.07%
- WYNN: -3.82%
- BLDR: -4.25%
- LULU: -4.34%
- EXPE: -6.64%
- SNA: -6.88%
- EQT: -7.47%
- PFG: -12.11%
- TRGP: -14.27%
- FANG: -17.43%
- DVN: -18.69%
- BKR: -19.45%
- CE: -21.54%
The percentages represent the returns from the March 31st close to the April 30th close. The average performance of all 20 stocks (-5.74%) badly lagged the S&P 500 (-0.87%) and the NASDAQ 100 (+1.40%). Our biggest April winner was MercadoLibre (MELI, +19.48%), a specialized consumer services stock ($DJUSCS). The poor performance of our April seasonal stocks was mostly attributable to a very weak energy group (XLE, -13.86%). We had four energy-related companies in our April seasonality list that took massive hits, BKR (-19.45%), DVN (-18.69%), FANG (-17.43%), and TRGP (-14.27%).
We saw a very, very weak start to April and then a significant rally off the April 7th low. Most stocks saw nice rebounds, but strength was definitely concentrated in Mag 7 and other growth stocks. April typically is led by areas outside technology, but it certainly was not in April 2025. Energy is normally a very strong April performer, as its average April return (+3.8%) during the current secular bull market (since 2013) outpaces every other month. Our concentration in energy stocks negatively impacted our cumulative results for April.
S&P 500 May Performance
The annualized performance of the S&P 500 (since 1950) during the month of May has been solid historically, but strength has been concentrated in the first and last weeks of the month. Since 1950, May has produced an annualized return of 3.49% on the S&P 500, which ranks 8th among all calendar months. Here's a breakdown of strong and weak performance periods throughout May on the S&P 500:
- May 1-5: +30.14%
- May 6-25: -11.11%
- May 26-31: +36.18%
The NASDAQ's May performance (+13.17%) has been much stronger than the S&P 500, likely due to a larger presence of growth stocks. Check out these two charts, the first showing QQQ vs. SPY relative outperformance since 2013 (during secular bull market) and the second showing excellent historical results in May for the influential semiconductor space ($DJUSSC):
QQQ vs. SPY
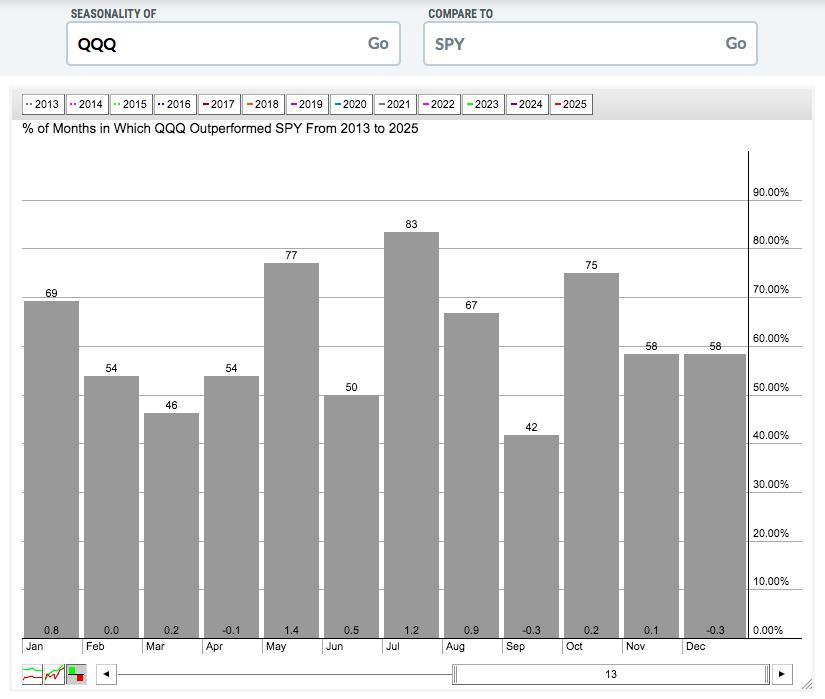
At the bottom of each calendar month, you'll find average May QQQ vs. SPY outperformance. May's is the highest.
$DJUSSC vs. SPY
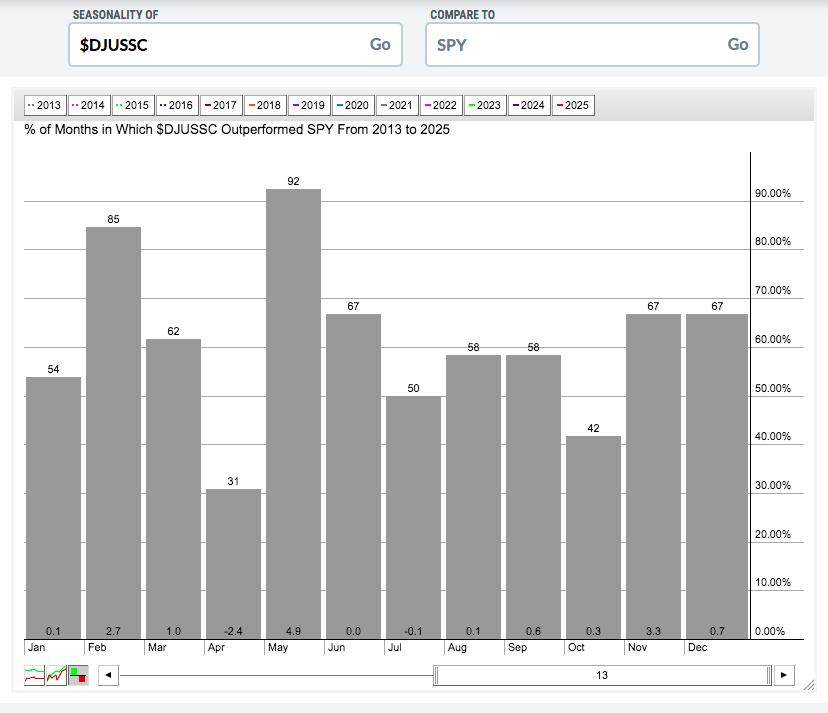
Semiconductors are an undisputed relative leader during May. They've outperformed the S&P 500 during 12 of the last 13 years in May. It's not a guarantee, but it's certainly bullish evidence for semis.
Sector Performance
Technology (XLK) loves May. Communication services (XLC) is also a solid May performer. Consumer stocks, both discretionary (XLY) and staples (XLP) have historically struggled during May. Technically, the XLK has a hurdle to jump - price resistance from its rebound high in latter March:
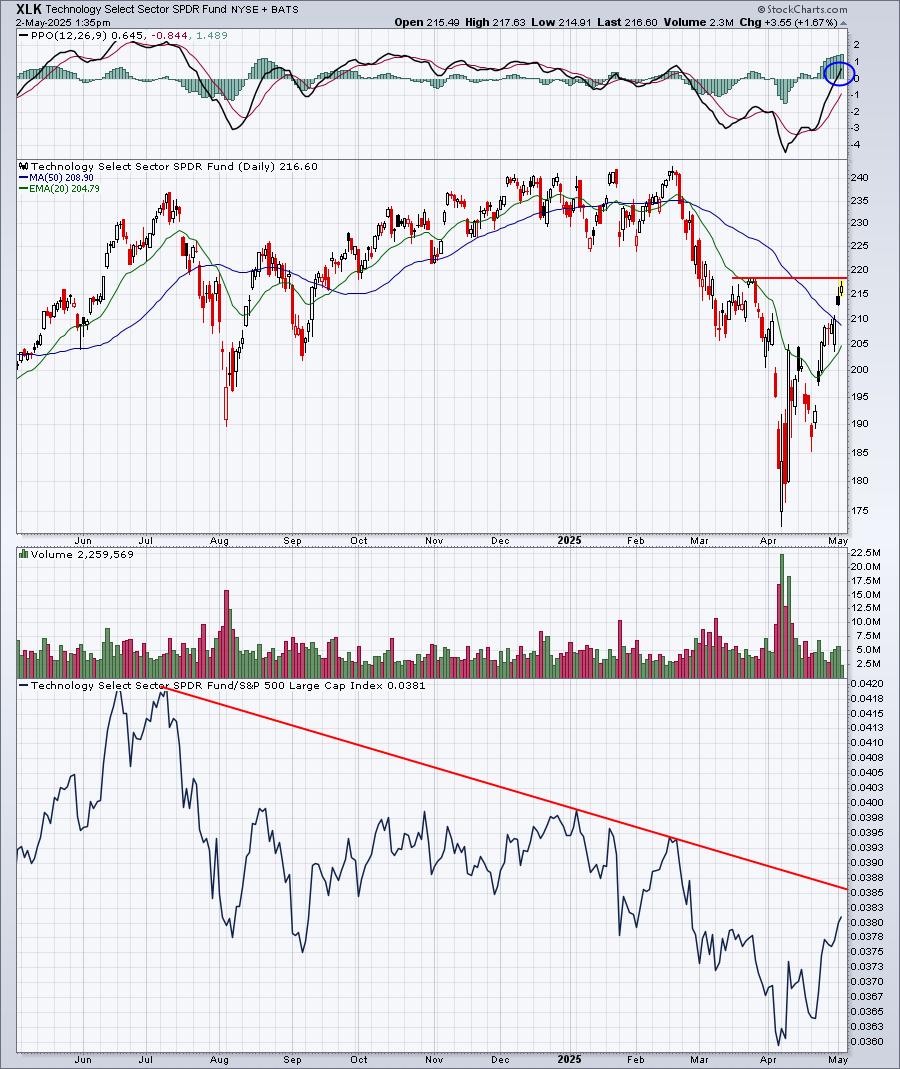
There are still plenty of issues on this chart, but we also need to acknowledge the improvements made in April. Keep in mind that the XLK represents 30% of the weighting on the S&P 500. Getting this sector right is very important to calling the overall market and to trading more successfully. We first need to respect the price resistance around 218-219. Many times, if we're likely to head higher down the road, we'll see a slight breach of price resistance, so perhaps the XLK trades up to 200-221 before pulling back. That's a possibility. Make no mistake about it, however. If the XLK can simply power through another very critical resistance level, further distancing itself from the early-April low, this chart turns VERY BULLISH.
Industry Performance
Let's look at technology stocks, where we've seen consistent relative outperformance during May in the past. Semiconductors ($DJUSSC), in my view, are absolutely the group to keep a very close eye on. When this group moves to the upside, it tends to be explosive. It's showing that tendency right now:
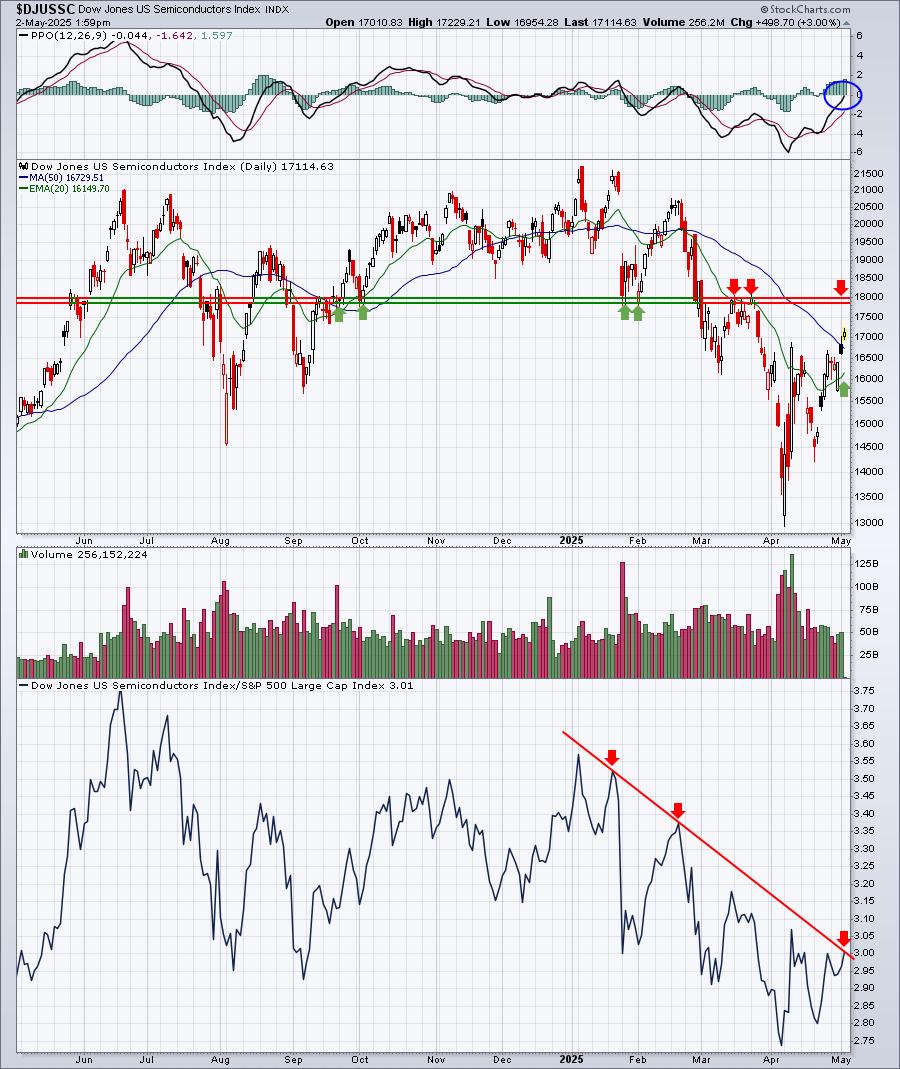
When you look at this chart, does it look like there's no chance we could go lower? I certainly wouldn't say that. I love the improvement, but there are still plenty of key areas to clear. But in a secular bull market, these levels are cleared and I expect this one to be no different eventually. The key word is "eventually".
What makes semiconductors so tricky is that this is the exact same group that would likely get hit the hardest during an extended trade war with China. So it's not like we should just buy the group, put it away, and not worry. The whipsaw possibilities are very real and every investor or trader needs to understand that. If you cannot stomach the risk of a fast-moving and volatile industry group, then consider investing in semiconductors using a more diversified approach, like trading the XLK, or even the QQQ, for instance. It's also important to understand how the stock market works. It prices in potential worries and uncertainties. That's why the S&P 500 bottoms when most investors and traders least expect it. It prices in the uncertainty at the very beginning of the uncertainty and finds a bottom and heads higher based on more bullish prospects 6-9 months out.
Here are all industry groups that tend to perform much better than the benchmark S&P 500 during March:
Technology (XLK):
- renewable energy, semiconductors, computer hardware
Consumer Discretionary (XLY):
- toys, tires
Communication Services (XLC):
- internet
Industrials (XLI):
- marine transportation, building materials & fixtures
Financials (XLF):
- mortgage finance, full line insurance, specialty finance, insurance brokers
Health care (XLV):
- health care providers, medical supplies
Consumer staples (XLP):
- none
Real estate (XLRE):
- none
Utilities (XLU):
- none
Energy (XLE):
- coal
Materials (XLB):
- none
Stocks for May
We've selected our Top 20 seasonal stocks for May. Several names represent sectors and industry groups that have been discussed above. Others simply stand out in May based on their own historical track record. Here are our Top 20 Seasonality stocks for May:
- CRWD
- CZR
- LYV
- TMUS
- AMD
- NVDA
- ENPH
- AVGO
- TTWO
- MCK
- EA
- MRVL
- NFLX
- ON
- HUM
- ALB
- REGN
- IT
- EPAM
- MU
A "Seasonality - May 2025" ChartList (annotated with 1 or 2 support levels to watch) will be created this weekend and will be available for viewing/download by early Monday morning. You must be a StockCharts.com Extra or Pro member to download our ChartLists. Basic members and non-StockCharts.com members can view the charts one at a time.
Happy trading!
Tom