
EB Monthly Seasonality Report - July 2025
A Look Back At June Stocks:
Last month, we released our list of the Top 20 stocks that had strong historical track records during the month of June. Here are how they performed in June 2025, in order of best to worst performer:
- ANET: +18.09%
- GNRC: +17.26%
- AVGO: +13.87%
- ZS: +13.87%
- MDB: +11.21%
- CSGP: +9.30%
- CRWD: +8.05%
- PANW: +6.35%
- PLTR: +3.45%
- OXY: +3.02%
- DXCM: +1.74%
- NOW: +1.68%
- VRTX: +0.71%
- EW: -0.01%
- DECK: -2.32%
- PODD: -3.34%
- TSLA: -8.31%
- PAYC: -10.69%
- LULU: -24.98%
- FTV: -25.73%
The percentages represent the returns from the May 31st close to the June 30th close. The average performance of all 20 stocks (+1.66%) was fairly solid, but weighed down significantly by two stocks, FTV and LULU, both of which tumbled roughly 25%. Collectively, our June group trailed the S&P 500 (+4.83%) and the NASDAQ 100 (+6.27%). Our biggest June winner was Arista Networks (ANET, +18.09%), a telecom stock ($DJUSCT), though Broadcom (AVGO, +13.87%) nearly pulled off the feat for the second month in a row.
Our major indices were able to push back to all-time highs by the end of June and that was certainly reflected in 13 of our 20 June seasonal stocks gaining ground, 5 of which gained 10% or more.
S&P 500 July Performance
The annualized performance of the S&P 500 (since 1950) during the month of July has been very strong historically. In fact, the May through July period has been the best 3-consecutive-calendar-month period over the past 10 years, even besting the historically strong 4th quarter, October through December.
Since 1950, July has produced an annualized return of 15.39% on the S&P 500, which ranks 4th among all calendar months. Here's a breakdown of strong and weak performance periods throughout July on the S&P 500 (NASDAQ performance since 1971 is in parenthesis):
- July 1-17: +26.53% (+32.73%)
- July 18-23: -16.61% (-34.93% and this period includes July 24th)
- July 24-31: +18.97% (+6.42% and this period excludes July 24th)
The NASDAQ's July performance shows that it tends to exceed that of the S&P 500 over the first half of July, but tends to be weaker in the 2nd half, which is after earnings season starts. Over the past 12 years, however, and during this current secular bull market advance since 2013, the NASDAQ is in its sweet spot vs. the S&P 500, at least as far as the NASDAQ 100 goes. Check out this relative seasonality chart between the NASDAQ 100 and the S&P 500:
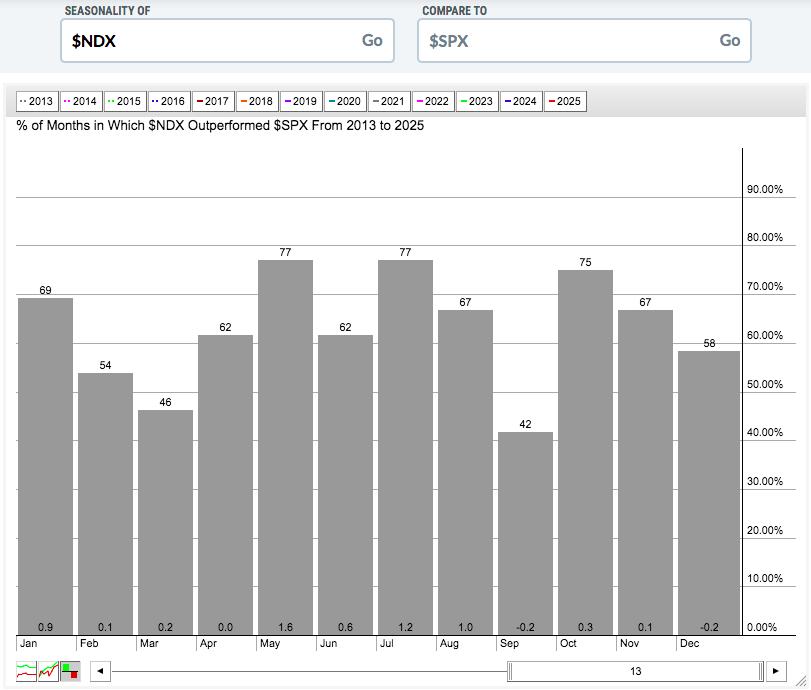
The relative outperformance of the NASDAQ 100 vs. the S&P 500 can be summarized as follows:
- May through August: +4.4%
- September through April: +1.2%
The NASDAQ 100's relative strength since 2013 has occurred almost exclusively in the May to August timeframe, and we're squarely in the middle of this timeframe right now.
It'll be interesting to see if this recent relative summer strength in NASDAQ 100 shares continues to hold true through August. Here's the relative strength of the NASDAQ 100 vs. the S&P 500 just in 2025 so far:
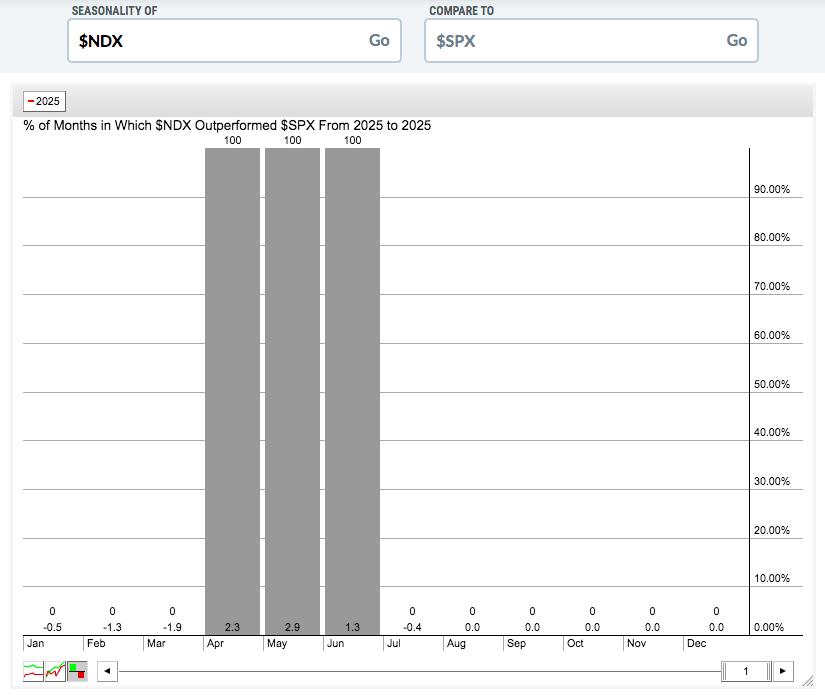
Anyone following the "Go Away in May" hype train that media outlets routinely promote? I'm telling you, the media is literally the devil. July's NASDAQ 100 relative performance is down thus far vs. the S&P 500, but we're only 3 days in. April, May, and June all produced much better results on the more growth-oriented NASDAQ 100 and that would not happen if Wall Street was anticipating another push higher in inflation. Again, this type of signal comes from the charts and relative performance and absolutely nothing from the media or "news".
Sector Performance
Nearly all historical relative strength in July comes from the aggressive sectors, especially since the secular bull market began in 2013. Consumer discretionary (XLY) was featured last month as it typically performs very well in June and July. It performed well, but technology (XLK) performed much better and that sets this group up for more strength in the next two months. Technology's strength in July and August is more than double any other sector since this secular bull market began. After breaking out of a long-term base, I am a strong believer that we're going to see more absolute and relative strength in technology down the road:
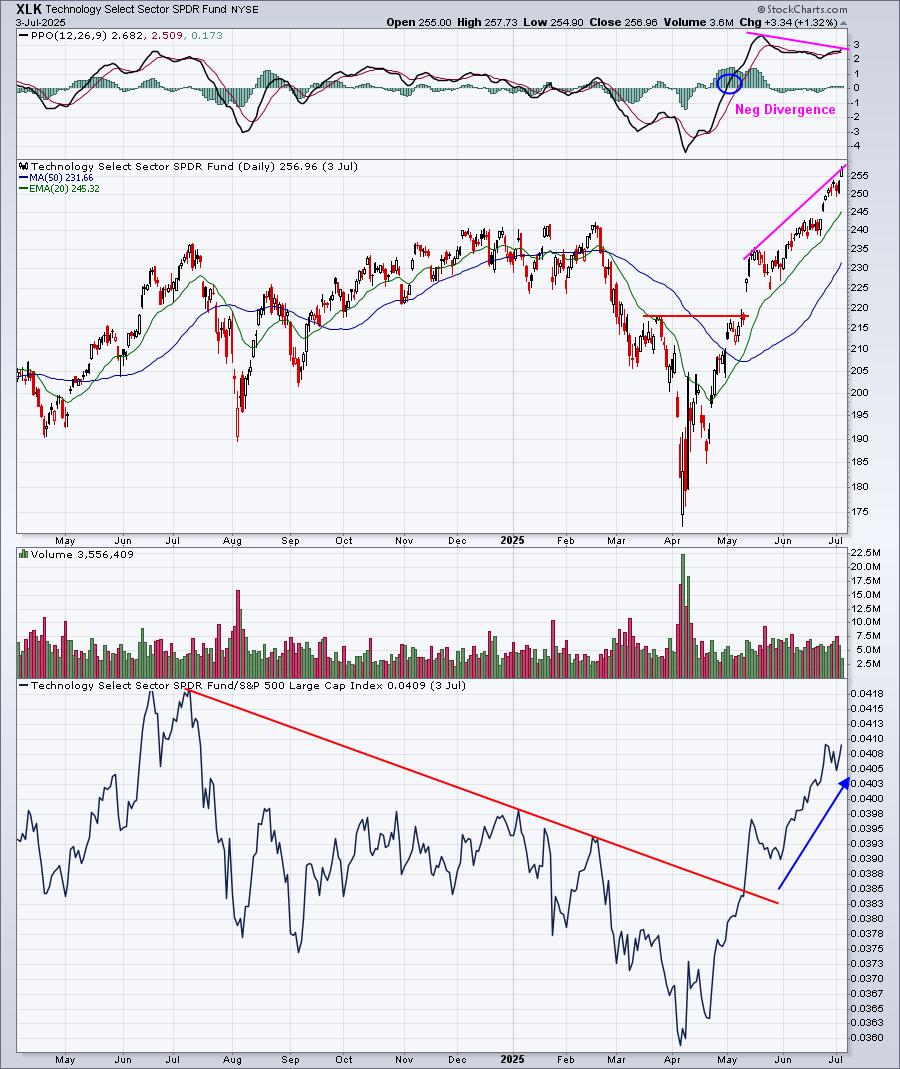
The May annotations were provided two months ago, showing key absolute and relative price levels to watch on the XLK chart. After clearing those levels, technology easily became the leading sector.
Now I would be remiss if I didn't mention the negative divergence on the XLK. Clearly, from technical analysis 101, we should look at this as a potential short-term warning sign as it appears that upside momentum is slowing. However, the bottom panel shows that the XLK:$SPX ratio is once again moving to a new high. So my question would be, can a sector truly be losing momentum while leading the S&P 500 on a relative basis? That latter point would indicate renewed strength, wouldn't it?
I don't think we can totally ignore a negative divergence, but I would keep in mind that these divergences are secondary to price action, which is always my #1 indicator.
Industry Performance
Let's talk historical technology strength, where computer hardware ($DJUSCR) has excelled in the past. From the following seasonality chart, you can see that the DJUSCR absolutely LOVES the months of July and August:
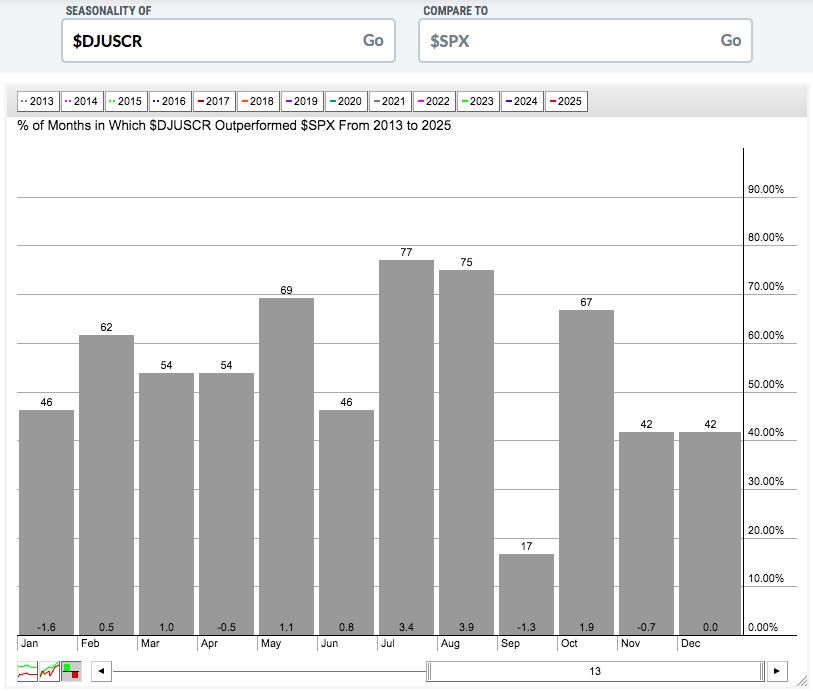
It appears the July strength has already begun to kick in:
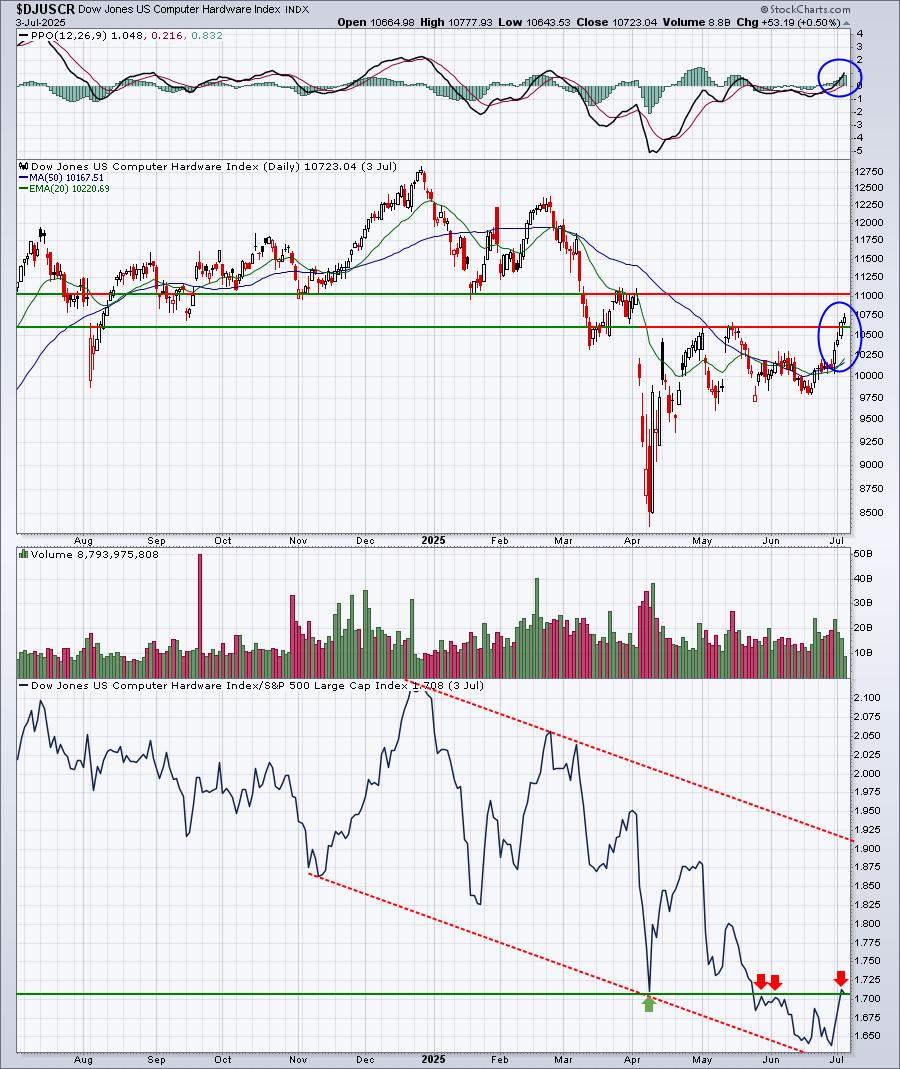
There's still a TON of potential upside left on this chart and the group's largest stock, Apple, Inc. (AAPL), was mentioned recently as a potential "run into earnings" candidate. I really like AAPL and this group over the next couple months.
Here are all industry groups that tend to perform much better than the benchmark S&P 500 during July:
Technology (XLK):
- renewable energy, electrical components & equipment
Consumer Discretionary (XLY):
- automobiles, recreational products, business training & employment agencies, broadline retailers, home construction
Communication Services (XLC):
- internet
Industrials (XLI):
- trucking, building materials & fixtures, delivery services
Financials (XLF):
- specialty finance, mortgage finance, financial administration, investment services
Health care (XLV):
- biotechnology
Consumer staples (XLP):
- food retailers & wholesalers, general retailers
Real estate (XLRE):
- real estate services, industrial & office REITs
Utilities (XLU):
- water
Energy (XLE):
- none
Materials (XLB):
- steel, paper
Stocks for July
A "Seasonality - July 2025" ChartList (annotated with 1 or 2 support levels to watch) has been created and will be added to our website this weekend. Below are the seasonal stocks for July 2025:
CARR, MRNA, ISRG, AMGN, IQV, AAPL, GNRC, ODFL, PYPL, DASH, ANET, CF, FITB, PANW, KKR, KLAC, AMZN, IDXX, MSCI, BX.
You must be a StockCharts.com Extra or Pro member to download our ChartLists. Basic members and non-StockCharts.com members can view the charts one at a time.
Happy trading!
Tom