
EB Monthly Seasonality Report - September 2025
A Look Back At August Stocks:
Last month, we released our list of the Top 20 stocks that had strong historical track records during the month of August. Here are how they performed in August 2025 (through Friday, August 29th at noon), in order of best to worst performer:
- DAY: +20.69%
- HUM: +20.52%
- PODD: +17.42%
- AAPL: +12.32%
- INCY: +12.02%
- EPAM: +11.13%
- ANET: +10.29%
- BLDR: +9.27%
- MTCH: +8.67%
- NFLX: +3.98%
- MELI: +3.42%
- BKNG: +1.92%
- WDAY: -0.29%
- CRM: -1.63%
- NVDA: -1.74%
- PAYC: -2.36%
- CRWD: -5.85%
- DXCM: -7.00%
- AMD: -7.33%
- VST: -10.07%
The percentages represent the returns from the July 31st close to the August 29th intraday price around noon ET. The average performance of all 20 stocks (+4.77%) was quite strong relative to our major indices. Collectively, our August group more than doubled the S&P 500 (+1.91%) for the 2nd straight month and performed even better relative to the NASDAQ 100 (QQQ, +0.88%). Our biggest August winner was Dayforce, Inc. (DAY), a business support services company ($DJUSIV), while Humana, Inc. (HUM), a health care provider ($DJUSHP), was a 2nd stock that gained over 20% during the month of August. HUM ended the month approaching an 11-month high that was established near 310 in November 2024.
The S&P 500 got off to a very rough start in August, but rebounded throughout the balance of the month. Still, our seasonally-strong ChartList for August did its job, collectively beating both the S&P 500 and NASDAQ 100 by a wide margin.
S&P 500 September Performance
The annualized performance of the S&P 500 (since 1950) during the month of September has been much more bearish than any other calendar month historically. We know that the May through July period has been our best 3-consecutive-month period over the past 10 years. The worst 3-consecutive-month period over the past 10 years? August-September-October. Check out this seasonal chart on the S&P 500:
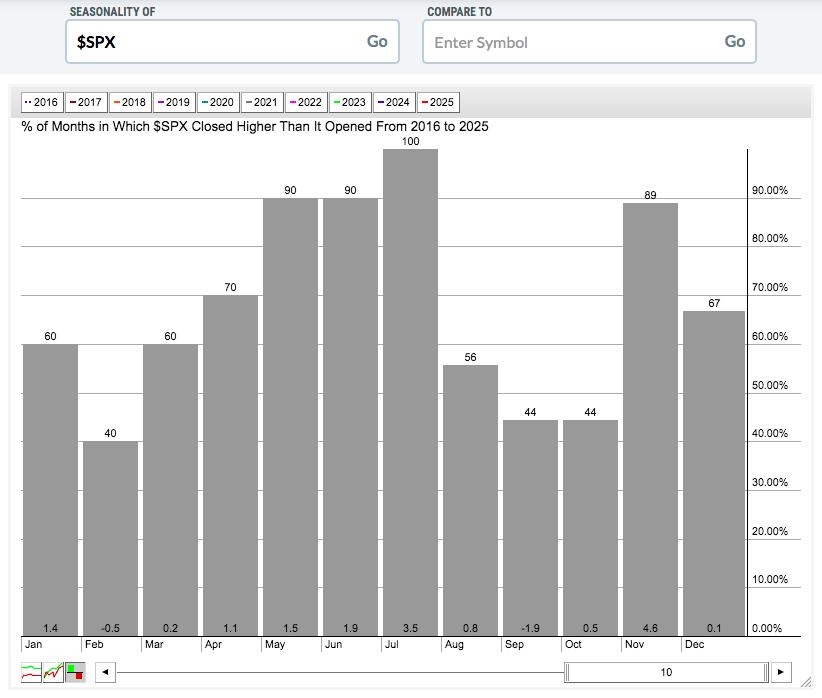
We should lower our market expectations over the next few months - at least based upon recent history. August 2025 proved to be ok after that ugly start to the month, but what will September hold in store? Again, let's keep our expectations lowered until we move into the much more bullish Q4, especially once earnings season begins in mid-October. Since 1950, the absolute-best period to be invested in the S&P 500 is from the close on October 27th through the close on January 18th. We're not that far away, so patience will be important if we do see some deterioration in price action between now and then.
Since 1950, September has produced an annualized return of -8.06% on the S&P 500, which ranks dead last among all calendar months and no other calendar month is close. Here's a breakdown of the historically strong and weak performance periods throughout September on the S&P 500:
- September 1-3: +27.26%
- September 4-10: -15.13%
- September 11-16: +24.48%
- September 17-19: -6.26%
- September 20-26: -43.09%
- September 27-30: -9.51%
September is also the tale of 2 half months. The second half of September historically has been the real problem, as you can see from the following:
- September 1-16: +7.97%
- September 17-30: -25.63%
After checking out these numbers, hopefully you can see why it makes sense to lower our expectations. This is data that goes back 75 years. We're not talking about the last few years or the last 10 years. This is representative of over seven decades. We need to understand this. Not every September finishes lower and maybe 2025 will be a year in which September gains ground. Just please be aware of the strong bearish tendencies.
Sector Performance
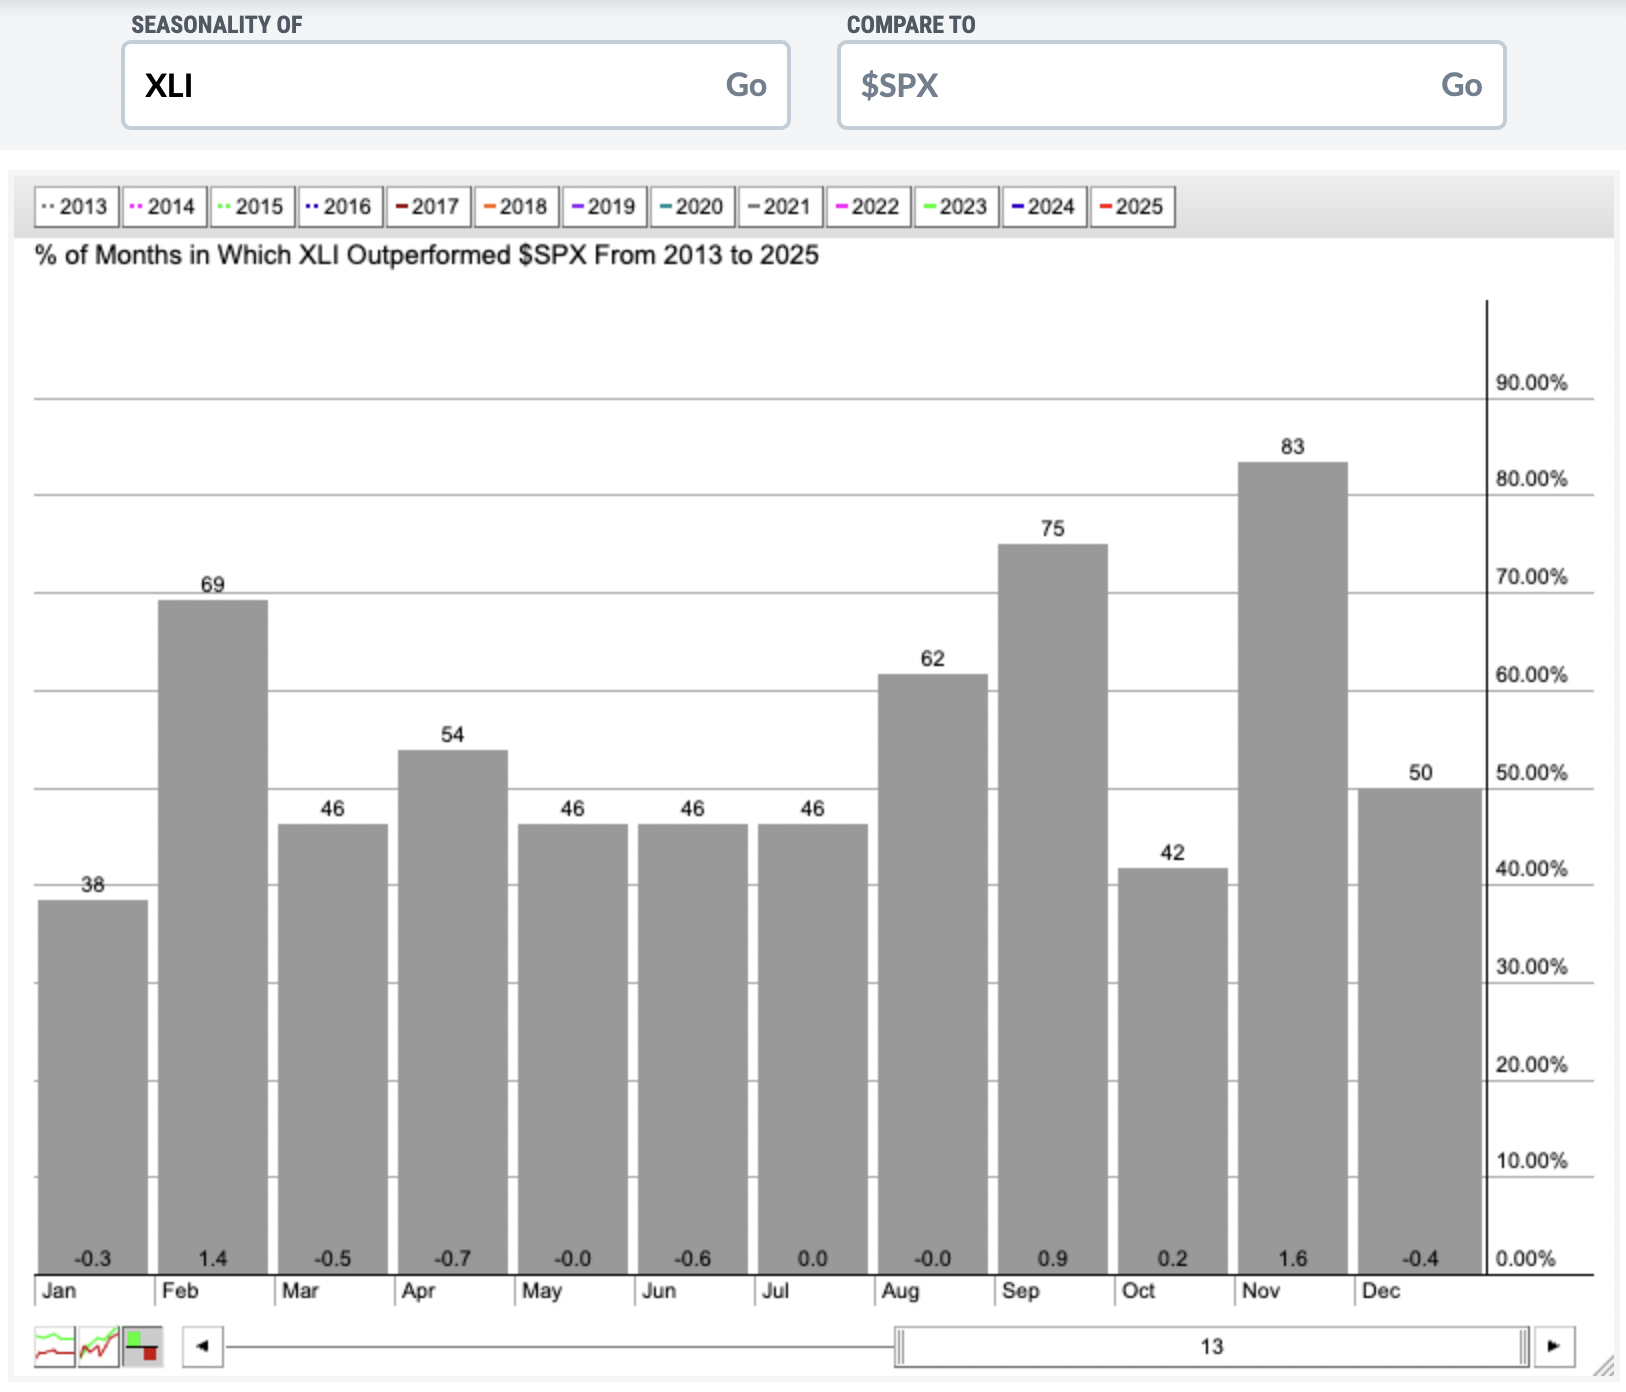
Industrials (XLI) begin to show relative strength in September that continues right through November (though October shows only modest relative strength). Check out this seasonality chart since the bull market was confirmed in 2013:
Technically, the XLI is quite strong so the prospects for leadership over the next few months in this area in 2025 are quite good:
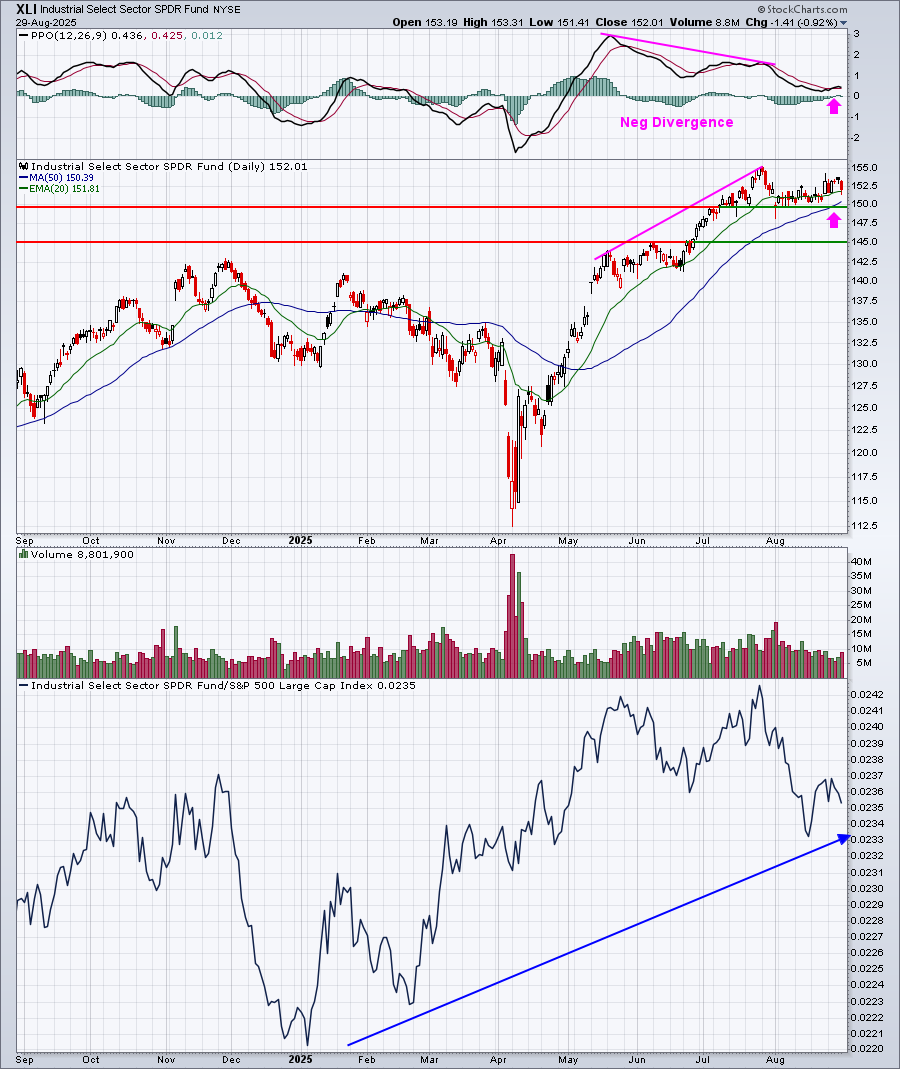
The negative divergence in the XLI has resulted in some recent weakness and we're nearly at a PPO centerline reset and 50-day SMA test (pink arrows). I see just below 150 being excellent price support, but in the event that support level is lost, I would certainly expect the next key price support level at 145 to hold.
Industry Performance
There were a number of industry groups within industrials that love the month of September, but none more than airlines ($DJUSAR), which boasts a very strong historical track record for the months of September, October, and November. Check out this seasonal chart:
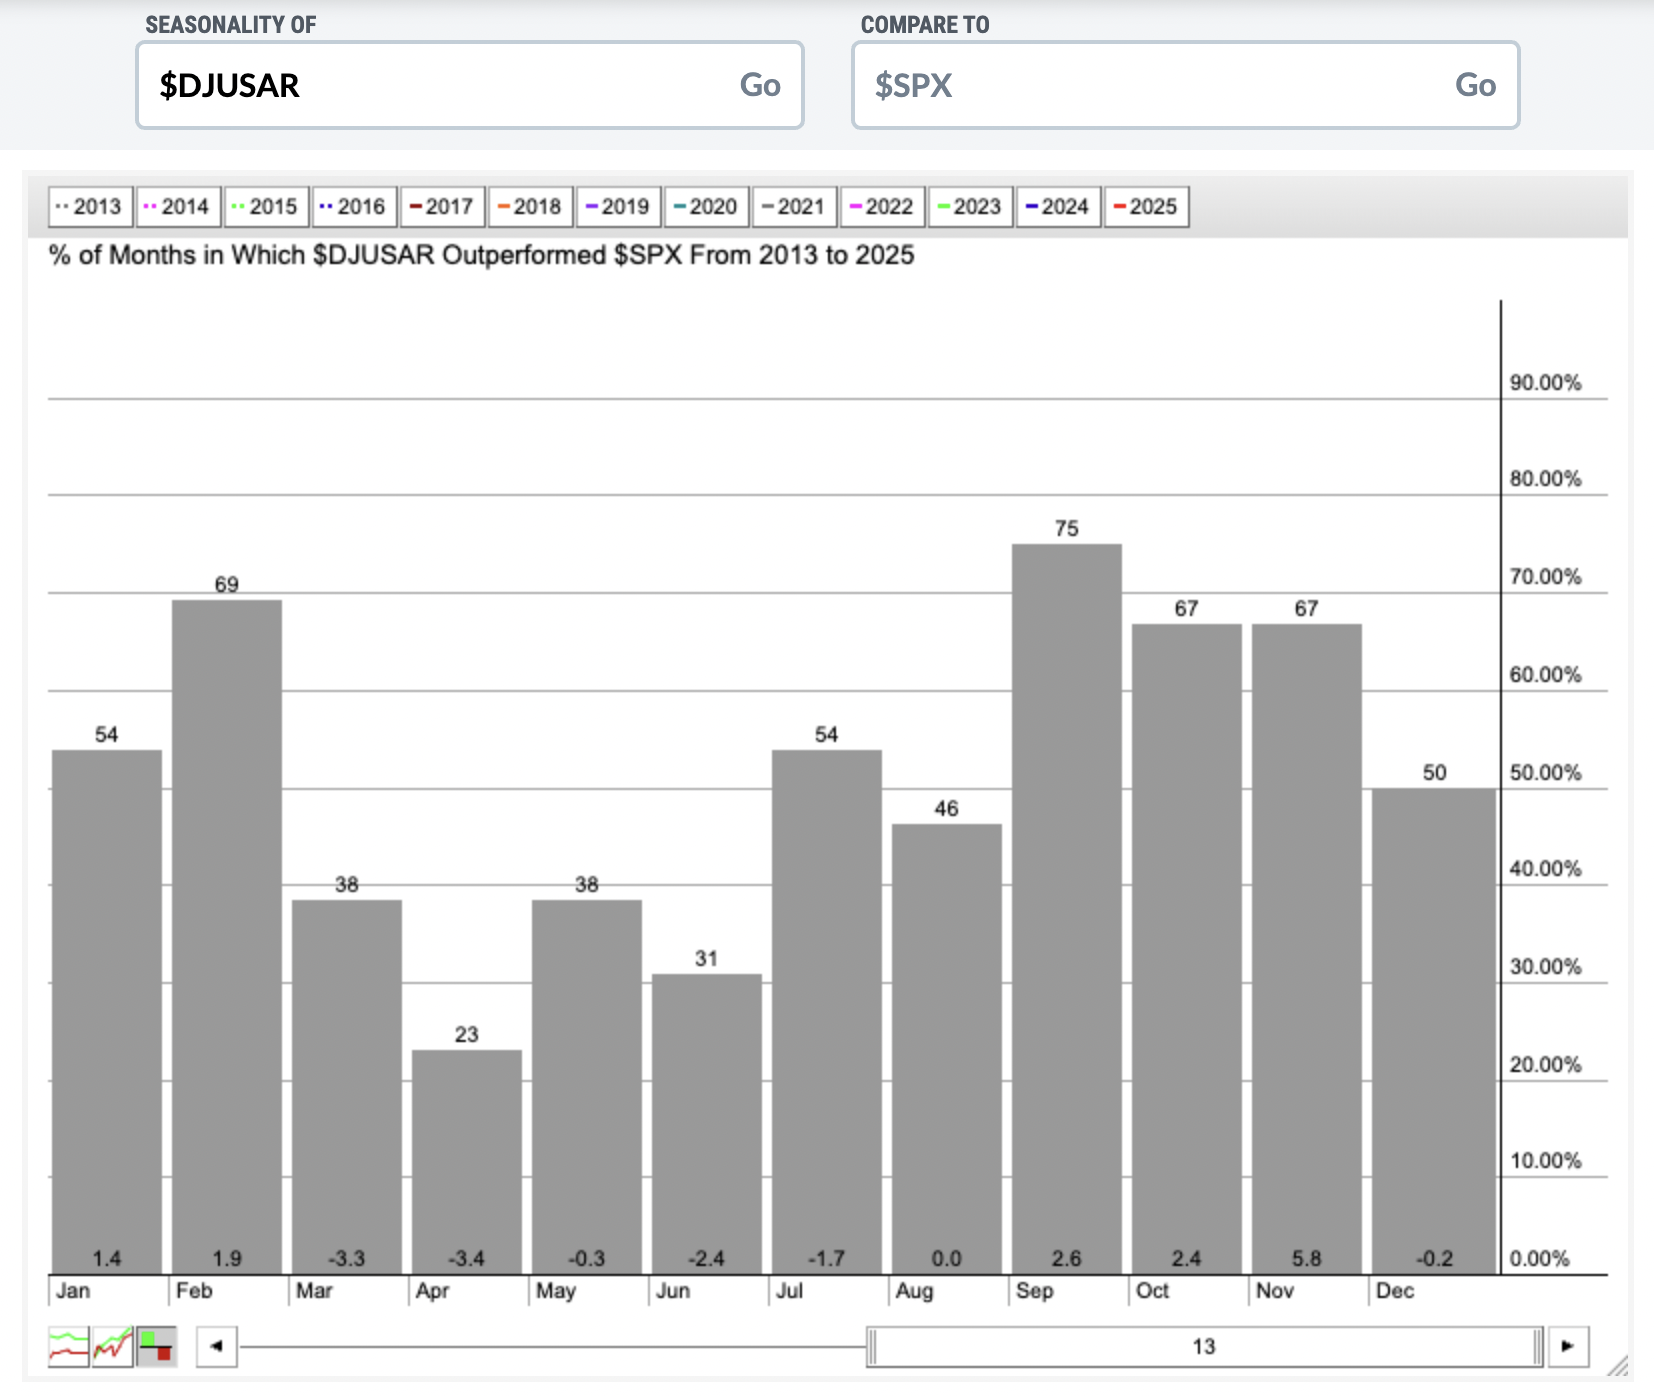
This seasonality chart shows the DJUSAR relative performance vs. the benchmark S&P 500. September actually begins a 6-month stretch, through February, where airlines perform exceptionally well. In fact, check out the relative performance of airlines for each of the following 6-month periods since 2013:
- March through August: -11.1%
- September through February: +13.9%
I don't understand why this occurs, but it's one of the most fascinating historical facts that I've come across.
Technically, airlines are now showing strength as they head into their strong seasonal 6-month period:
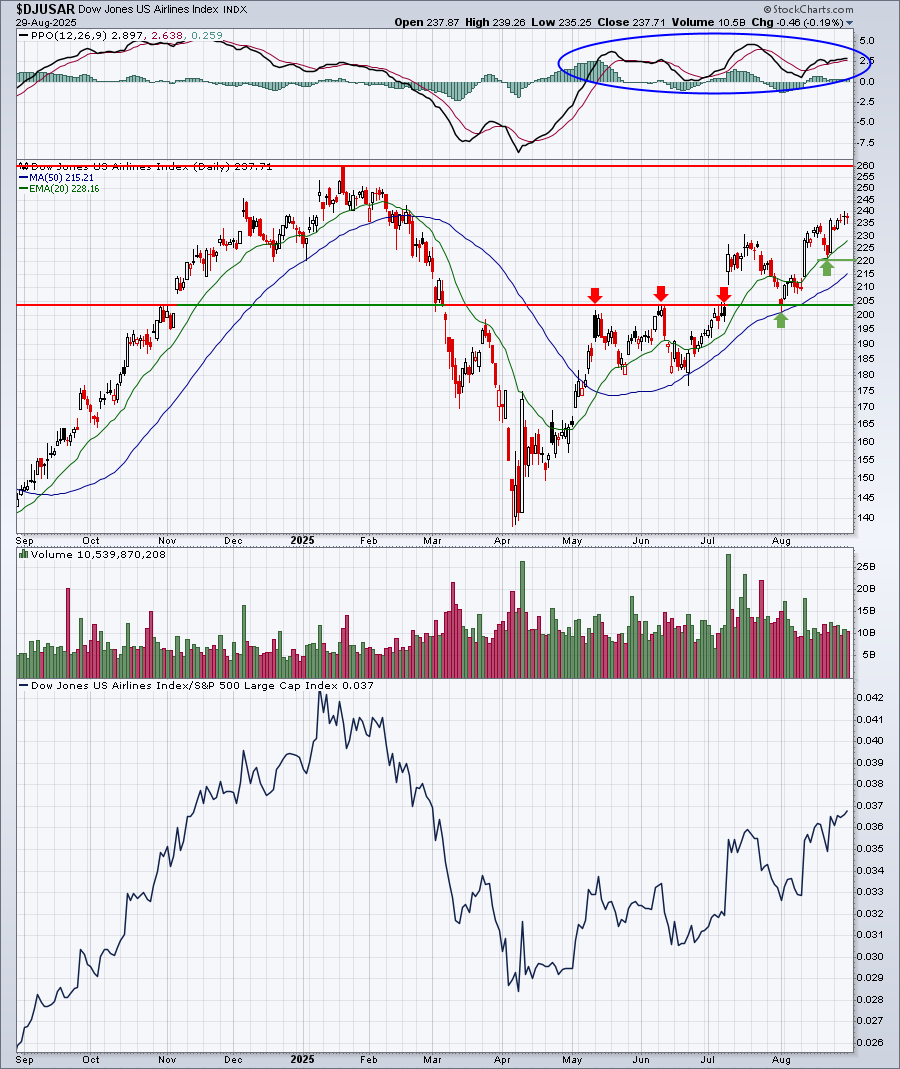
Seasonality doesn't provide us any sort of guarantee, but it sure does provide us interesting seasonal tendencies.
Here are all industry groups that tend to perform much better than the benchmark S&P 500 during September, broken down by sector:
Technology (XLK):
- none
Consumer Discretionary (XLY):
- footwear, tires, recreational products, home improvement, hotels, restaurants & bars, automobiles
Communication Services (XLC):
- fixed line telecommunications, media agencies
Industrials (XLI):
- airlines, defense, heavy construction, railroads, industrial suppliers, trucking, commercial vehicles & trucks
Financials (XLF):
- insurance brokers, life insurance, property & casualty insurance
Health care (XLV):
- none
Consumer staples (XLP):
- brewers, distillers & vintners, food retailers & wholesalers
Real estate (XLRE):
- none
Utilities (XLU):
- none
Energy (XLE):
- exploration & production, integrated oil & gas
Materials (XLB):
- none
Stocks for September
A "Seasonality - September 2025" ChartList (annotated with 1 or 2 support levels to watch) has been created and will be added to our website this weekend.
You must be a StockCharts.com Extra or Pro member to download our ChartLists. Basic members and non-StockCharts.com members can view the charts one at a time.
Happy trading!
Tom