
EB Monthly Seasonality - November 2025
A Look Back At October Stocks:
Last month, we released our list of the Top 20 stocks that had strong historical track records during the month of October. Here are how they performed in October 2025, in order of best to worst performer:
- GOOGL: +15.67%
- GM: +13.32%
- PLTR: 9.89%
- LW: +6.28%
- COIN: +1.86%
- MPC: +1.13%
- DAL: +1.11%
- LDOS: +0.80%
- GNRC: +0.37%
- CBOE: +0.16%
- PSX: +0.09%
- UAL: -2.55%
- NDAQ: -3.35%
- NFLX: -6.68%
- APO: -6.72%
- TYL: -8.96%
- PAYC: -10.11%
- ICE: -13.17%
- MSTR: -16.36%
- FFIV: -21.70%
The percentages represent the returns from the September 30th close to the October 31st close. The average performance of all 20 stocks (-1.95%) was weak relative to our major indices. Collectively, our October seasonal group trailed the S&P 500 (+2.38%) and performed even worse relative to the NASDAQ 100 (QQQ, +4.78%). Our biggest October winner was Alphabet (GOOGL), an internet company ($DJUSNS), which showed excellent relative strength vs. its peers before posting better-than-expected earnings. Check this out:
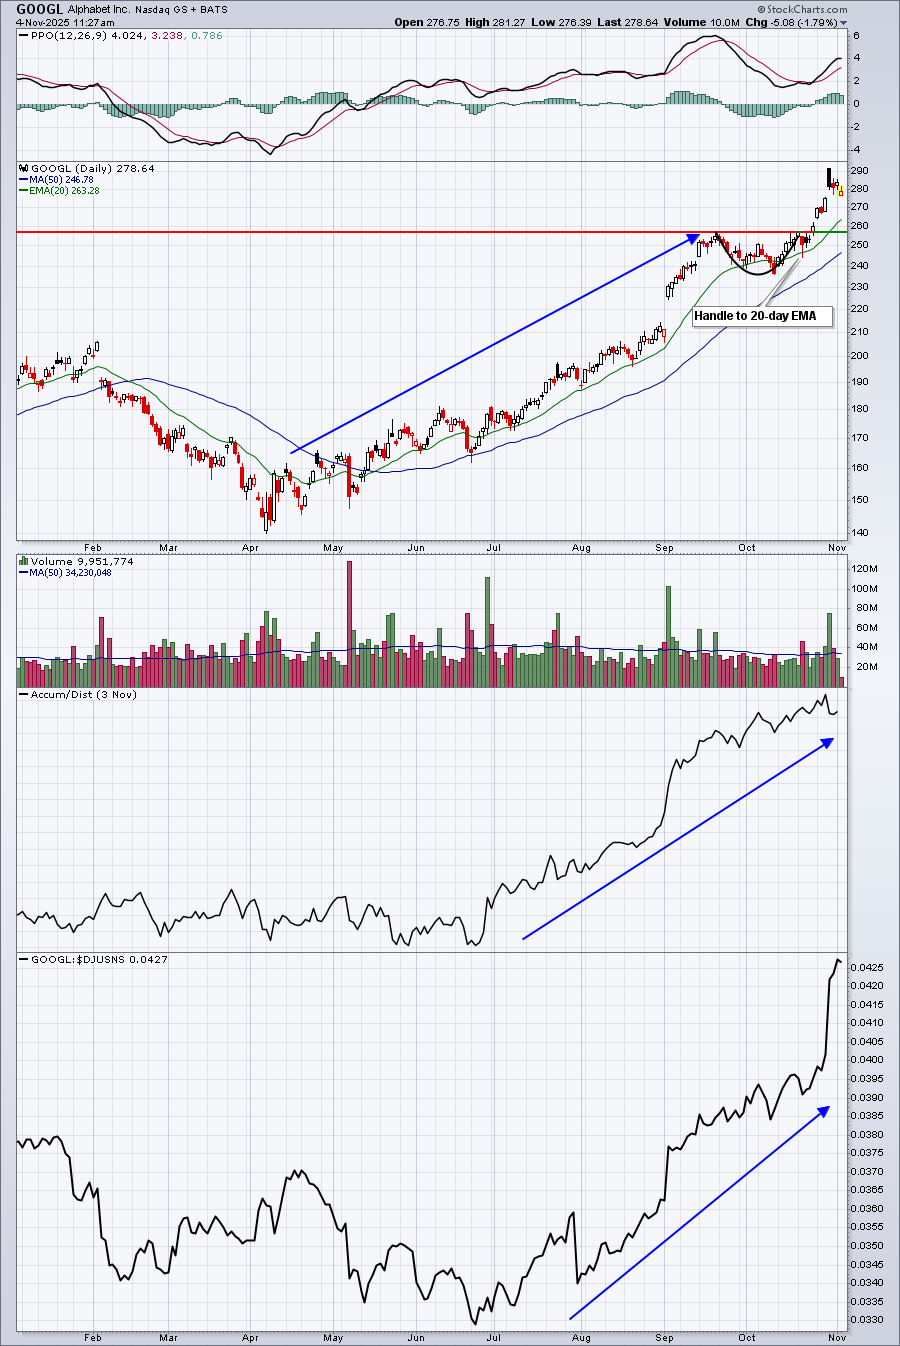
While GOOGL had an exceptional October, printing and then breaking out of a bullish cup with handle pattern, our overall group didn't perform well as a whole. Hopefully, our November group will see better results.
S&P 500 November Performance
The annualized performance of the S&P 500 (since 1950) during the month of November is exceptionally strong. Check out this seasonal chart on the S&P 500:
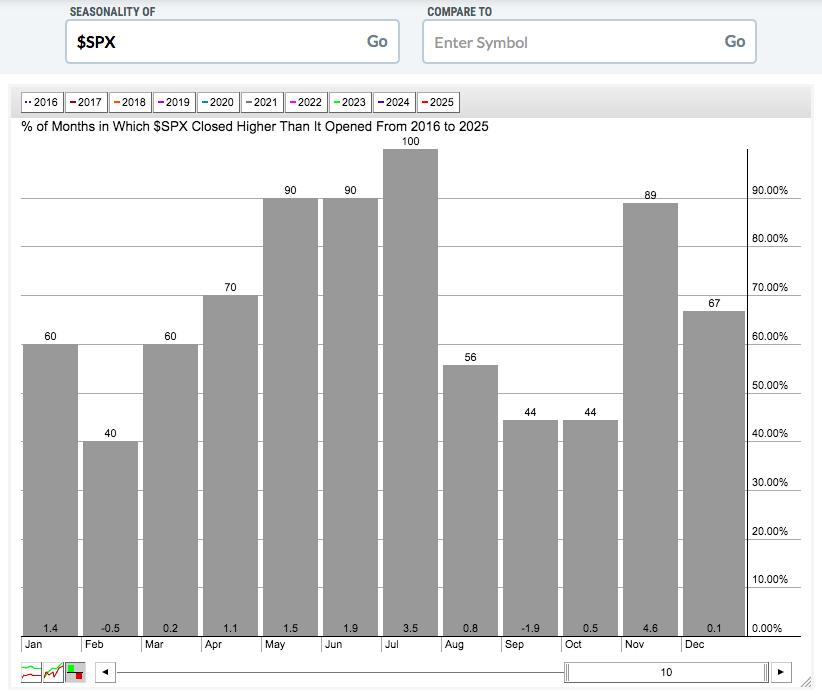
Remember, this is historically the absolute best period of the year to be invested in the S&P 500. The close on October 27th through the close on January 18th is the best 2+ month period, dating back to 1950. It's closed higher than it began 65 of the last 75 years. That's a very strong historical track record. The annualized return of this period is +21.72%, more than double the average annual return of 9% of the S&P 500 over the same 75-year period.
Since 1950, November has produced an annualized return of +22.32% on the S&P 500, which easily ranks 1st among all calendar months. Here's a breakdown of the historically strong and weak performance periods throughout November on the S&P 500:
- November 1-5: +70.39%
- November 6-9: -2.05%
- November 10-13: +22.97%
- November 14-20: -15.75%
- November 21-30: +42.22%
Seasonality is definitely no guarantee. It's nothing more than a tendency and it should be viewed as such. We just experienced a strong September, despite historical September headwinds. The worst week of the year, from the October 21st close through the October 27th close, ended higher in 2025. Now we're in a very bullish part of the year and we're seeing some difficulty in pushing prices higher, especially on the small cap IWM.
When bullish seasonal tendencies line up and corroborate a bullish technical view, that provides me more confidence for a trade - again, no guarantee.
Sector Performance
November is strong for a number of areas of the market. For instance, discretionary (XLY) has risen during November in each of the last 10 years. Industrials (XLI), financials (XLF), and technology (XLK) have dropped during November only once since the secular bull market was confirmed in April 2013. Aggressive groups tend to perform very well. Since I featured the XLF in October, I'll take a look at industrials (XLI) for November. Technically, the XLF has performed better than the XLI in November, but not by much.
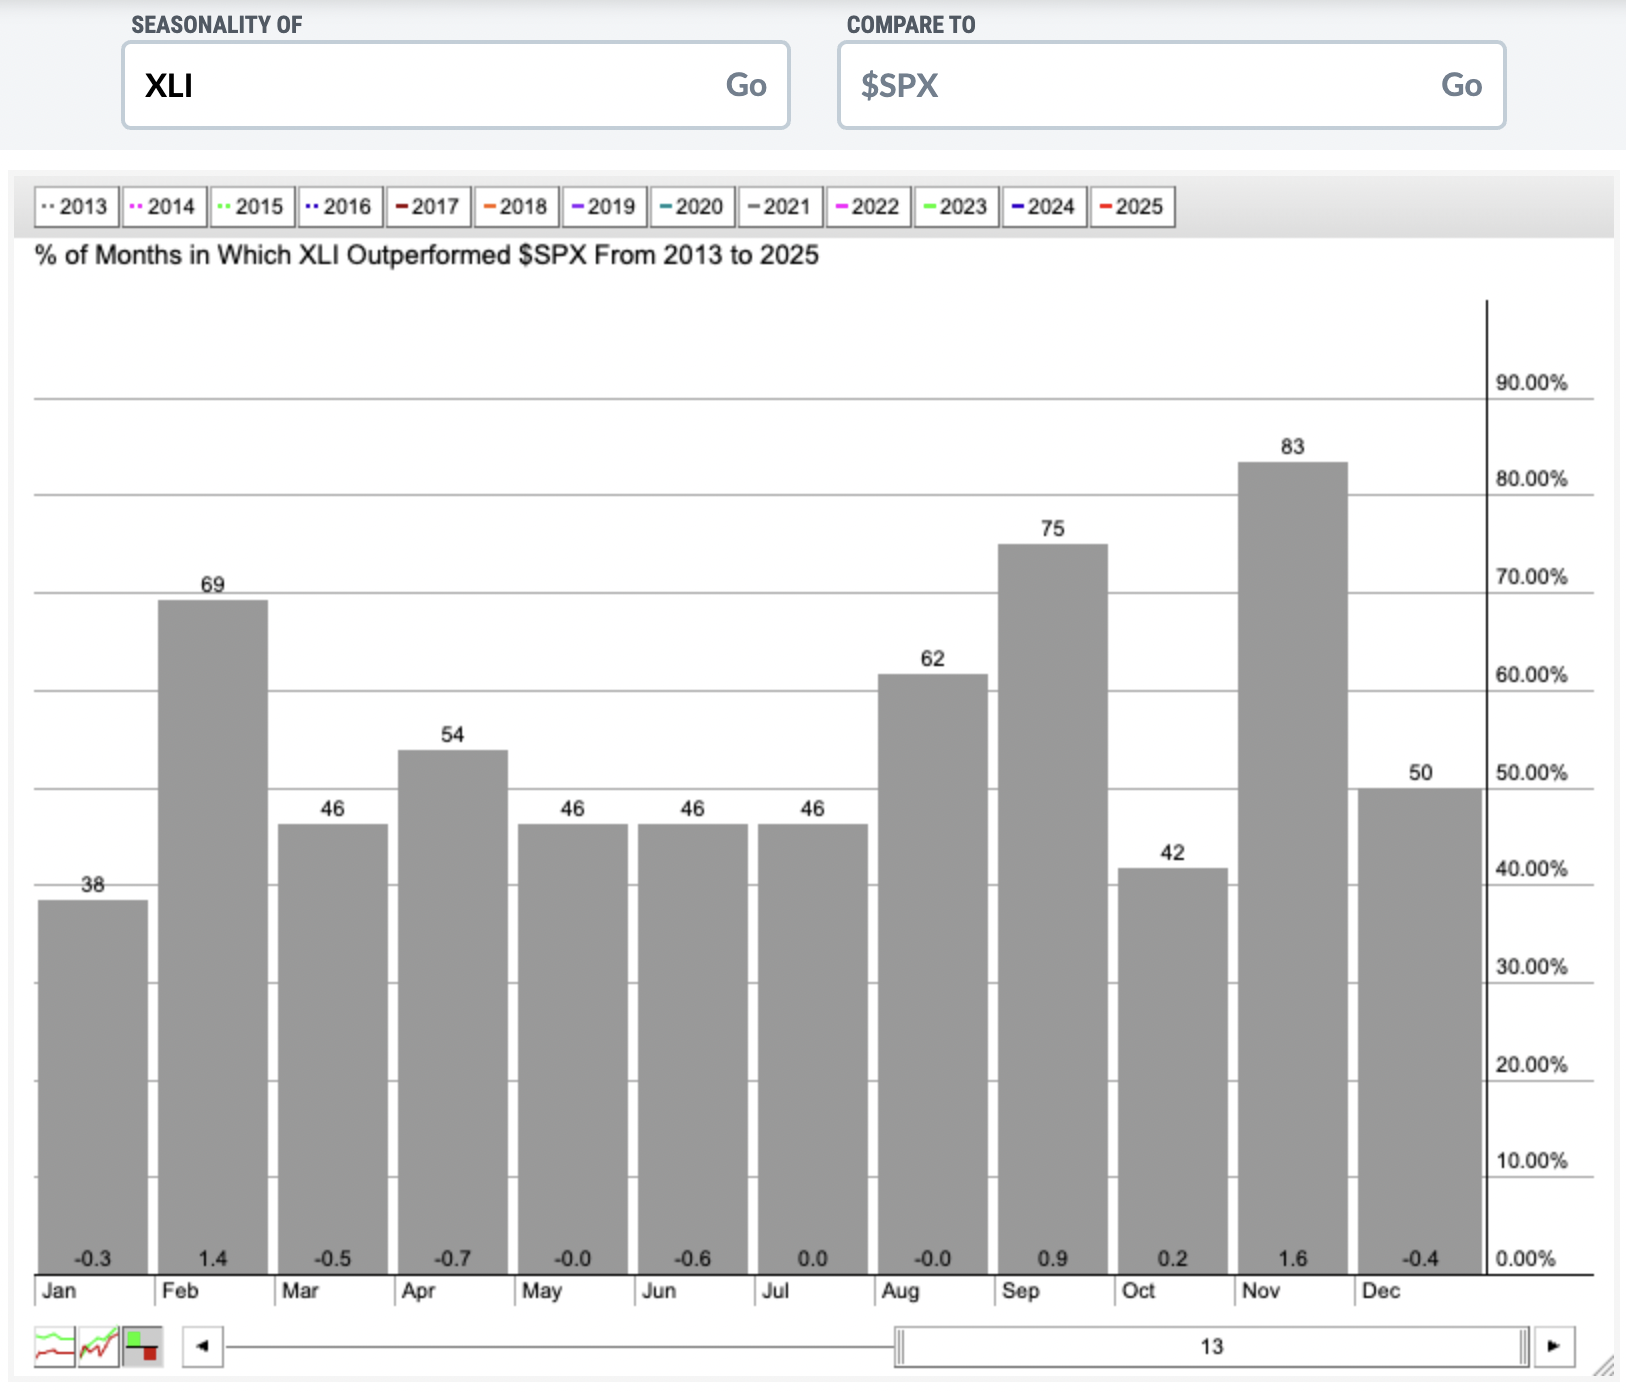
The XLI's best relative performance, by calendar month, is during November, followed closely by February. Technically, the XLI remains in a solid uptrend, so there's little reason to believe that the XLI isn't heading higher. Check out the current technical view:
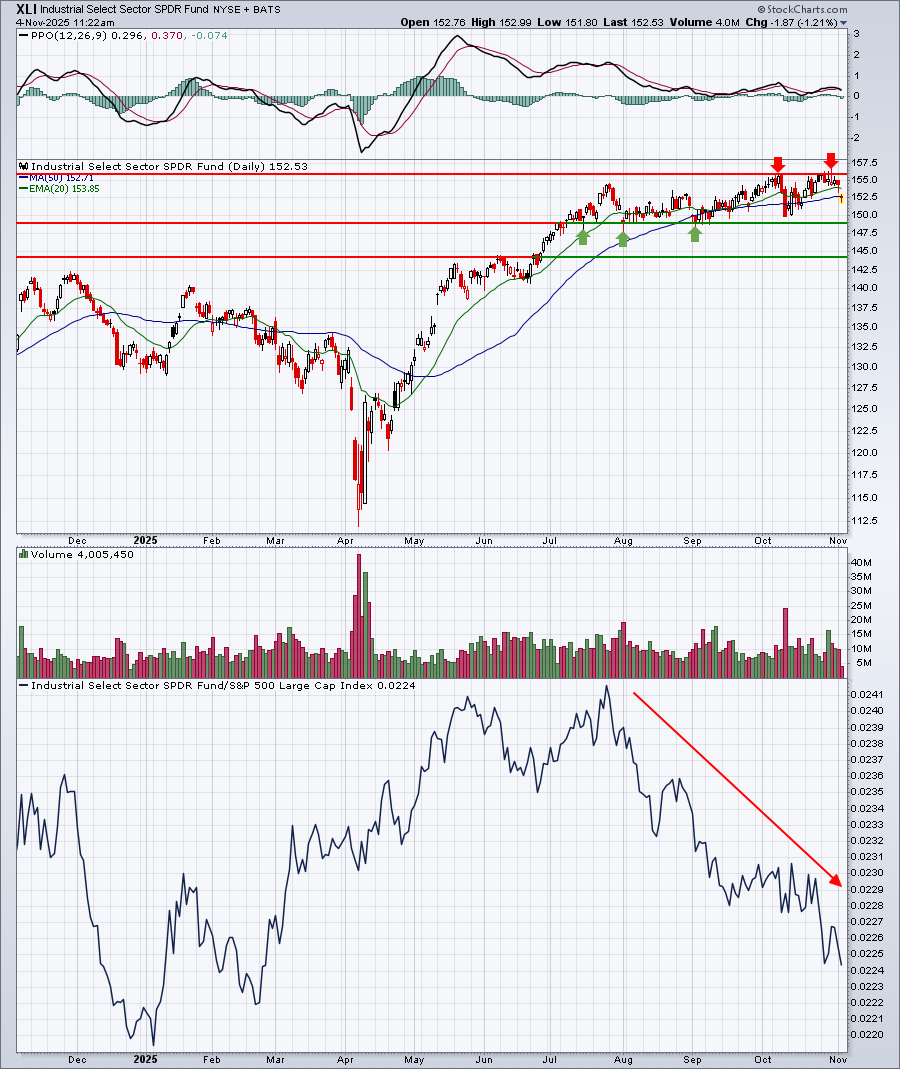
The bottom panel shows a very weak relative strength line. I discussed this a bit during my Trading Places LIVE show this morning. Currently, 4 of our 5 aggressive sectors are downtrending vs. the S&P 500. Normally, that would be a bearish signal. But we need to understand what's really been happening. It's not that money has been pouring into defensive sectors. Rather, the reason why the XLI, XLF, XLC, and XLY have struggled during 2025 on a relative basis is because technology (XLK) has been on absolute FIRE! The money isn't leaving these four aggressive areas and being parked in defensive areas. Instead, the money is rotating to technology. That's not bearish at all.
Industry Performance
There are a number of industry groups within industrials that love the month of November, but airlines ($DJUSAR) have been huge winners in November over the years. Check out the DJUSAR chart:
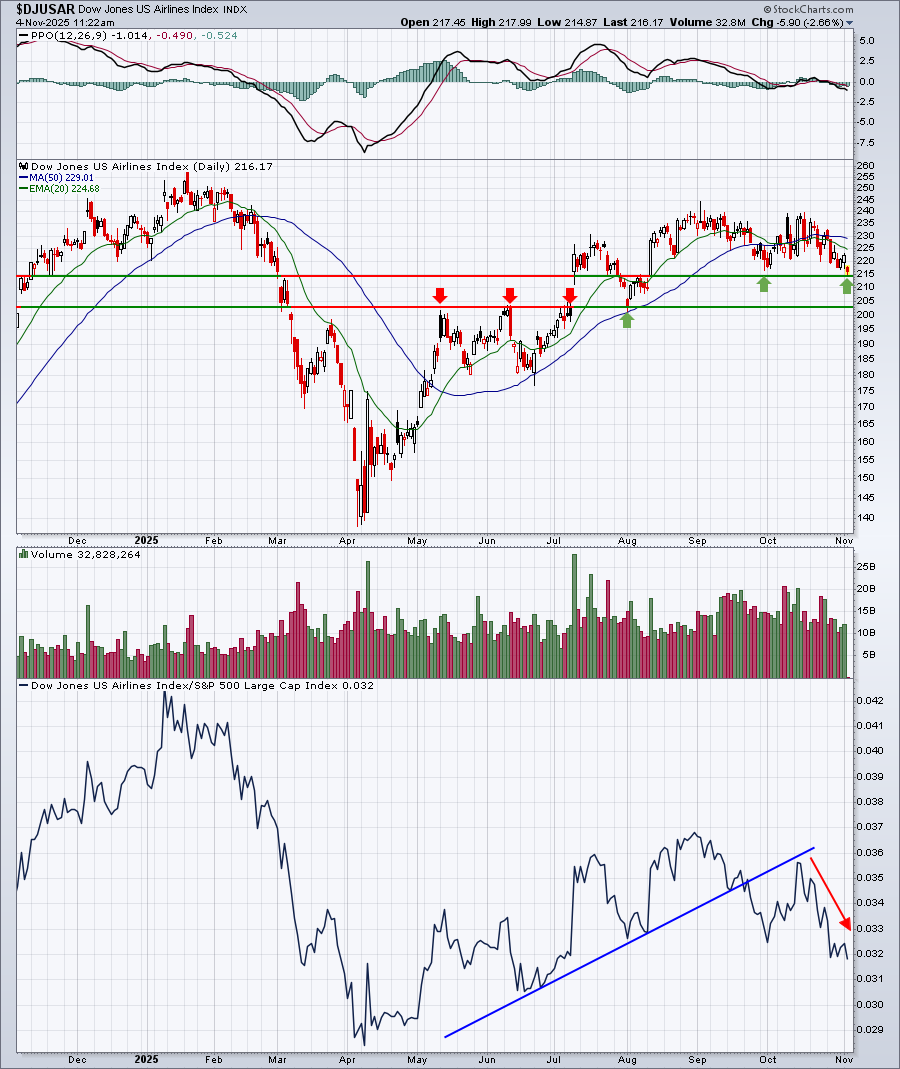
Airlines is the true "Dr. Jekyll and Mr. Hyde" industry group personality when it comes to seasonal performance. Since this secular bull market was confirmed in 2013, airlines have had two rather distinct personalities - very bullish during the 6-month period from September through February, while bearish during the other 6-month period from March through August. Check out this average performance comparison over the past 13 years:
- Average gain, September through February: +17.7%
- Average loss, March through August: -3.6%
So far, the current September through February period has been down. Will the bullish tailwinds kick in soon? I'd watch those two price support levels in the DJUSAR chart above for potential reversal areas.
Here are all industry groups that tend to perform much better than the benchmark S&P 500 during November, broken down by sector:
Technology (XLK):
- semiconductors, electrical components & equipment, electronic equipment
Consumer Discretionary (XLY):
- automobiles, home construction, apparel retailers, clothing & accessories, footwear, hotels, gambling, durable household products, home improvement retailers, recreational products, recreational services, specialized consumer services
Communication Services (XLC):
- publishing
Industrials (XLI):
- airlines, aerospace, railroads, industrial suppliers, commercial vehicles & trucks, heavy construction, trucking, building materials & fixtures, industrial machinery, delivery services
Financials (XLF):
- asset managers, banks, investment services, life insurance
Health care (XLV):
- none
Consumer staples (XLP):
- drug retailers, food retailers & wholesalers
Real estate (XLRE):
- real estate services, hotel & lodging REITs
Utilities (XLU):
- none
Energy (XLE):
- none
Materials (XLB):
- aluminum, nonferrous metals, steel
Stocks for November
A "Seasonality - November 2025" ChartList (annotated with 1 or 2 support levels to watch) will be created today and will be added to our website later today or early tomorrow morning.
You must be a StockCharts.com Extra or Pro member to download our ChartLists. Basic members and non-StockCharts.com members can view the charts one at a time.
Happy trading!
Tom