
EB Monthly Seasonality Report - February 2026
A Look Back At January Stocks:
Last month, we released our list of the Top 20 large cap stocks (plus 7 small cap stocks) that had strong historical track records during the month of January. Here are how they performed in January 2026, in order of best to worst performer:
Large Caps:
- MU: +45.36%
- WDC: +45.25%
- VLO: +11.45%
- DXCM: +10.05%
- FANG: +9.06%
- META: +8.55%
- PHM: +6.68%
- COR: +6.36%
- HCA: +4.59%
- NXPI: +4.18%
- SMCI: -0.55%
- MSTR: -1.47%
- DPZ: -1.56%
- TSLA: -4.29%
- APO: -7.06%
- ARES: -7.40%
- KKR: -10.37%
- NFLX: -10.95%
- SHOP: -18.48%
- TEAM: -27.11%
Small Caps:
- ICHR: +64.62%
- HP: +18.13%
- AX: +14.89%
- INVX: +13.63%
- GKOS: +5.73%
- PRLB: +4.07%
- CVI: -10.61%
The percentages represent the returns from the December 31st close to the January 31st close. The average performance of all 20 large cap stocks (+3.11%) easily beat the S&P 500 (+1.45%) and the NASDAQ 100 (QQQ, +1.23%). The average performance of the 7 small cap stocks (+15.78%) annihilated the small cap Russell 2000 (IWM, +5.45%).
S&P 500 February Performance
The annualized performance of the S&P 500 (since 1950) during the month of February is not very good from a long-term perspective as the S&P 500 has closed higher in February just 41 times out of the last 76 years. Only September has closed higher fewer times.
Since 1950, February has produced an annualized return of -0.19% on the S&P 500, which ranks 11th among all 12 calendar months, exceeding only September's annualized return. Here's a breakdown of the historically strong and weak performance periods throughout February on the S&P 500 since 1950. The %s shown are the ANNUALIZED returns for the period:
- February 1-3: +41.71%
- February 4-11: -10.90%
- February 12-15: +39.57%
- February 16-29: -16.26%
Historically, February tends to be strongest in the first half of the month. The second half of February begins a not-so-good stretch that runs through the end of March.
Sector Performance
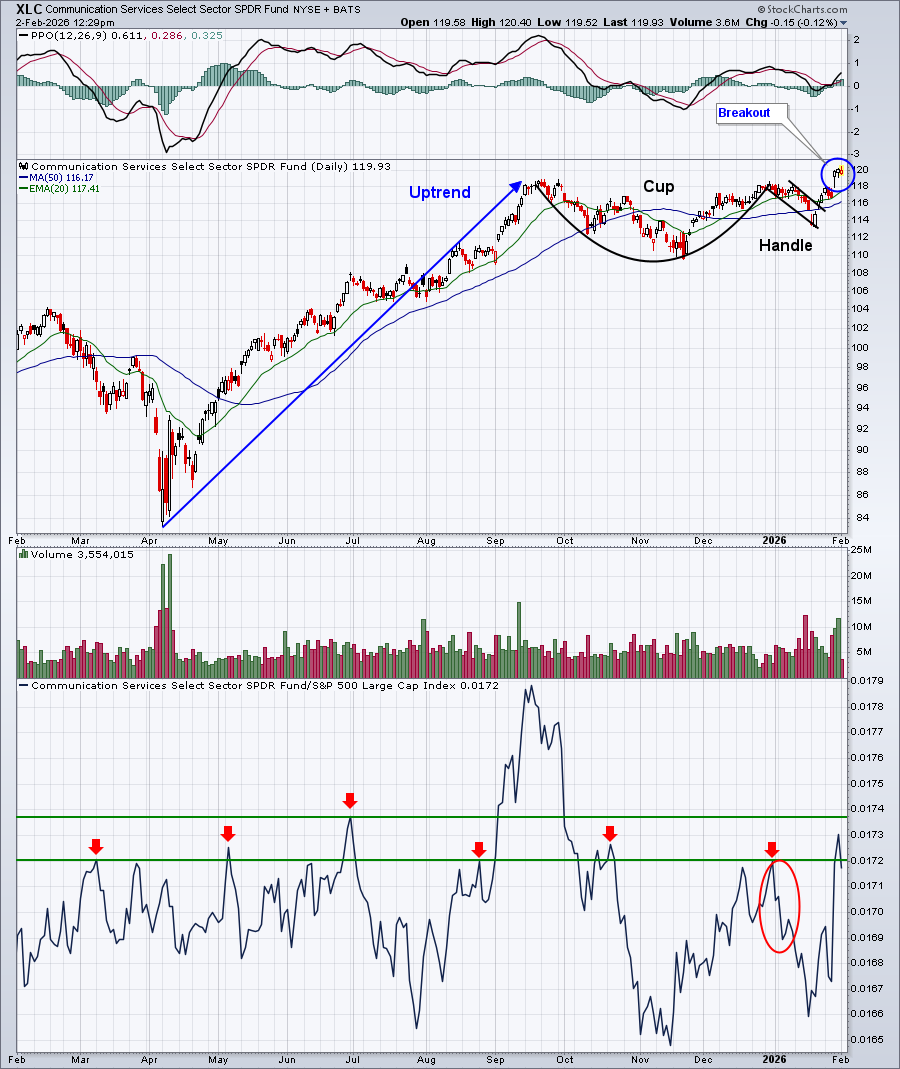
Last month, I indicated that communication services (XLC) had a 13-year winning streak of outperforming the S&P 500 during the month of January. We can now make that a 14-year winning streak as the XLC once again outperformed during January, thanks in large part to the strong Meta Platforms (META) earnings-related gains late in the month.
Technically, we were looking for a cup with handle breakout and that's what we saw:
As we look ahead to February, industrials (XLI) have typically performed the best among all sectors. Currently, the group looks solid technically as well:
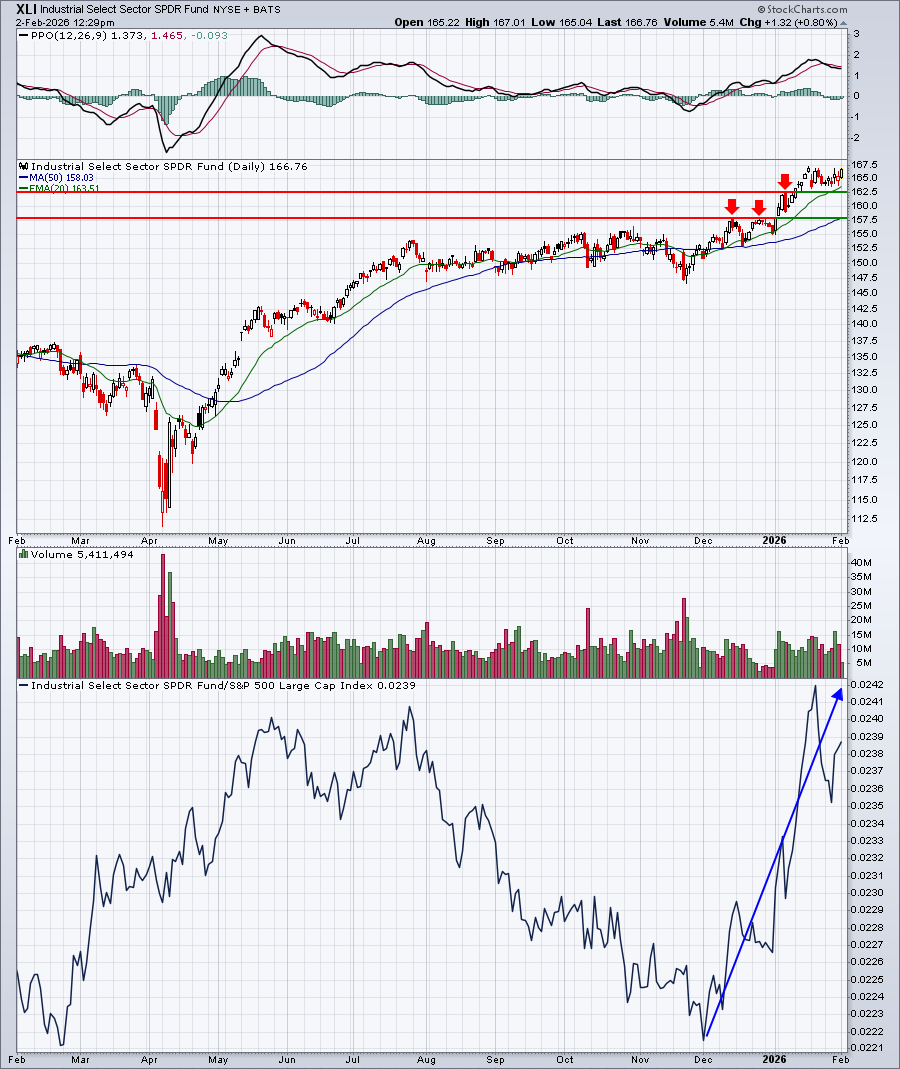
The red arrows mark prior price resistance. After clearing those levels, that becomes price support. Note that the two lines intersect almost perfectly with both the 20-day EMA and the 50-day SMA. That's your range of support right now on the XLI.
Industry Performance
Inside industrials, there is widespread strength during February. Aerospace ($DJUSAS) and defense ($DJUSDN), however, are two of the strongest and given the current geopolitical state, these could areas could prosper in February 2026. Check out the charts:
Aerospace:
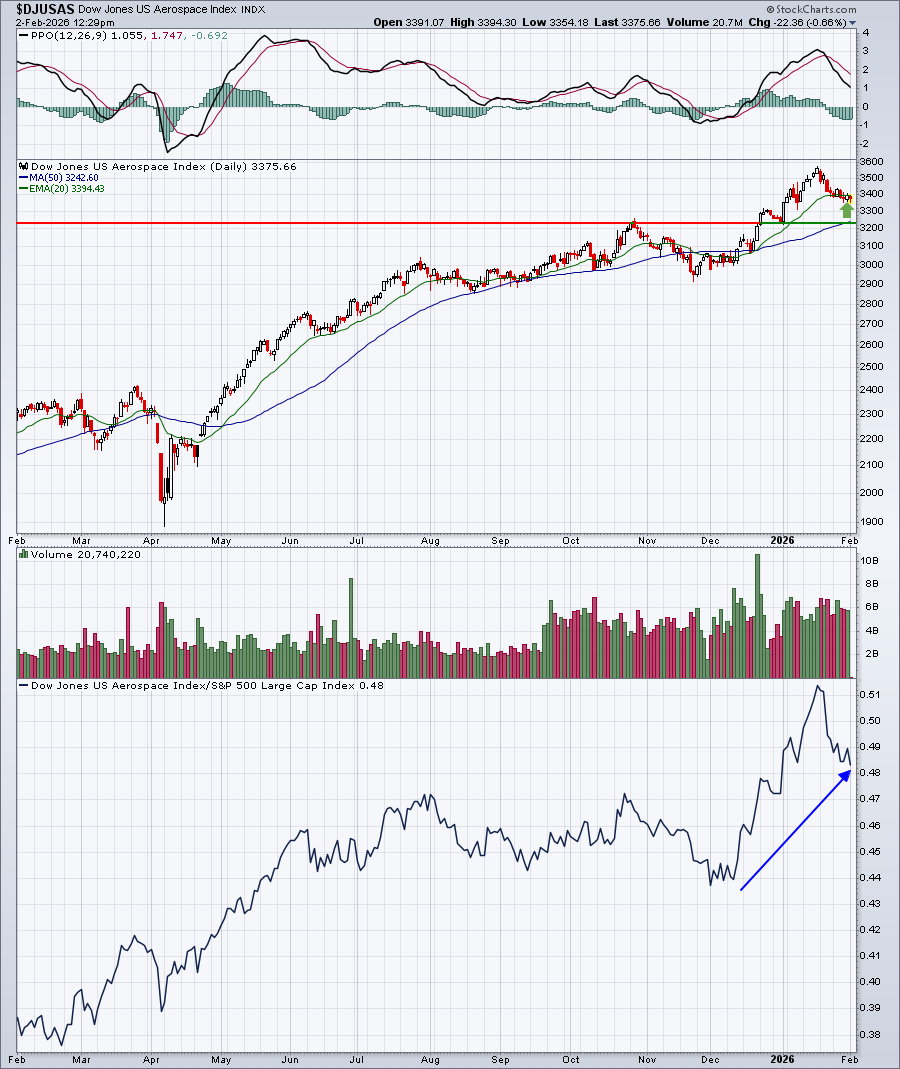
I like the pullback recently to the 20-day EMA and the DJUSAS should also see solid support near the 50-day SMA, should it get there. Relative strength has eased a bit during this recent period of consolidation/selling, but this group has been a very strong relative winner since early December.
Defense:
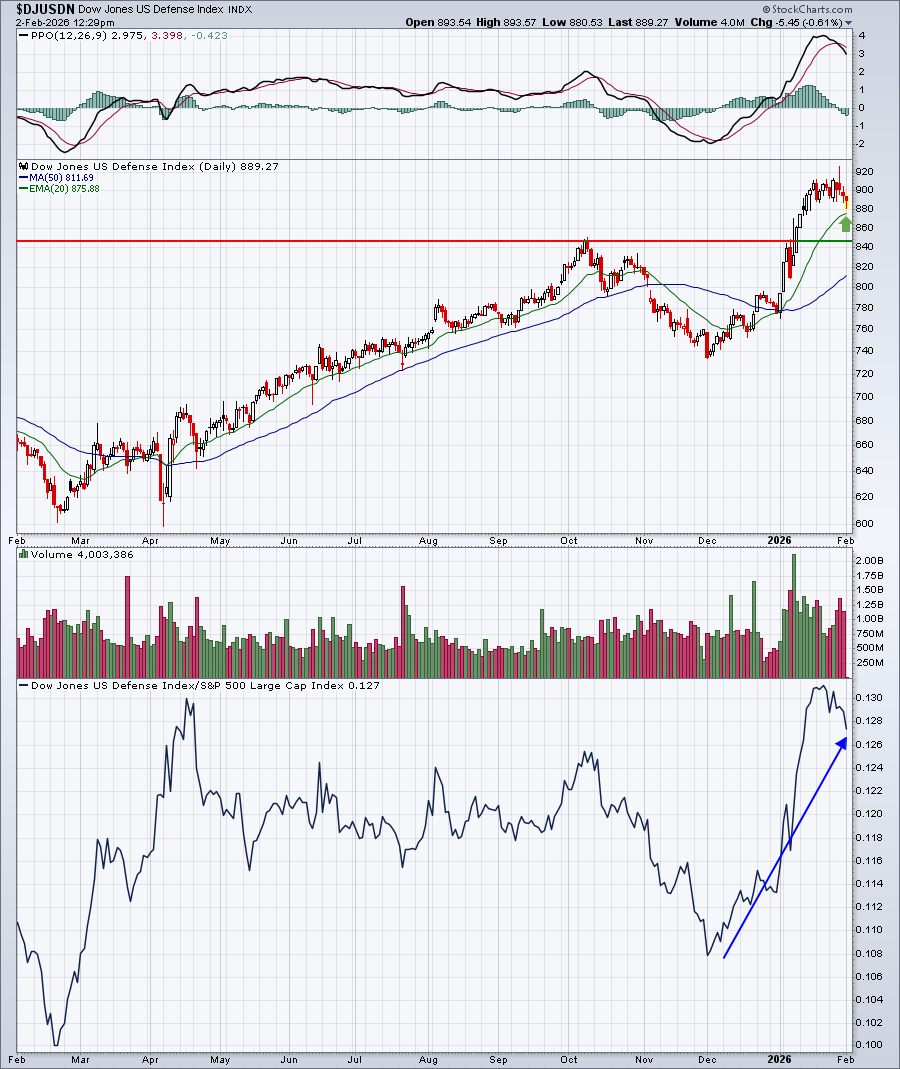
Defense is perhaps a bit stronger than aerospace right now. Both of these groups also fit the "value" profile that Wall Street has been gravitating to as well.
Here are all industry groups that tend to perform much better than the benchmark S&P 500 during February, broken down by sector:
Technology (XLK):
- semiconductors, telecom equipment, electrical components & equipment
Consumer Discretionary (XLY):
- travel & tourism, hotels, gambling, specialty retailers
Communication Services (XLC):
- media agencies
Industrials (XLI):
- marine transportation, aerospace, defense, airlines, heavy construction, trucking, railroads
Financials (XLF):
- insurance brokers, specialty finance, property & casualty insurance, consumer finance
Health care (XLV):
- none
Consumer staples (XLP):
- tobacco
Real estate (XLRE):
- real estate services, real estate holding & development
Utilities (XLU):
- water
Energy (XLE):
- coal
Materials (XLB):
- nonferrous metals, steel, aluminum, paper
Stocks for February
A "Seasonality - February 2026" ChartList (annotated with 1 or 2 support levels to watch) will be created and should be added to our website later today or early tomorrow.
You must be a StockCharts.com Extra or Pro member to download our ChartLists. Basic members and non-StockCharts.com members can view the charts one at a time.
Happy trading!
Tom