
EB Monthly Seasonality Report - May 2026
A Look Back At April Stocks:
Last month, we released our list of the top large cap stocks (12) plus top small cap stocks (12) that had strong historical track records during the month of April. Here are how they performed in April 2026, in order of best to worst performer:
Large Caps:
- AMZN: +27.27%
- TT: +18.19%
- PFG: +11.99%
- WAB: +7.99%
- AXP: +7.14%
- NRG: +6.13%
- SNA: +5.56%
- WMB: +4.85%
- HAS: +2.39%
- DVN: +2.09%
- OKE: +1.08%
- EQT: -5.59%
Small Caps:
- EZPW: +29.16%
- MTRN: +27.07%
- WAL: +15.09%
- PAG: +14.71%
- LRN: +10.20%
- WRLD: +8.98%
- AN: +8.77%
- CRS: +8.64%
- GPI: +7.94%
- EHC: +3.58%
- GDEN: -3.33%
- CRK: -17.36%
The percentages represent the returns from the March 31st close to the April 30th close. The average performance of all 12 large cap stocks (+7.42%%) trailed both the S&P 500 (+10.51%) and the NASDAQ 100 (QQQ, +15.69%). The average performance of the 12 small cap stocks (+9.45%) trailed the small cap Russell 2000 (IWM, +12.08%) as well.
Our performance, however, wasn't as bad as it might appear on the surface. First, 21 of the 24 stocks provided gained ground. Second, and this is one is big, technology was a massive driver in the April stock market gains and our April Seasonality ChartList had exactly ZERO technology positions.
S&P 500 May Performance
The annualized performance of the S&P 500 (since 1950) during the month of May is +4.41%, though it's been much stronger during the current secular bull market. The S&P 500 has closed higher in May 47 times out of the last 76 years. In terms of annualized performance on the S&P 500, May ranks 8th out of 12 calendar months.
Here's a breakdown of the historically strong and weak performance periods throughout May on the S&P 500 since 1950. The %'s shown are the ANNUALIZED returns for the period:
- May 1-5: +32.51%
- May 6-11: -17.78%
- May 12-16: +8.53%
- May 17-25: -15.94%
- May 26-31: +37.47%
History suggests that May starts off the month and ends the month with a couple of bangs. The period in-between, however, has been far less desirable. Broken down a different way, here's how May has performed since 1950:
- May 1-5 + May 26-31: +35.22%
- May 6-25: -10.31%
Sector Performance
Last month, I pointed out that energy (XLE) had been a clear leader in 2026 and that it historically performed better than the other sectors in April. I also correctly pointed out the negative divergence that was present in late March and that, after a potential short-term pullback, I'd look for the XLE to lead again. The XLE did rally strongly during the second half of April, but it badly lagged during the first half of the month as its PPO moved just below centerline support to "reset". The XLE, as it turned out, was not the place to be in April 2026 as technical conditions seemed to win out over historical tendency.
Looking ahead to May, technology (XLK) and communication services (XLC) have been the clear relative leaders among sectors during the month of May since this secular bull market was confirmed in 2013. They both have outperformed the S&P 500 about 80% of Mays since 2013, but the average relative outperformance has been stronger among technology stocks.
Industry Performance
It's hard to suggest a group as overbought as semiconductors ($DJUSSC), but this group absolutely loves the month of May. Check out how the DJUSSC has performed relative to the S&P 500 over the past 14 years:
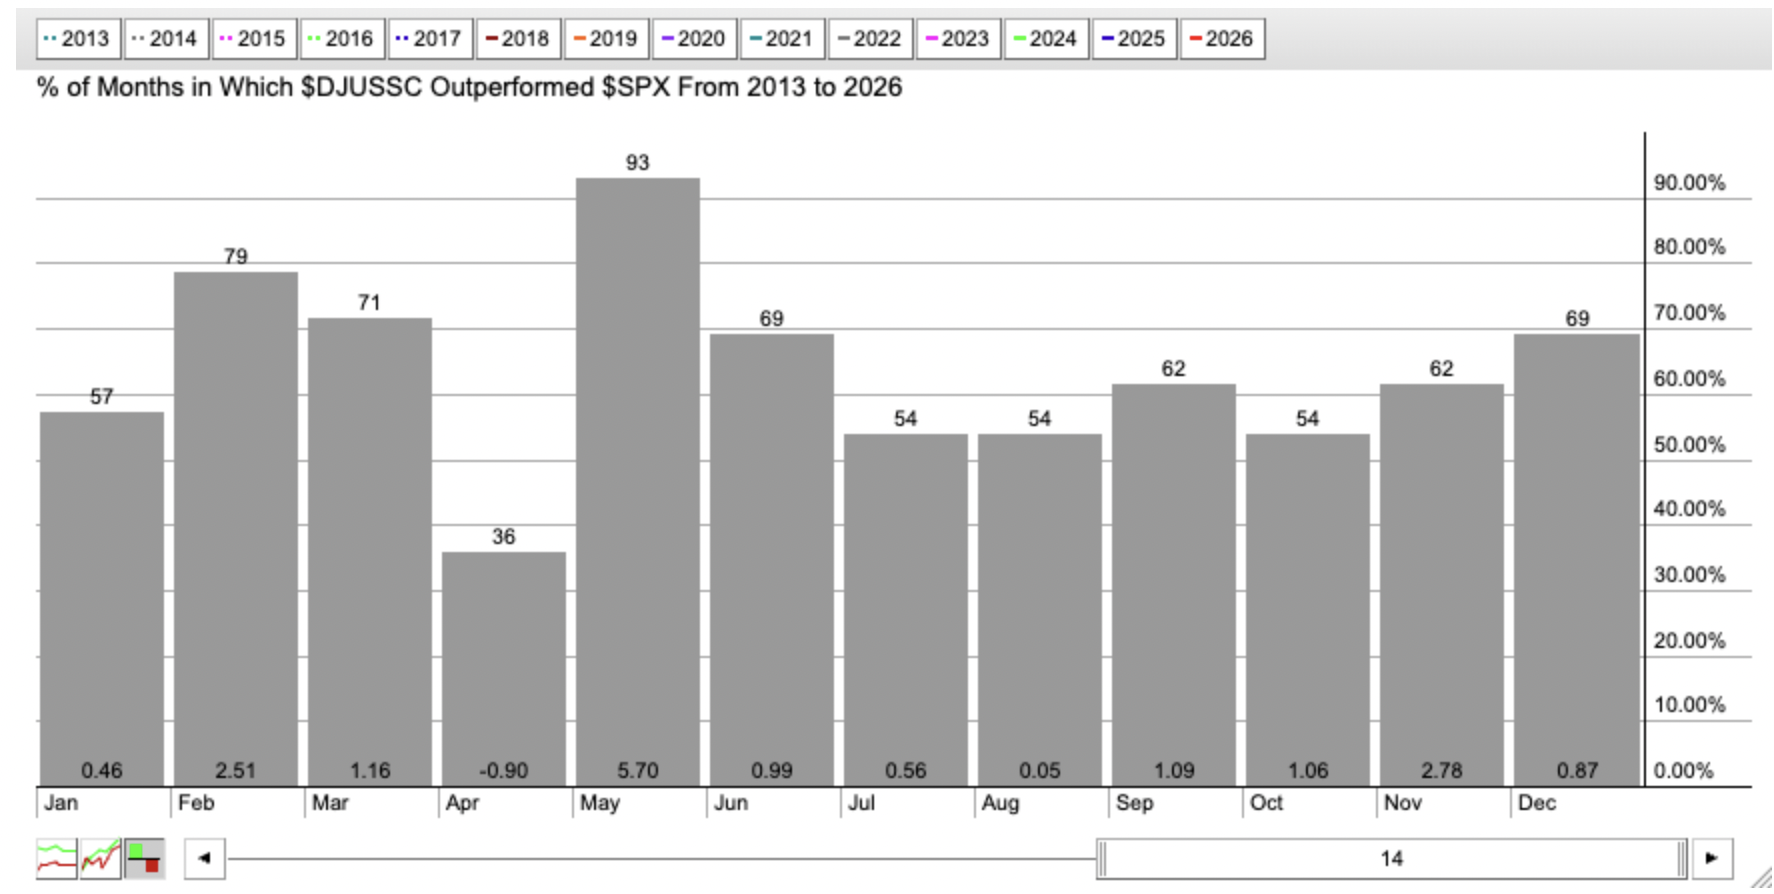
It has outperformed the S&P 500 by 5 percentage points, on average, over the past 14 Mays, BY FAR exceeding any other calendar month's relative performance.
Here are all industry groups that tend to perform much better than the benchmark S&P 500 during May, broken down by sector:
Technology (XLK):
- renewable energy, semiconductors, software, computer hardware, electrical components & equipment, electronic equipment
Consumer Discretionary (XLY):
- tires, toys, automobiles
Communication Services (XLC):
- internet
Industrials (XLI):
- marine transportation, building materials & fixtures
Financials (XLF):
- mortgage finance, full line insurance, insurance brokers
Health care (XLV):
- none
Consumer staples (XLP):
- none
Real estate (XLRE):
- none
Utilities (XLU):
- none
Energy (XLE):
- coal
Materials (XLB):
- none
Stocks for May
A "Seasonality - May 2026" ChartList (annotated with 1 or 2 support levels to watch) will be created by tomorrow and will be added to our website.
You must be a StockCharts.com Extra or Pro member to download our ChartLists. Basic members and non-StockCharts.com members can view the charts one at a time.
Happy trading!
Tom