
EB Monthly Seasonality Report - August 2026
A Look Back At July Stocks:
Last month, we released our list of the top 30 large, mid, and small cap stocks that had strong historical track records during the month of July. Here are how they performed in July 2026:
Large Caps
- REGN: +22.31%
- IQV: +21.63%
- ARES: +15.08%
- BX: +8.57%
- XYZ: +6.89%
- AAPL: +6.76%
- AMGN: +6.36%
- ANET: +6.16%
- FITB: +0.23%
- LITE: -16.80%
- MRNA: -21.72%
- GNRC: -32.68%
Average Large Cap Return: +1.90%
S&P 500 (SPY) Return: +0.03%
NASDAQ 100 (QQQ) Return: -6.59%
Mid Caps
- LAD: +32.68%
- AN: +14.32%
- CG: +9.29%
- MEDP: +8.97%
- YETI: -1.25%
- BC: -6.22%
- CYTK: -9.46%
- SGI: -16.67%
Average Mid Cap Return: +3.96%
S&P 400 Mid Cap (MDY) Return: -2.42%
Small Caps
- VRTS: +11.05%
- BLFS: +10.76%
- ETSY: +8.43%
- NEO: +4.80%
- ADMA: +1.08%
- DAN: -1.03%
- GPI: -1.51%
- XPEL: -10.54%
- MARA: -18.50%
- RUN: -26.68%
Average Small Cap Return: -2.22%
Russell 2000 Small Cap (IWM) Return: -3.08%
The percentages represent the returns from the June 30th close to the July 31st close. The average performance of our July seasonality stocks in each asset class - large cap, mid cap, and small cap - beat their benchmark index, so I'd say it was a solid month for our seasonal stocks.
S&P 500 August Performance
The annualized performance of the S&P 500 (since 1950) during the month of August is +0.54%, which ranks 10th among all calendar months, besting only February (barely) and September. August has risen 42 times and fallen 34 times since 1950, representing 55% chance of August moving higher. Only September has an appreciably lower percentage (45%), though February and June are close.
Here's a breakdown of the historically strong and weak performance periods throughout August on the S&P 500 since 1950. The %'s shown are the ANNUALIZED returns for the period:
- August 1-5: -19.15%
- August 6-7: +34.50%
- August 8-10: -15.97%
- August 11-17: +19.15%
- August 18-28: -5.47%
- August 19-31: +5.37%
I broke out the August 1st through August 5th period intentionally as August is the only calendar month with a negative annualized return for the first 5 calendar days of a month. The 28th through the 6th of nearly every calendar month is historically strong. August is an exception and highlights the dullness of summertime trading in U.S. equities, at least historically. It also supports the S&P 500 continuing to trade mostly sideways as we work our way through the late summer months.
Sector Performance
Last month, I pointed out that technology (XLK) and consumer discretionary (XLY) tend to lead during the month of July, just as they typically do for the month of June as well. June turned out to be a bad month for both the XLK and the XLY and, quite honestly, so was July. Here's what a 1-month performance chart looks like for our sectors:
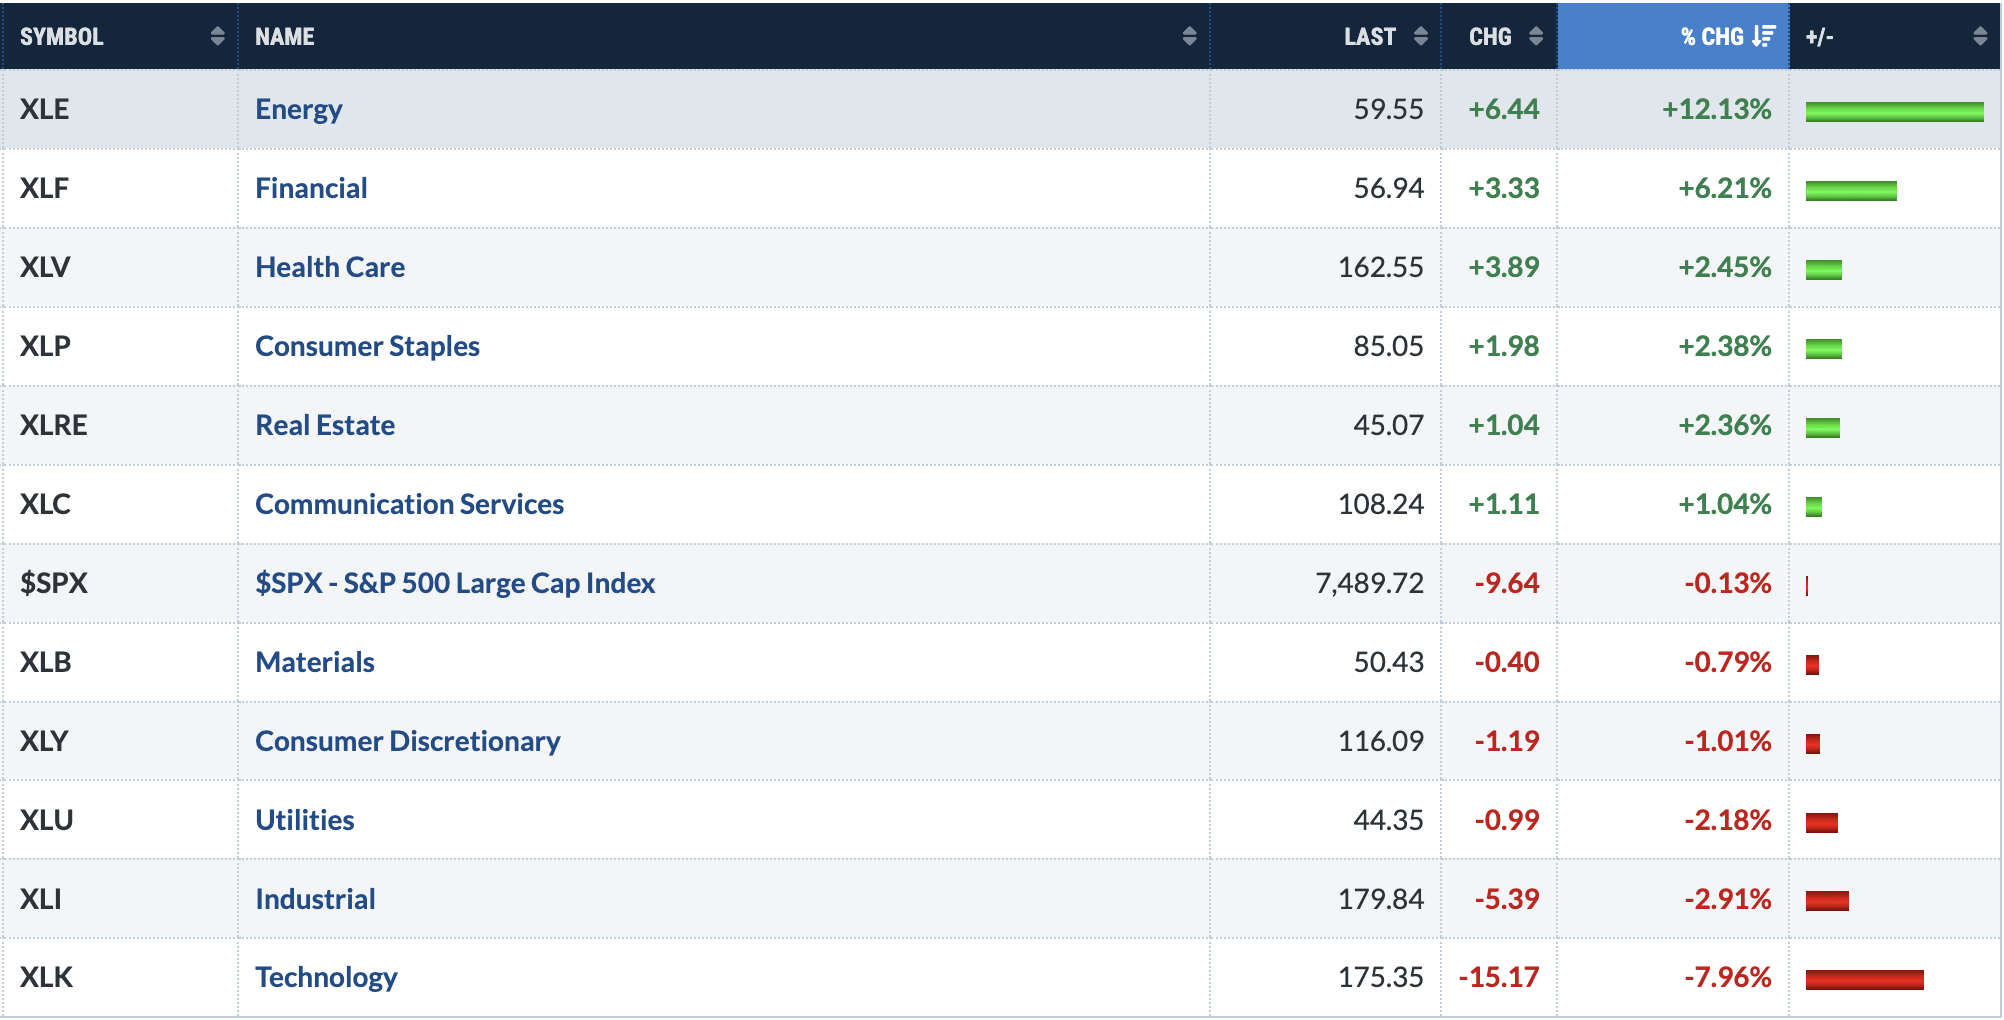
As tensions escalated again in the Middle East, money rotated away from aggressive areas like the XLK and XLY, and instead benefited energy (XLE) and financials (XLF).
For August, I'm going to sound like a broken record, but clearly technology (XLK) has been the best-performing sector. One month ago, I pointed out what looked like at the time a symmetrical triangle, a bullish continuation pattern. That completely fell apart and now I'd say there's more of a bullish wedge feel to the chart:
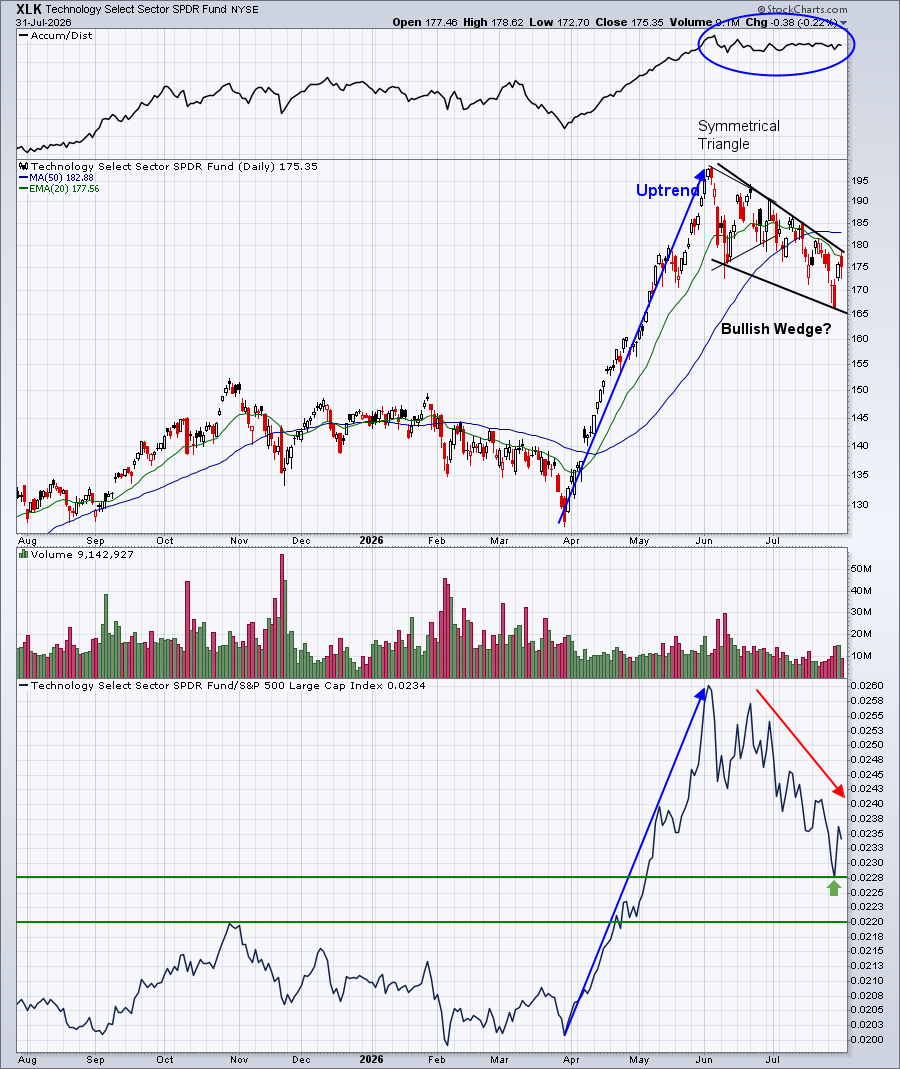
The bottom panel, though, does show a sector that is downtrending relative to the S&P 500 and that needs to change before we're going to see a meaningful rally in technology.
Industry Performance
Seasonality hasn't been our best friend this summer, especially when it comes to pointing out strong sectors and industry groups. But the show must go on, so let's discuss the seasonally-strong industry groups within technology for the month of August. It's fairly limited, but both computer hardware ($DJUSCR) and renewable energy ($DWCREE) typically perform well during August. Currently, both are in breakdown mode, but I do trust the computer hardware group a lot more.
As July opened up, I pointed out that I did like the computer hardware group as it had just bounced off its 50-day SMA. And, to be fair, the group did perform well throughout the month of July......until Apple Inc. (AAPL) reported its quarterly results after the close on Thursday, July 30th. Then we saw the following gap down, led by that AAPL rout:
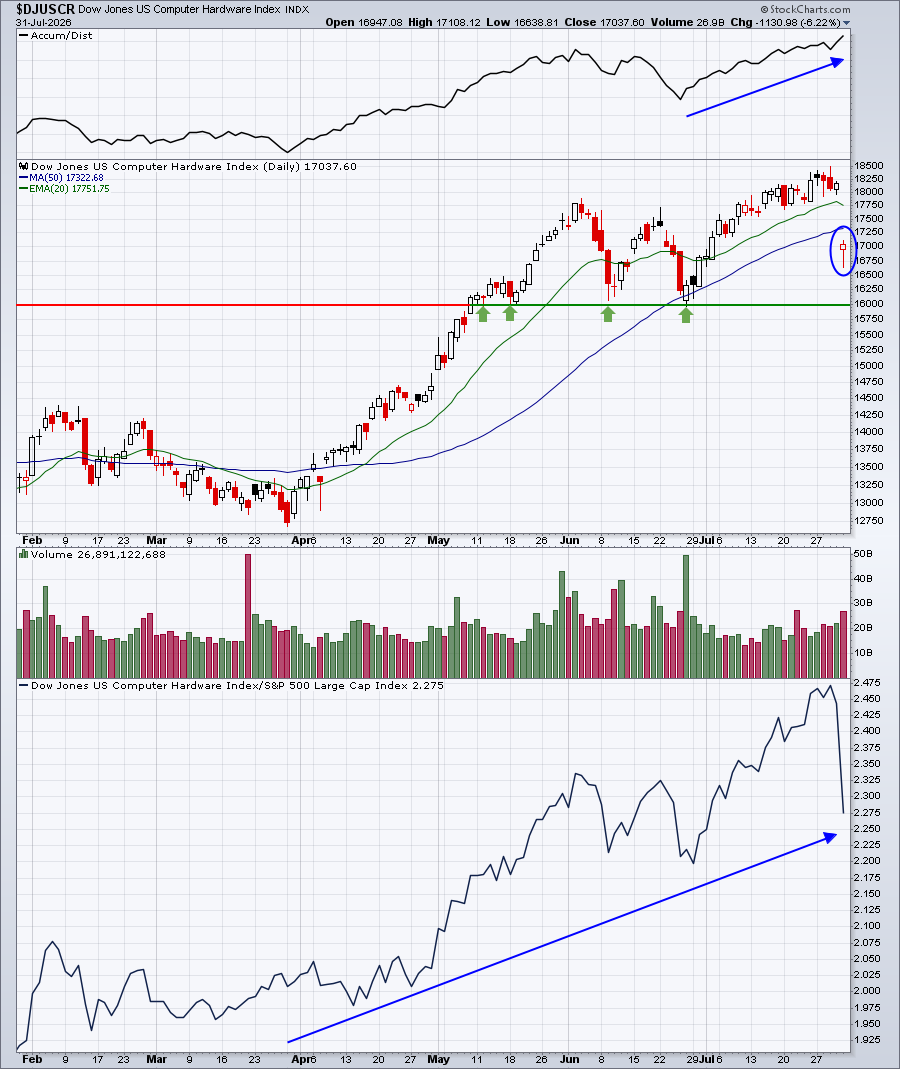
Note that the AD line in this group keeps rising, suggesting significant accumulation. Even on Friday, after the AAPL quarterly report, buyers emerged throughout the trading day, happily buying the group at lower prices.
Here are all industry groups that tend to perform much better than the benchmark S&P 500 during August, broken down by sector:
Technology (XLK):
- computer hardware, renewable energy
Consumer Discretionary (XLY):
- automobiles, apparel retailers, home improvement retailers, recreational services, home construction, travel & tourism
Communication Services (XLC):
- mobile telecommunications
Industrials (XLI):
- defense
Financials (XLF):
- mortgage finance, reinsurance, consumer finance
Health care (XLV):
- none
Consumer staples (XLP):
- nondurable household products
Real estate (XLRE):
- none
Utilities (XLU):
- none
Energy (XLE):
- coal
Materials (XLB):
- none
Stocks for August
A "Seasonality - August 2026" ChartList (annotated with 1 or 2 support levels to watch) will be created later today or tomorrow and should be available by tomorrow on our website.
You must be a StockCharts.com Extra or Pro member to download our ChartLists. Basic members and non-StockCharts.com members can view the charts one at a time.
Happy trading!
Tom