
EB Monthly Seasonality Report - October 2026
A Look Back At September Stocks:
Last month, we released our list of the top large, mid, and small cap stocks that had strong historical track records during the month of August. Here are how they performed in SEPTEMBER 2026:
Large Caps
- DELL: +17.97%
- ULTA: +1.69%
- VST: +0.87%
- NKE: -9.37%
- LULU: -20.01%
Average Large Cap Return: -1.77%
S&P 500 (SPY) Return: -0.58%
NASDAQ 100 (QQQ) Return: +3.21%
Mid Caps
- NTNX: +2.68%
- HQY: -8.37%
- THO: -9.08%
- FIVE: -11.05%
Average Mid Cap Return: -6.45%
S&P 400 Mid Cap (MDY) Return: -4.43%
Small Caps
- SIG: +24.37%
- INSW: +17.32%
- AEO: +6.92%
- HCC: -18.63%
- QDEL: -26.96%
Average Small Cap Return: +0.60%
Russell 2000 Small Cap (IWM) Return: -5.46%
The percentages represent the returns from the August 31st close to the September 30th close. The average performance of our September seasonality stocks was mixed vs. their asset class benchmark. Both our large cap and mid cap stocks underperformed their respective benchmark, while small caps easily exceeded theirs.
S&P 500 October Performance
The annualized performance of the S&P 500 (since 1950) during the month of October is +10.91%, which ranks 7th among all calendar months. October has risen 45 times and fallen 31 times since 1950. The annualized return in October on the NASDAQ is slightly worse, gaining 9.28%. The small cap Russell 2000 (IWM) is much worse, as October produces an annualized return of -6.30% since 1988, the worst month of the calendar year. Small caps tend to start the month in very poor fashion, falling an annualized -49.67% during the first 9 days of the month.
Here's a breakdown of the historically strong and weak performance periods throughout October on the S&P 500 since 1950. The %'s shown are the ANNUALIZED returns for the period:
- October 1-6: +38.20%
- October 7-10: -22.69%
- October 11-18: +20.66%
- October 19-21: +4.82%
- October 22-27: -40.38%
- October 28-31: +65.30%
October typically follows several other calendar months, in terms of periods of strength and weakness. It's noteworthy that the October 22-27 period is the worst period of the entire year historically. Just as noteworthy, however, is that the close on October 27th begins the most bullish period of the year. First, the October 28th through November 5th period produces annualized returns of +67.29%. From a longer-term perspective, the October 28th through January 18th period has risen nearly 90% of years dating back to 1950. Clearly, there's a strong tendency for the S&P 500 to see higher prices during this period.
Sector Performance
As we look back to our September Seasonality Report, we mentioned that consumer discretionary (XLY) and industrials (XLI) had historically performed best, with the XLY outperforming the benchmark S&P 500 by an average of +0.9% during September since the confirmation of the secular bull market back in 2013. I went on to indicate, however, that the XLY was not looking good technically.
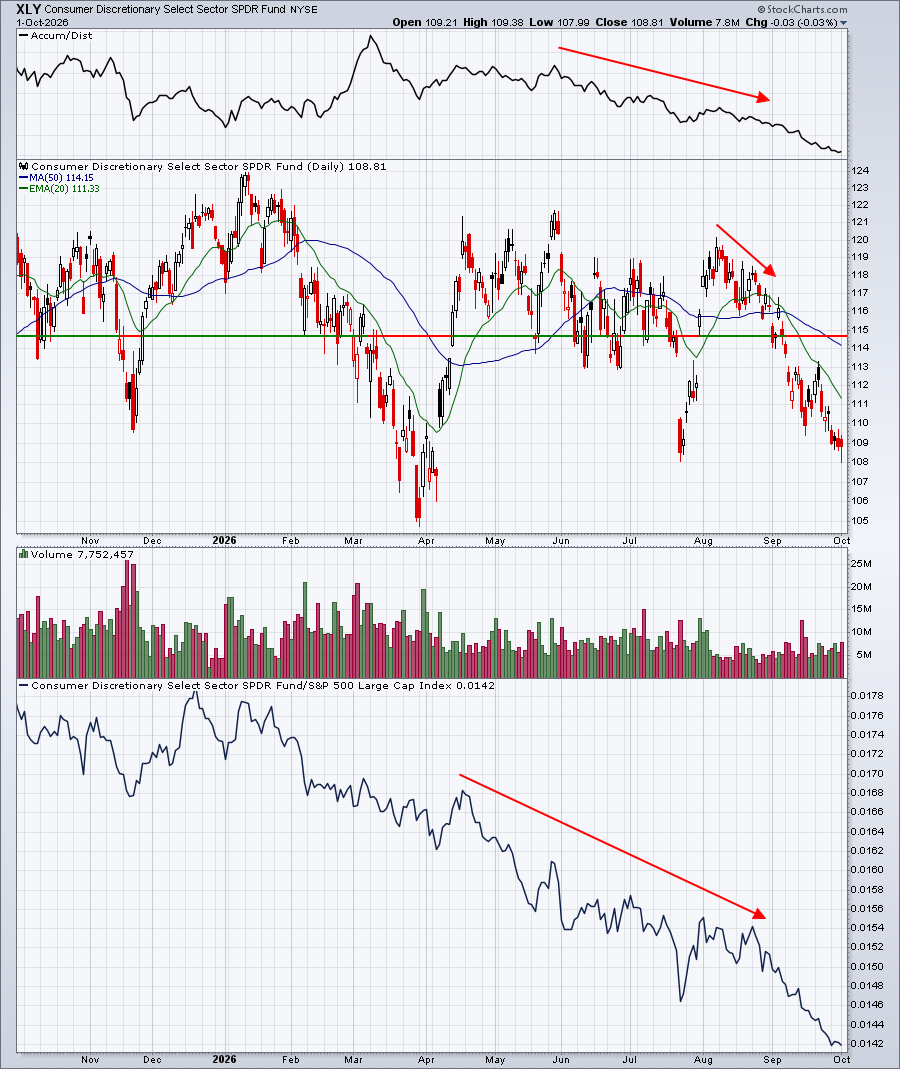
I went on to say the following:
"Relative strength has been awful for many months. Part of that is because technology has been so strong, but even on an absolute basis, there's not much to like about the XLY. The AD line isn't exactly showing that Wall Street is beaming with confidence either. So let's step into September possibly by dipping our toes in the water, not by diving in. Technically, the XLY picture grows worse if 115 support is lost."
While seasonality suggested blue skies ahead for discretionary stocks, technical conditions told us something very different. In the end, 115 support was lost on the XLY and technical weakness easily won out over seasonality. This is a perfect case in point why I use price and volume (technical conditions) as my primary indicator and seasonality is simply one other secondary indicator.
Looking ahead to October, technology (XLK) has a history of strong October performance and that sector continues to be the hottest sector. So I personally would not bet against this space. Utilities (XLU) also tend to perform well in October, and I could see that happening again in October 2026. I would need to see a definitive top in the 10-year treasury yield ($TNX), though, to grow more confident owning the XLU.
Industry Performance
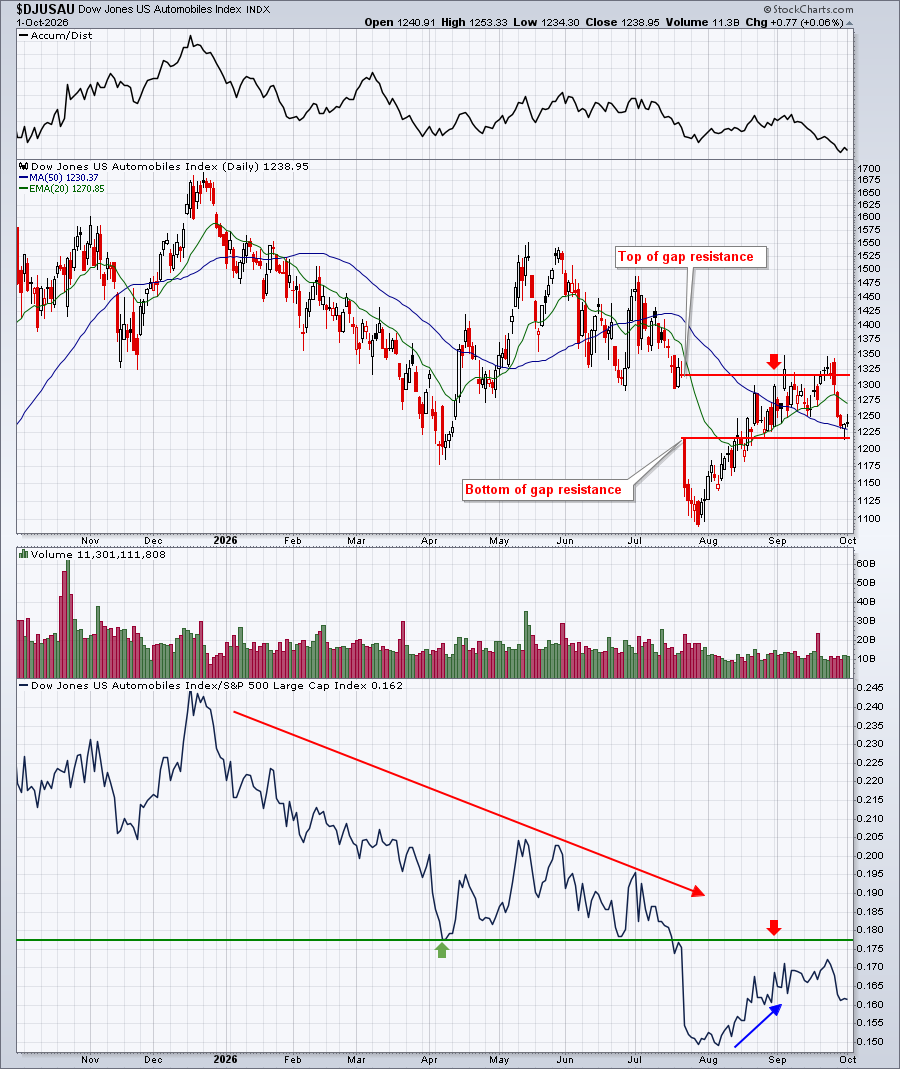
I mentioned that automobiles ($DJUSAU) had been the group where we'd seen the most September strength among discretionary stocks in the past. Autos also showed some absolute strength to open September as well, but the wheels on the group fell off in the final week of September:
In October, renewable energy ($DWCREE) and computer hardware ($DJUSCR) tend to lead the way among technology stocks. Technically, however, the two couldn't be further apart in terms of technical strength. The DWCREE has been in a horrific downtrend that has seen the group lose nearly 50% of its value in the past 3 months. Meanwhile, the DJUSCR keeps stair stepping higher:
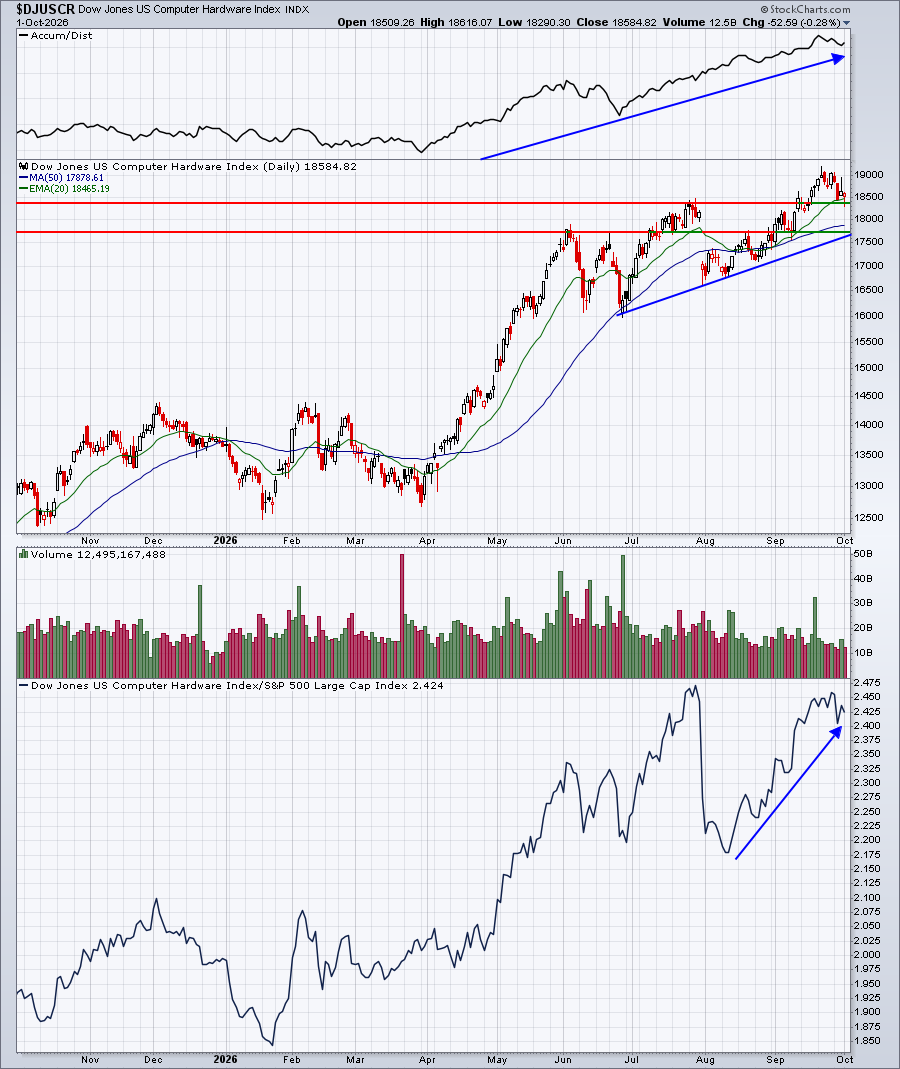
The hammer that printed on Thursday on the rising 20-day EMA would seem to indicate that the current level is a solid one for entry. Of course, we do have a big jobs report due out on Friday morning, so it might make sense to see how Wall Street reacts on Friday before growing too bullish.
Here are all industry groups that tend to perform much better than the benchmark S&P 500 during October, broken down by sector:
Technology (XLK):
- renewable energy, computer hardware, software, semiconductors
Consumer Discretionary (XLY):
- tires, hotels
Communication Services (XLC):
- none
Industrials (XLI):
- airlines, diversified industrials
Financials (XLF):
- full line insurance, banks
Health care (XLV):
- none
Consumer staples (XLP):
- tobacco, drug retailers
Real estate (XLRE):
- none
Utilities (XLU):
- conventional electricity
Energy (XLE):
- none
Materials (XLB):
- steel, nonferrous metals
Stocks for October
A "Seasonality - October 2026" ChartList (annotated with 1 or 2 support levels to watch) will be created tomorrow and should be available by end of day on our website.
You must be a StockCharts.com Extra or Pro member to download our ChartLists. Basic members and non-StockCharts.com members can view the charts one at a time.
Happy trading!
Tom