
EB Monthly Seasonality Report - November 2026
A Look Back At October Stocks:
Last month, we released our list of the top large, mid, and small cap stocks that had strong historical track records during the month of October. Here are how they performed in October 2026:
Large Caps
- GM: +13.43%
- STLD: +12.26%
- VRT: -3.03%
- DAL: -4.87%
- UAL: 7.49%
- NFLX: -10.53%
- GOOGL: -18.40%
- FIX: -24.58%
Average Large Cap Return: -5.40%
S&P 500 (SPY) Return: -0.71%
NASDAQ 100 (QQQ) Return: -6.42%
Mid Caps
- CACI: +10.60%
- EWBC: +6.12%
- XPO: +5.41%
- AVAV: -10.23%
- BHF: -12.71%
Average Mid Cap Return: -0.16%
S&P 400 Mid Cap (MDY) Return: +1.75%
Small Caps
- SXC: +17.71%
- CUBI: +14.51%
- MATX: +1.65%
- BGC: -1.91%
- NEO: -6.05%
- AMSF: -7.74%
- SKYW: -13.55%
Average Small Cap Return: +0.60%
Russell 2000 Small Cap (IWM) Return: +0.48%
The percentages represent the returns from the September 3oth close to the October 31st close. The average performance of our October seasonality stocks was mixed vs. their asset class benchmark. Our large cap stocks underperformed the S&P 500, but slightly outperformed the NASDAQ 100. Our seasonal mid cap stocks slightly underperformed their respective benchmark, while our seasonal small caps slightly outperformed the Russell 2000.
S&P 500 November Performance
The annualized performance of the S&P 500 (since 1950) during the month of November is +22.05%, which easily ranks as the best among all calendar months. November has risen 53 times and fallen 23 times since 1950. The annualized return in November on the NASDAQ (since 1971) is even better, gaining 24.56%. The small cap Russell 2000 (IWM) has entered its most bullish period of the year by far, as November produces an annualized return of 26.91% since 1988, its second-best month of the calendar year. The only calendar month that's been better for small caps is December, which has produced an annualized return of +28.50%. So small caps are now staring at the start of its best 2-month period on Monday morning.
Here's a breakdown of the historically strong and weak performance periods throughout November on the S&P 500 since 1950. The %'s shown are the ANNUALIZED returns for the period:
- November 1-5: +68.94%
- November 6-9: -3.24%
- November 10-13: +22.72%
- November 14-20: -17.53%
- November 21-30: +44.30%
November isn't our typical month in terms of its intra-month periods of strength and weakness. For instance, most calendar months tend to struggle significantly from the 19th through the 25th. That's not really been the case for November as its mid-month weakness usually ends around the 20th. While we finished very weak at the end of October, the October 28th through November 5th period produces annualized returns of +67.29% since 1950 on the S&P 500. From a longer-term perspective, the October 28th through January 18th period has risen 67 of the last 76 years, dating back to 1950. Clearly, there's a strong tendency for the S&P 500 to see higher prices during this period, despite last week's poor finish.
Sector Performance
Heading into October, I mentioned that technology (XLK) and utilities (XLU) tended to perform well. In October 2026, however, only the XLU performed well - mostly due to the topping in the 10-year treasury yield ($TNX). The XLK, on the other hand, had a rough month, especially to close out the month last week. Despite many earnings reports in technology that handily beat consensus estimates, it was clearly a "sell on the news" mentality, as the XLK searches for price support:
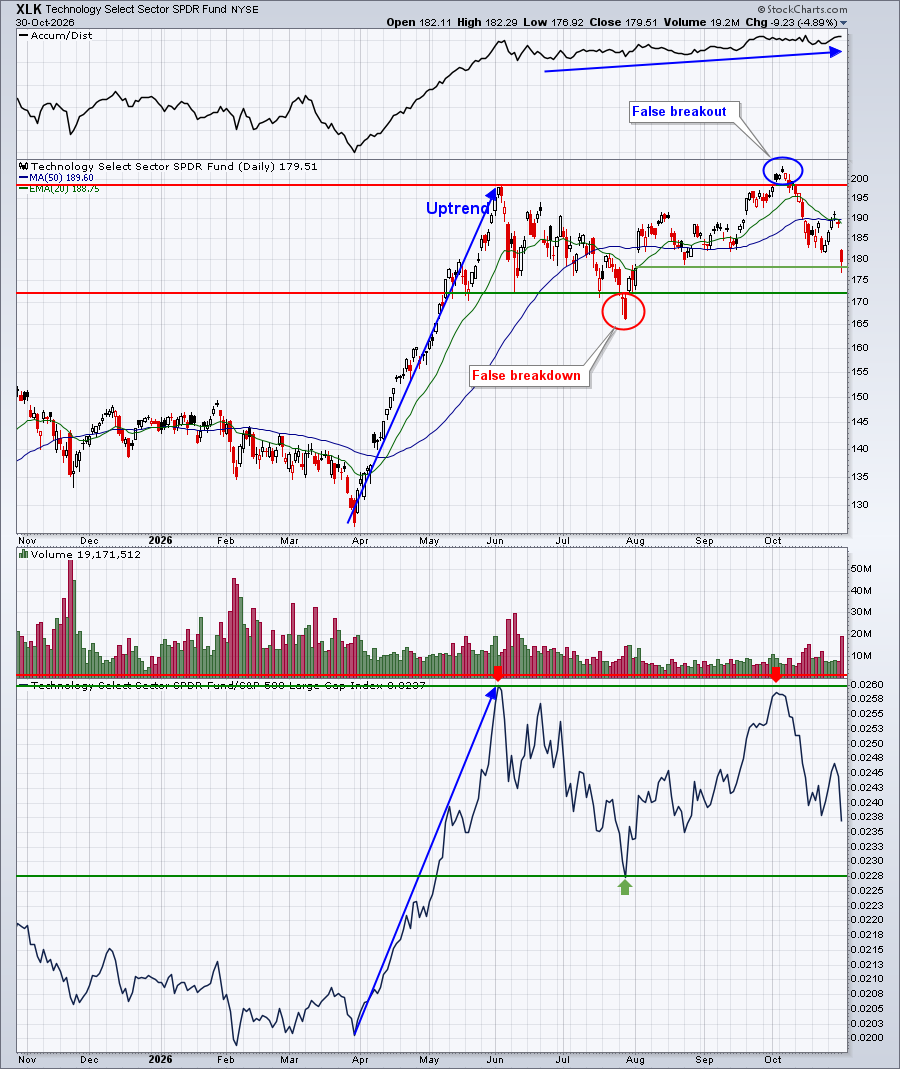
As I look back at the XLK chart, it seems to me that the group continues to consolidated after a powerful advance earlier in 2026. I know it feels weak and like a downtrend on the XLK, but I'll be surprised if the absolute and relative price support on the above chart are violated.
Looking ahead to November, financials (XLF), industrials (XLI), and consumer discretionary (XLY) all tend to significantly outperform the S&P 500 during the month. And as technology weakens, it's providing an opportunity for these 3 sectors to again lead in November 2026:
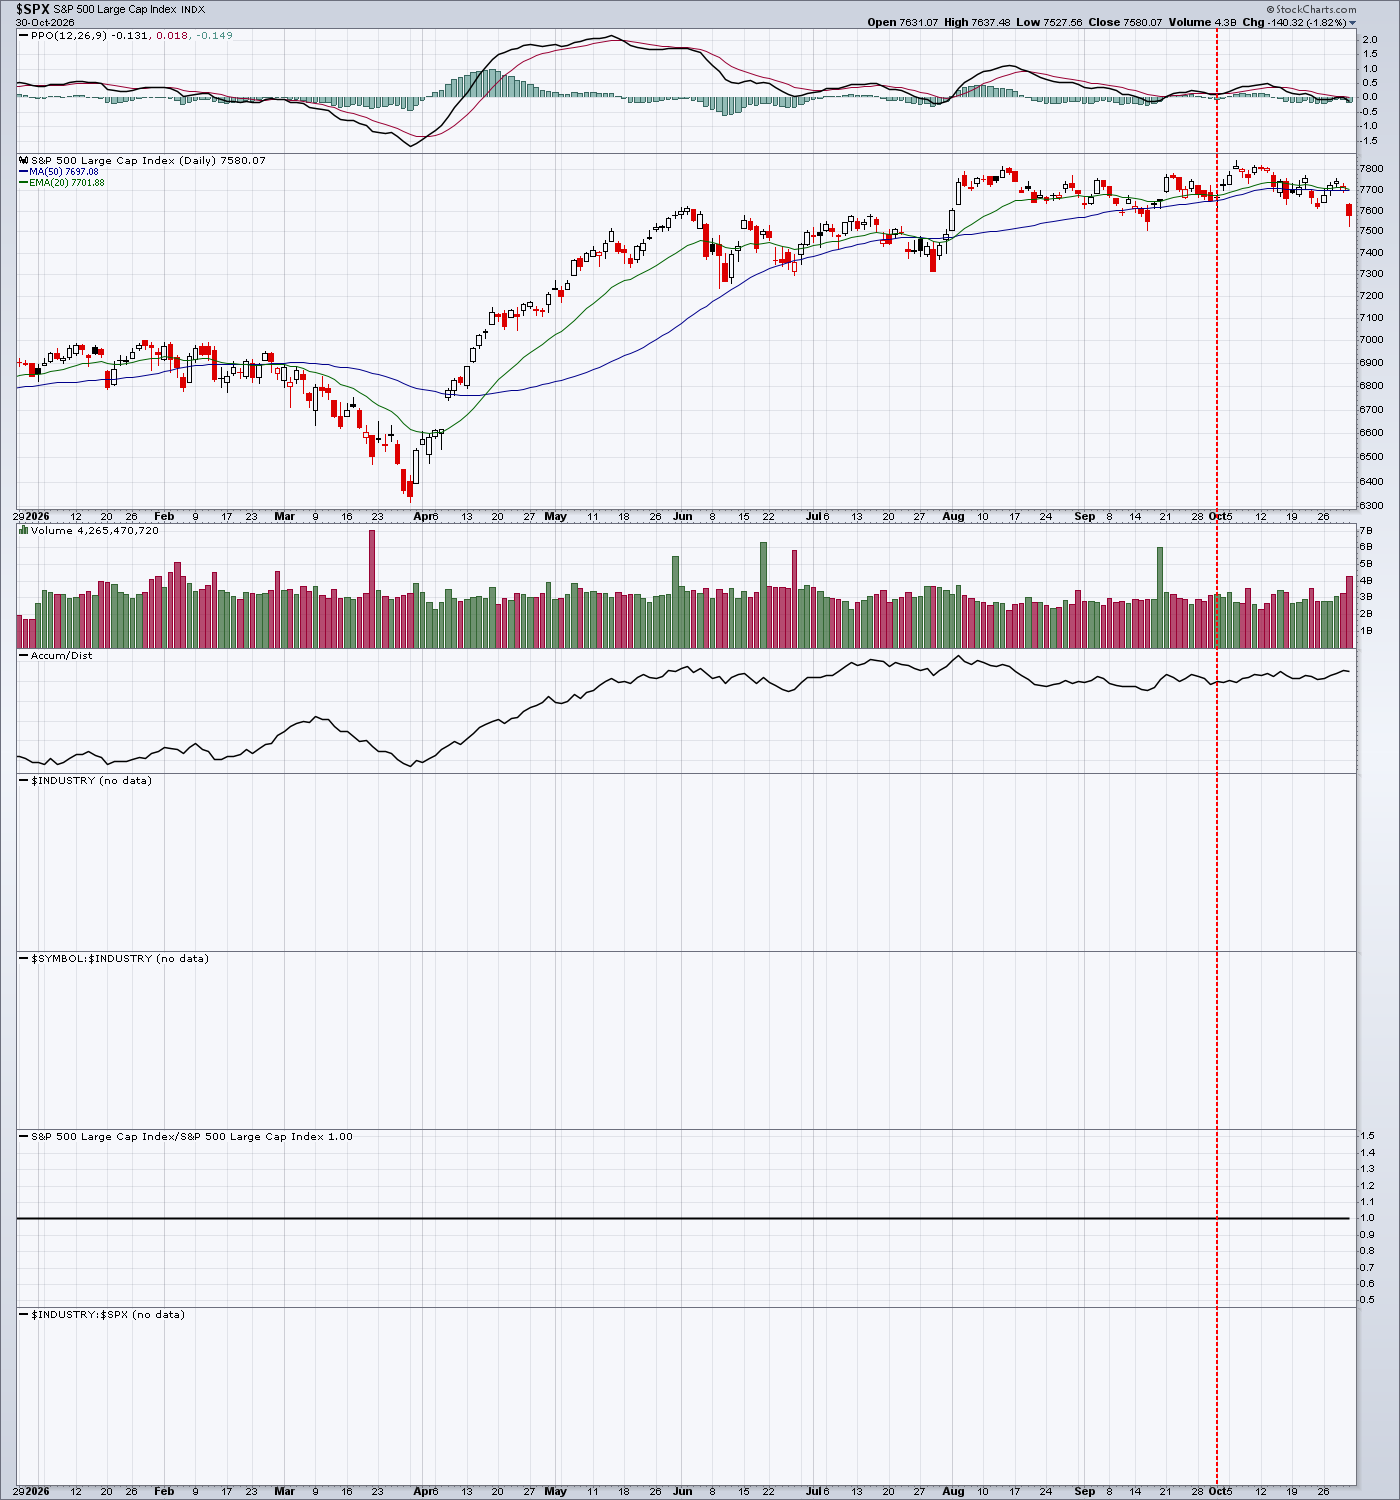
A lot of money is rotating to these 3 sectors right now, but financials appear to be best suited for a continuing rise, especially if the TNX remains under pressure. It hit 4.91% on Friday, its lowest level in 7 weeks.
Industry Performance
Last month, I mentioned that renewable energy ($DWCREE) and computer hardware ($DJUSCR) tended to lead the way among technology stocks in October, though only computer hardware looked strong technically as we opened October.
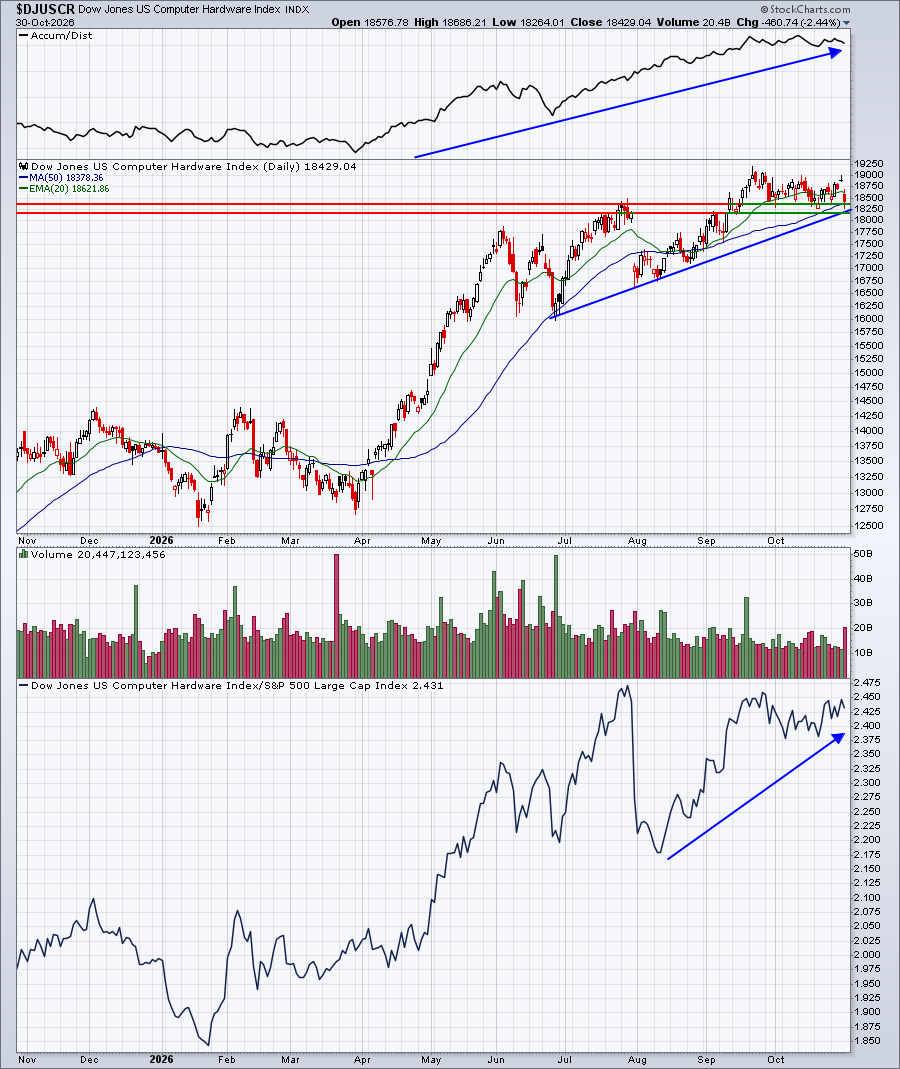
The DJUSCR still looks good, but just keep in mind that Apple (AAPL), the largest component in this index, reports earnings early next week and will carry a potentially huge impact for the entire group.
Looking ahead to financial industry groups that perform well in November, I'd keep a close eye on asset managers ($DJUSAG), banks ($DJUSBK), and investment services ($DJUSSB). They've all come off recent lows and have improved in October, though there's still plenty of technical work to do on each to reverse their primary trends, which are lower. Here's a quick look at all 3:
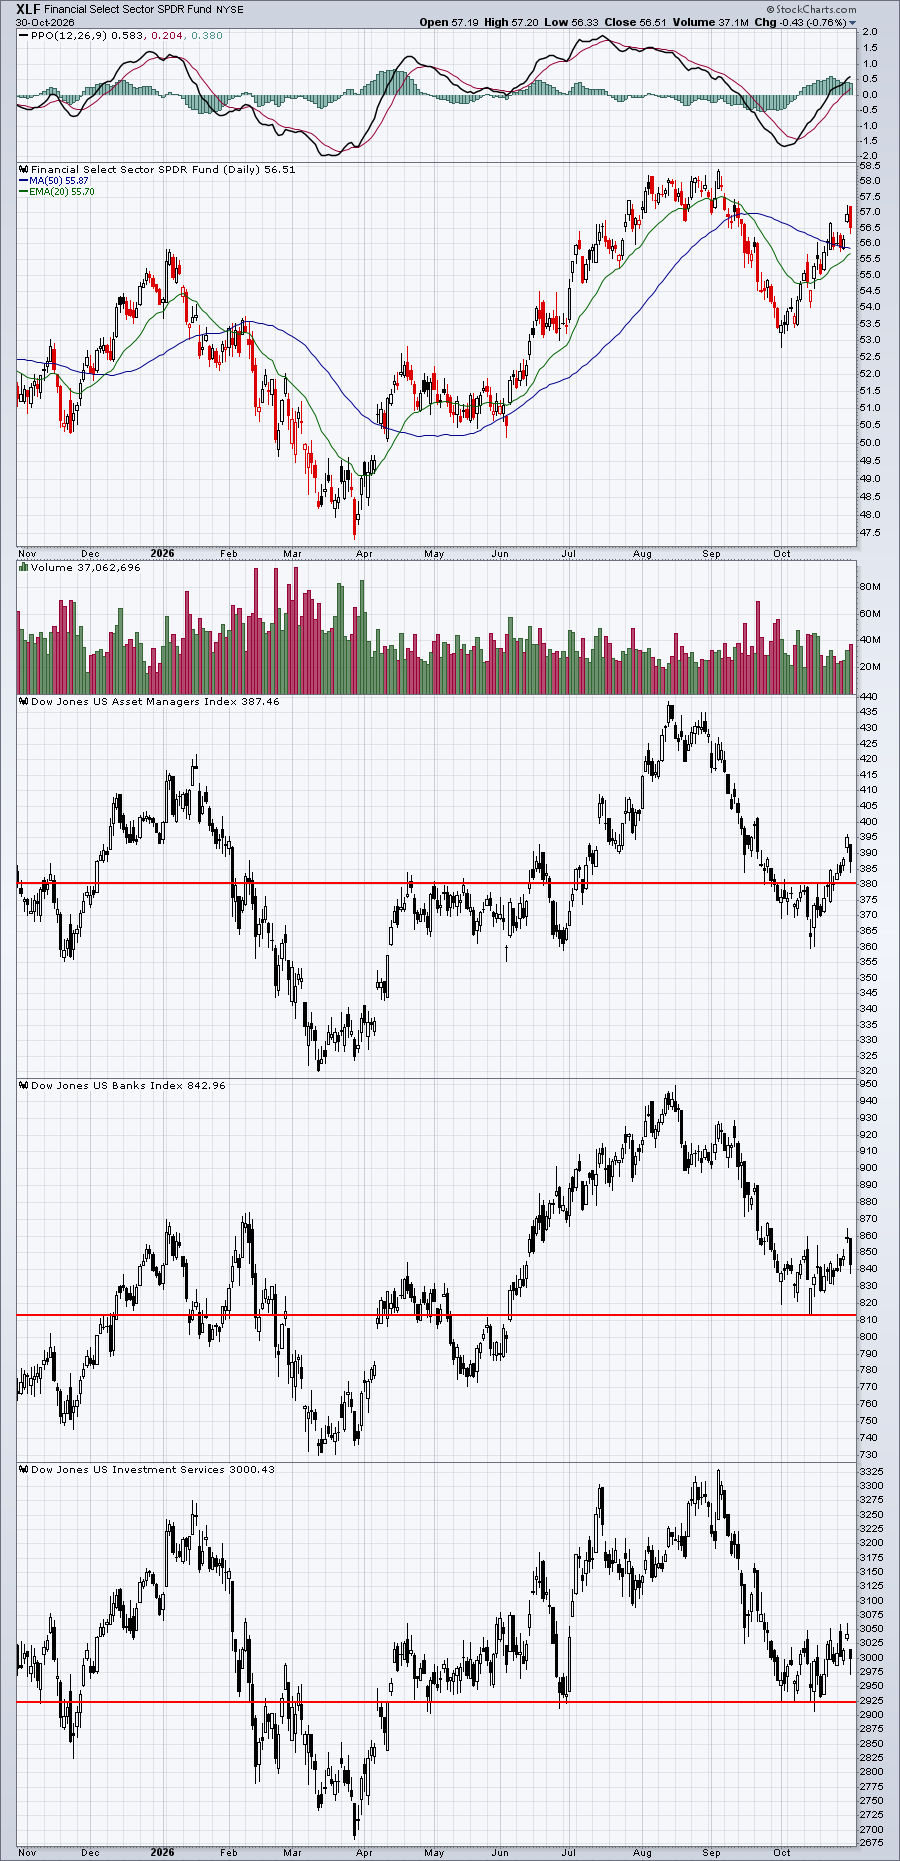
I'd like to see each of these groups hang onto the support lines drawn. Ultimately, they need to break back above recent highs to truly reverse the character of their respective charts.
Here are all industry groups that tend to perform much better than the benchmark S&P 500 during November, broken down by sector:
Technology (XLK):
- semiconductors, electrical components, electronic equipment
Consumer Discretionary (XLY):
- autos, tires, home construction, apparel retail, clothing & accessories, footwear, hotels, gambling, durable household products, furnishings, home improvement retailers, recreational products, recreational services, specialized consumer services
Communication Services (XLC):
- publishing
Industrials (XLI):
- airlines, aerospace, railroads, industrial suppliers, commercial vehicles & trucks, heavy construction, trucking, building materials & fixtures, industrial machinery, delivery services
Financials (XLF):
- asset managers, banks, investment services, life insurance,
Health care (XLV):
- none
Consumer staples (XLP):
- drug retailers, food retailers & wholesalers
Real estate (XLRE):
- real estate services, hotel & lodging REITs
Utilities (XLU):
- none
Energy (XLE):
- none
Materials (XLB):
- aluminum, nonferrous metals, steel
Stocks for November
A "Seasonality - November 2026" ChartList (annotated with 1 or 2 support levels to watch) has been created and will be available over the weekend on our website. We are now providing the top-performing stocks in November from the S&P 500 large cap index, S&P 400 mid cap index, and S&P 600 small cap index. There are 75 stocks on our Seasonality - November 2026 ChartList for you to review.
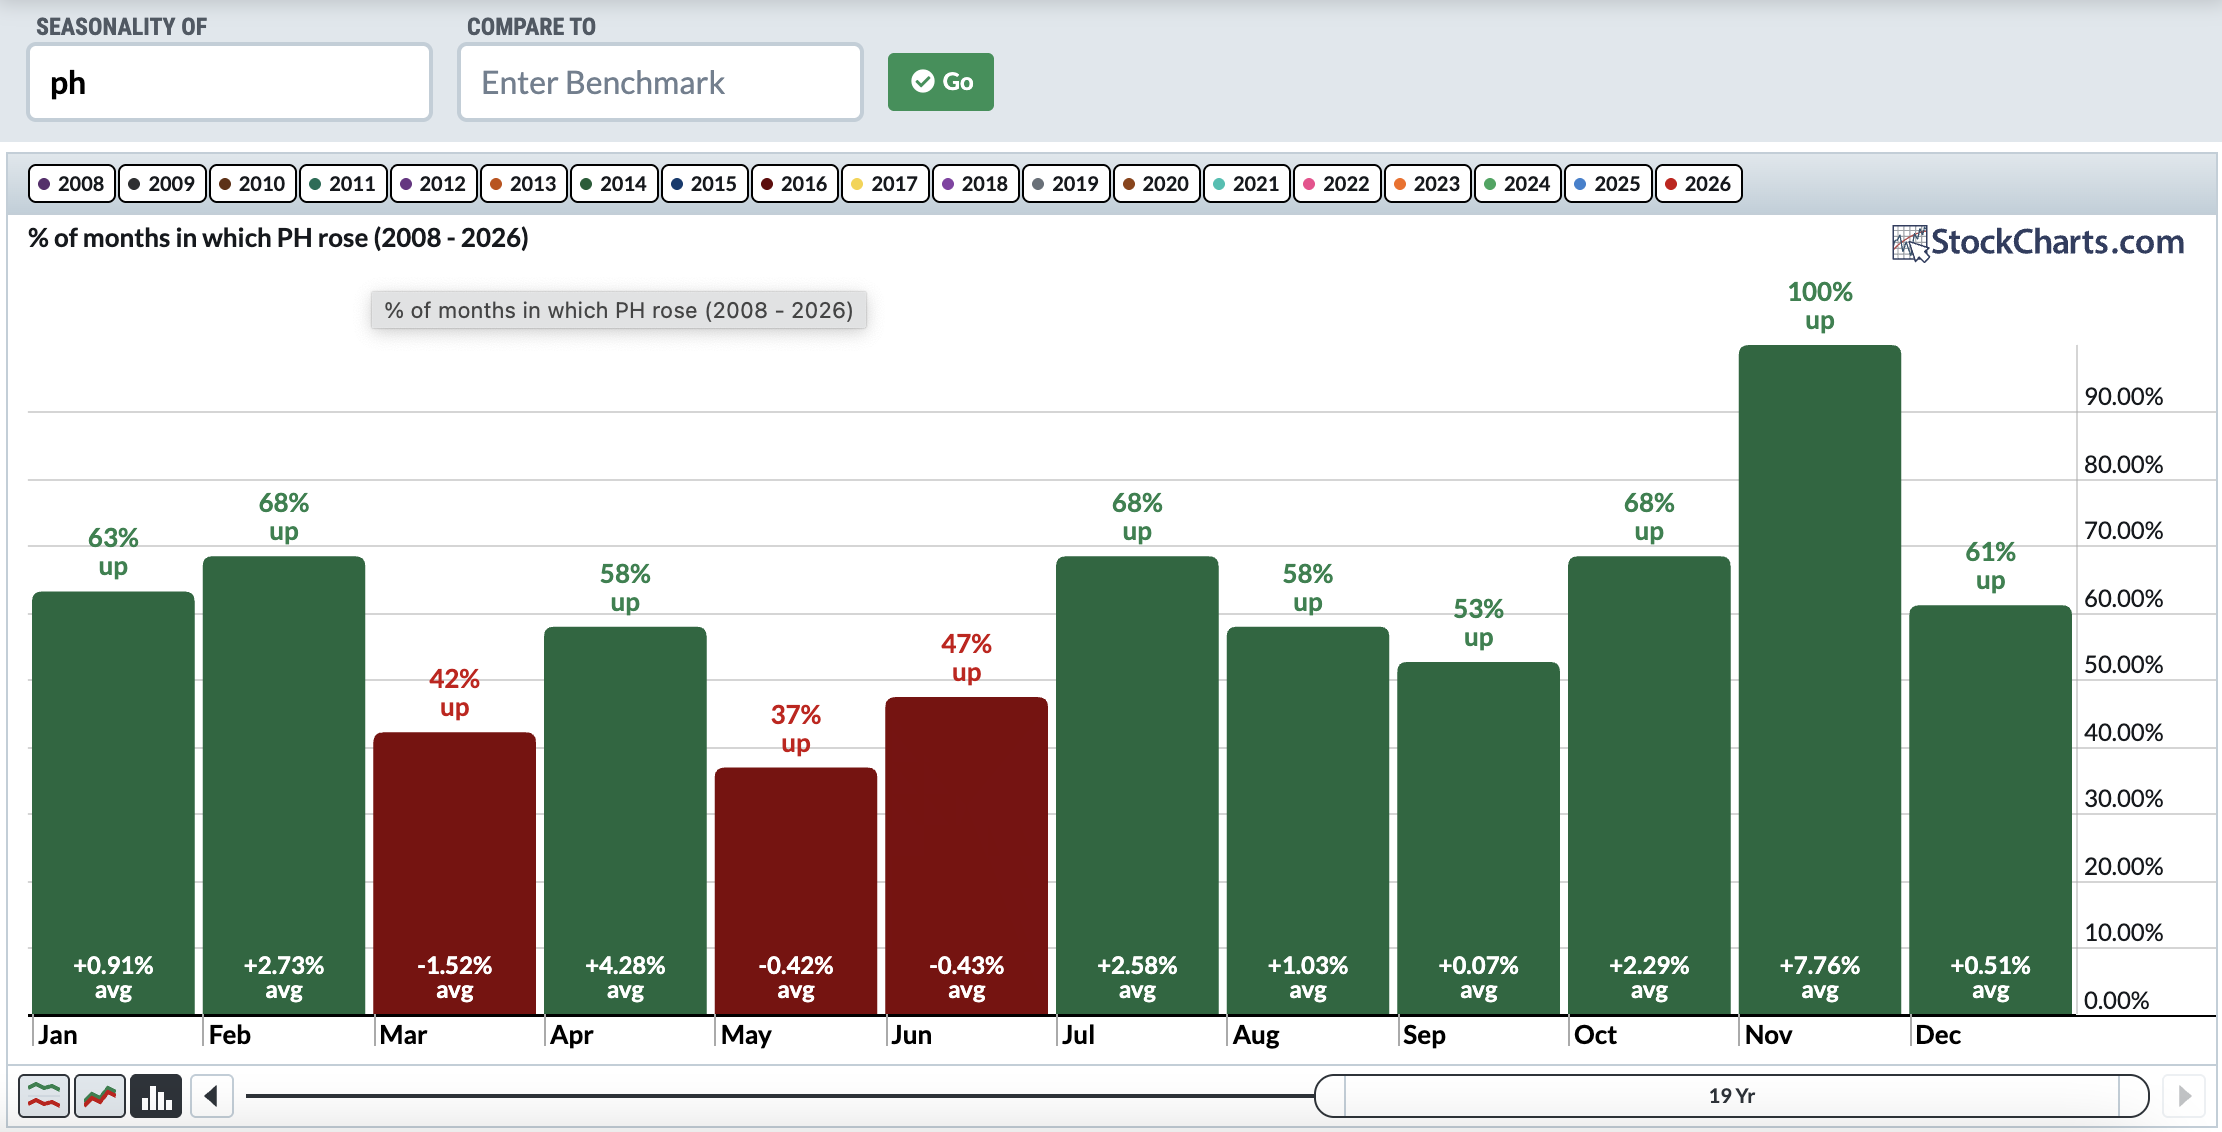
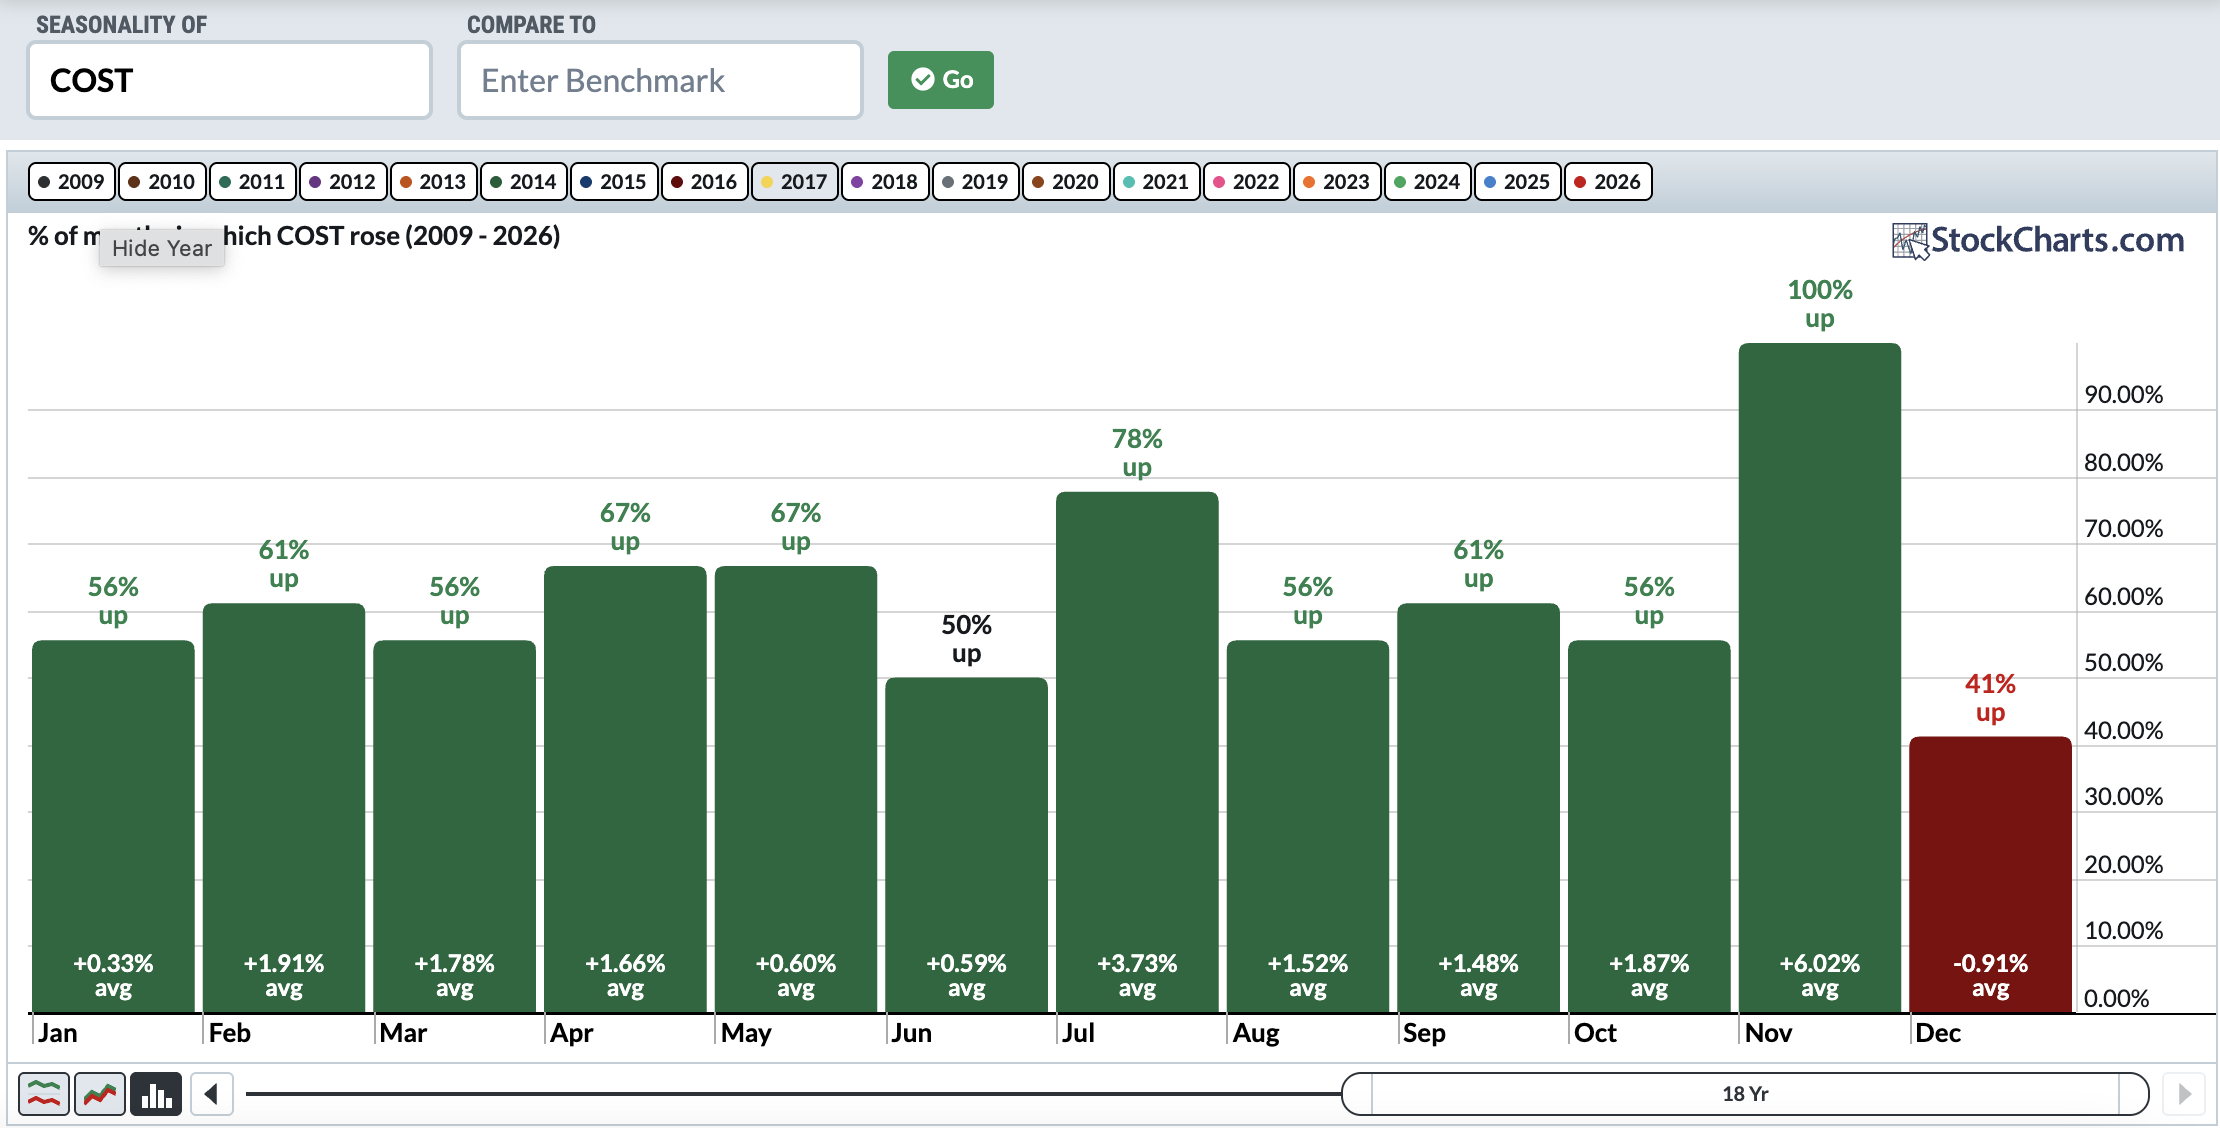
I also have added a new feature this month, providing the 20 stocks on the S&P 1500 that have the longest winning streaks in the month of November. I provided Seasonality Charts for the first two to highlight what I'm referring to. Here they are:
- PH - 19 yrs
- COST - 18 yrs
- IEX - 18 yrs
- HNI - 17 yrs
- AFL - 15 yrs
- ITW - 15 yrs
- MAS - 15 yrs
- ALV - 15 yrs
- PIPR - 15 yrs
- PHM - 14 yrs
- MTB - 14 yrs
- PFG - 14 yrs
- NVR - 14 yrs
- CASY - 14 yrs
- KNX - 14 yrs
- FHI - 14 yrs
- AX - 14 yrs
- HTLD - 14 yrs
- TFIN - 13 yrs
- SFBS - 13 yrs
You must be a StockCharts.com Extra or Pro member to download our ChartLists. Basic members and non-StockCharts.com members can view the charts one at a time.
Happy trading!
Tom