
EB Weekly Market Report - Monday, September 11, 2023
Thanks to everyone that provided feedback after our first EB Weekly Market Report last week. We've read every comment and intend for this report to evolve over the next few weeks based on changes that we believe make sense, along with making a few changes based on your suggestions. One change that we absolutely are trying to address is how our report appears in your email. We understand it's annoying to scroll back and forth to read our content. The appearance currently depends on your email provider, but we'll have a solution that will work for everyone. Please continue to provide us your feedback. You can reach out to us at "[email protected]". Again, we read every comment so now is a GREAT time to have your voice heard.
Below is our second EB Weekly Market Report. We intend to publish on either Sunday or Monday of every week, but ultimately we'd like to publish on Sundays - ahead of the opening bell on Monday. If I'm traveling on the weekend, Monday may be our only option. This weekly report replaces our Monday EB Daily Market Report and provides all of our members with a broader "Big Picture" outlook on the U.S. stock market. Our market outlook will focus more on longer-term weekly charts, as opposed to the daily charts more often used in our EB Daily Market Report. We believe it enhances our current product lineup and appeals to everyone - those with a longer-term mindset and those focused primarily on the near-term.
Because of our "top-down" approach to trading, it makes a lot of sense to begin each week with a Big Picture focus, citing the current long-term technical outlook and how that might impact the market given our short-term signals that we discuss daily. Our EB Weekly Market Report will also provide a consistent, once-per-week review at key sentiment and intermarket relationships that we value so highly at EarningsBeats.com and has helped us to guide our members through a very tumultuous 3-4 year period, beginning with the 2020 pandemic, right through the most recent 2022 cyclical bear market and subsequent secular bull market advance.
We'll also review the prior week's action and provide trade setups, but mostly with a longer-term mindset - think of longer-term swing trading, which should appeal to those of you that like the idea of longer-term momentum trading, providing wider stops and targets.
Here's Week 2.
Weekly Market Recap
Major Indices
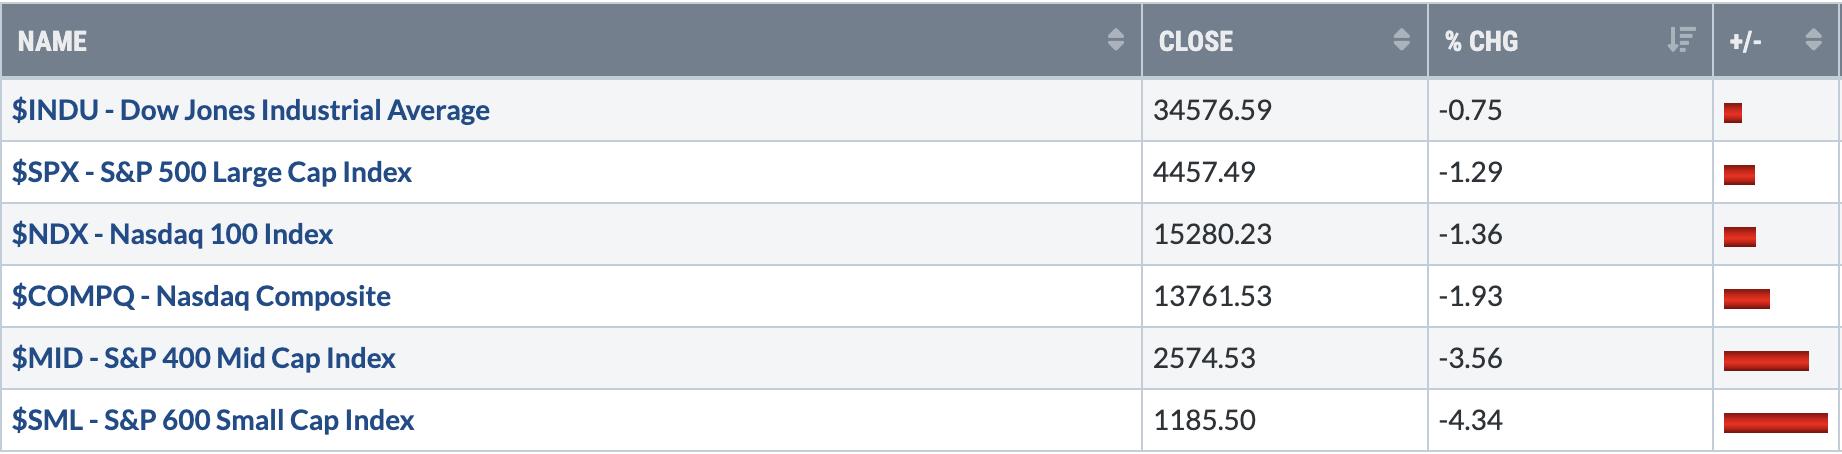
Despite seasonal tailwinds favoring small cap stocks last week, the underperformed rather significantly. Many of my signals still point to a relatively strong small cap group into the end of the year, but I'll continue to evaluate those signals and will let you know if they change. Meanwhile, it was a difficult week for all of our indices as they all finished in negative territory. The good news is that the majority of our key indices are trading above their 20-week EMAs, a bullish signal. The mid caps and small caps both trade slightly beneath their respective 20-week EMAs, but the 50-week SMAs have mostly held thus far.
Sectors
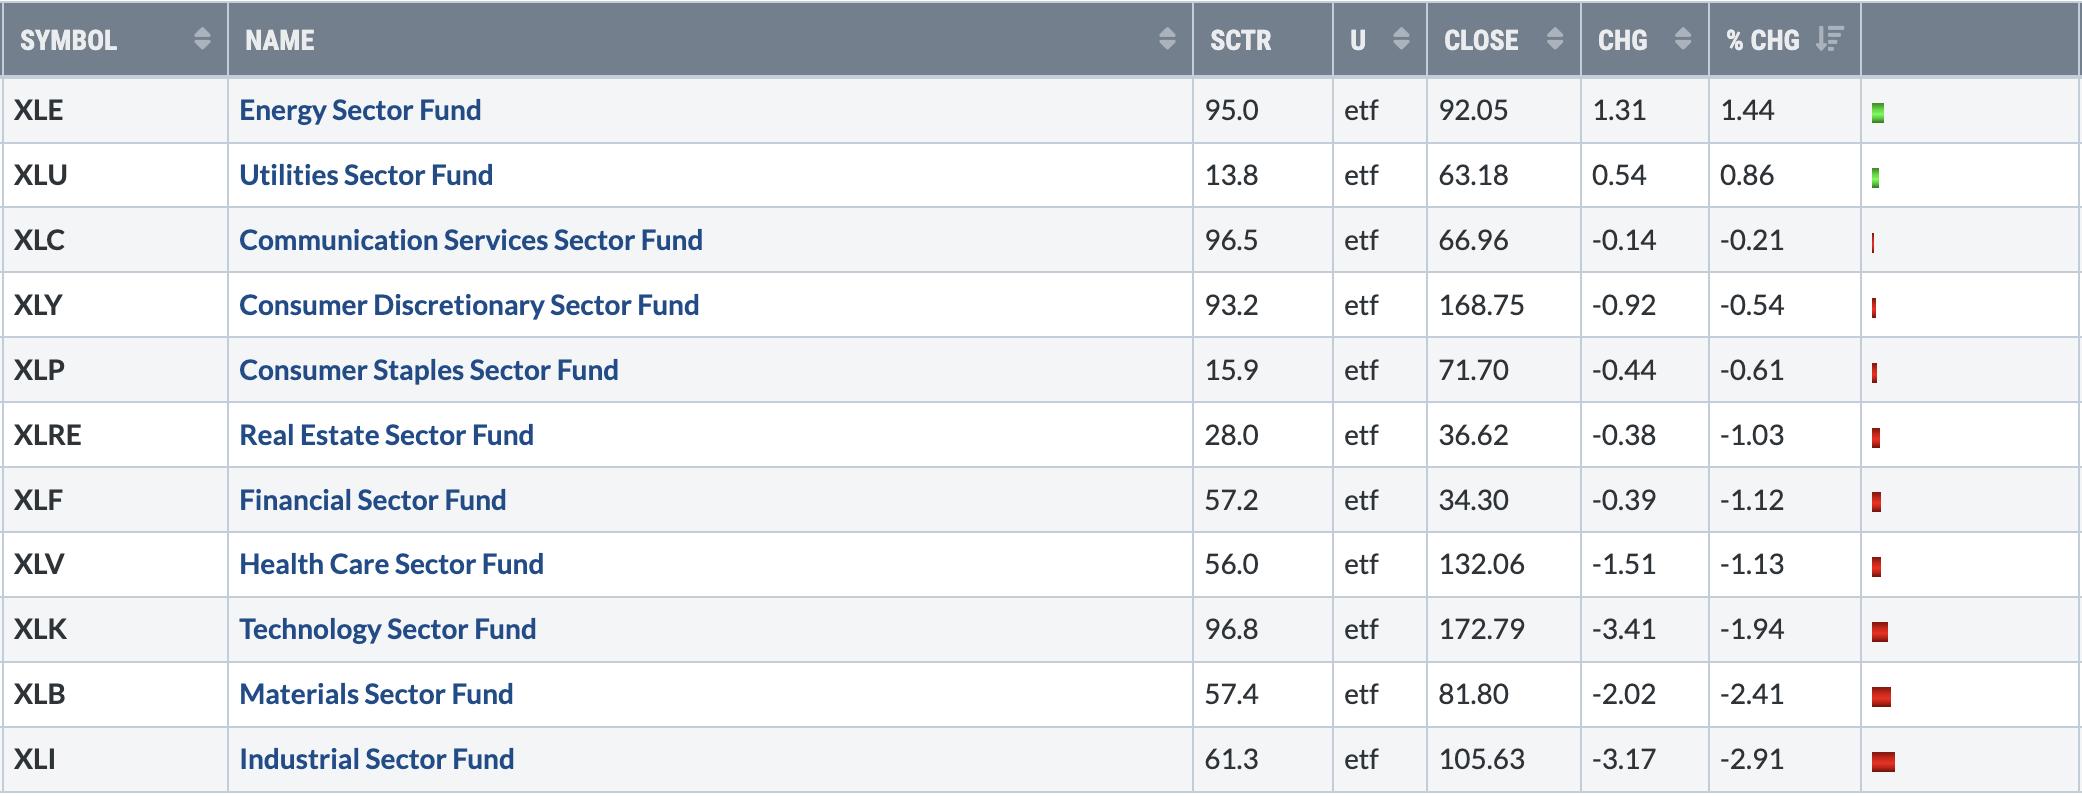
Energy's strong week was primarily due to the rise in crude oil prices ($WTIC, +2.29%) last week. Otherwise, it wasn't a very good week for the bulls, except for the slight gain in utilities (XLU). There wasn't a huge selloff in aggressive sectors either, though, as both communication services (XLC) and consumer discretionary (XLY) were barely lower. Also, the latter discretionary group outperformed its staples (XLP) counterparts, which is never a bad thing.
Top 10 Industries Last Week
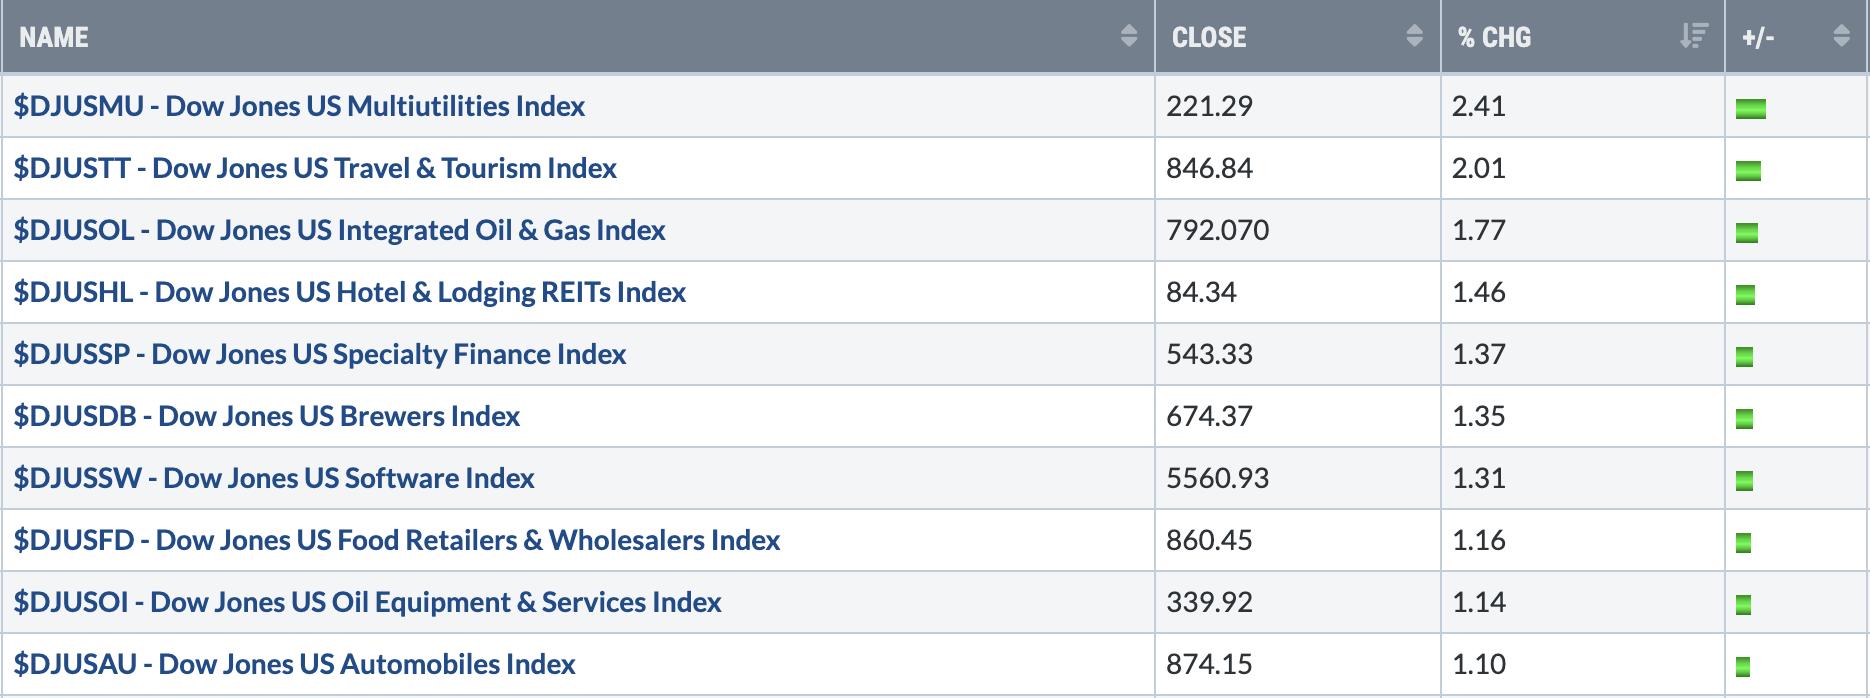
The strength in multiutilities ($DJUSMU) came at a very good time technically, as the group tested more-than-two-year lows:
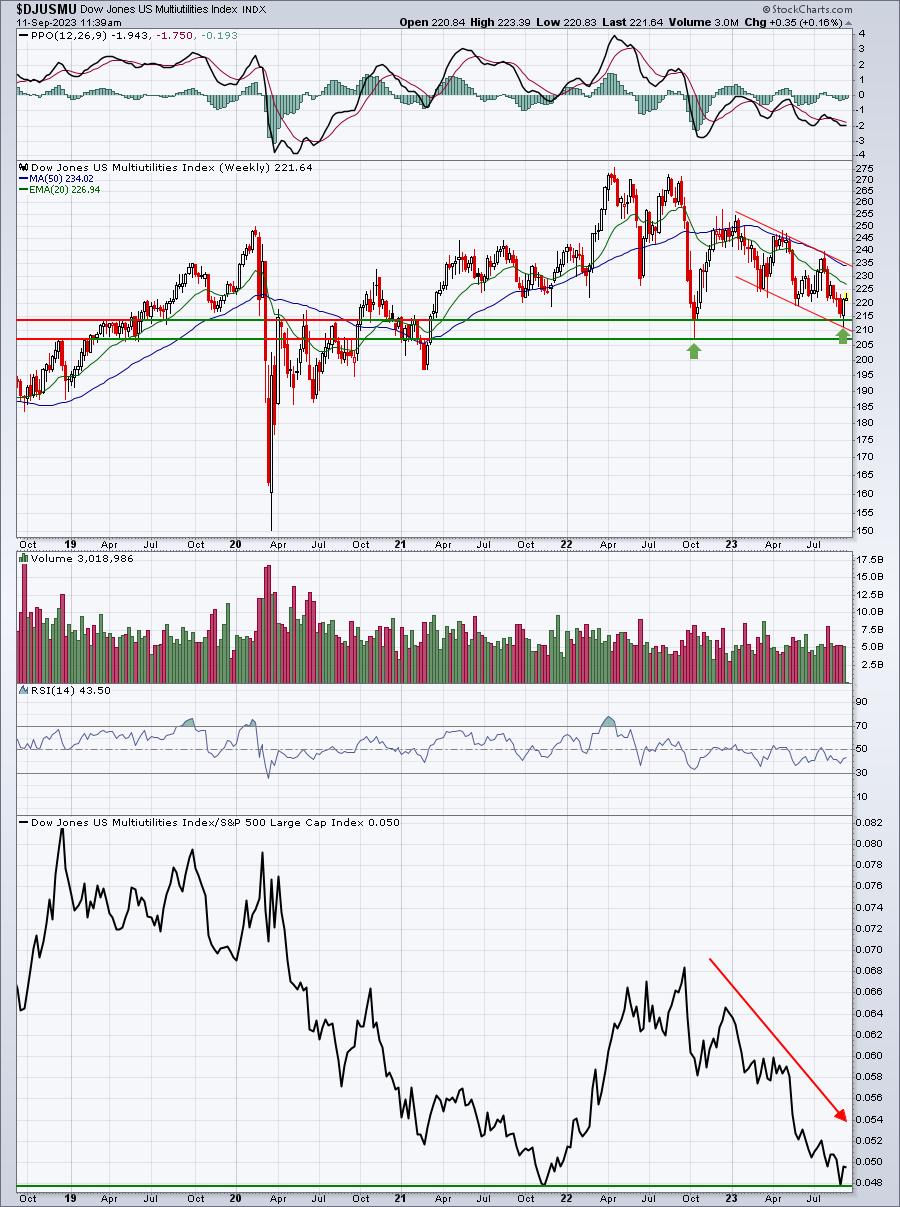
In the Big Picture, I don't like to see groups like DJUSMU lead, because it's a sign of rotation to defensive areas of the market. I want them to rise on an absolute basis, but underperform on a relative basis. From the bottom panel of the chart above, you can see that there's been plenty of relative underperformance, which is typical of a secular bull market advance, as the DJUSMU just tested a 5-year relative low.
Bottom 10 Industries Last Week
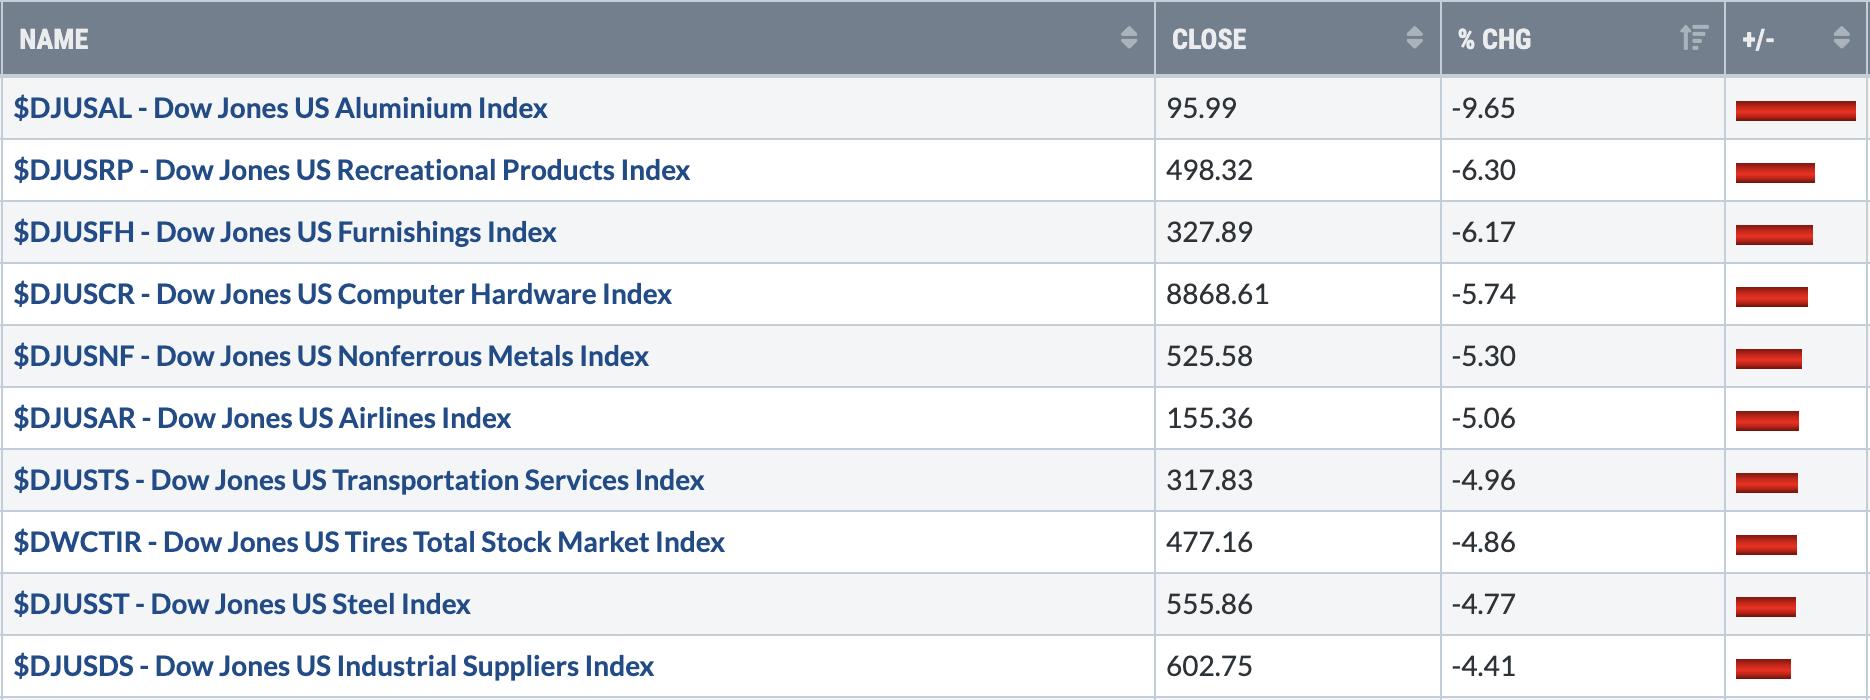
Three groups above are included in the materials sector (XLB). They are aluminum ($DJUSAL), nonferrous metals ($DJUSNF), and steel ($DJUSST). While we don't have a lot of recent history dealing with inflation, we do have a brief period of rising inflation back from 2004 through 2006. When inflation topped, the subsequent period was not very kind to materials stocks. In my opinion, we have topped in core inflation ($$CCPI) and we're watching inflation slowly decline back towards the Fed's 2% target. I don't believe that'll be a very good environment for materials stocks and last week's relative drop is something we should expect for many months to come. Here's the chart:
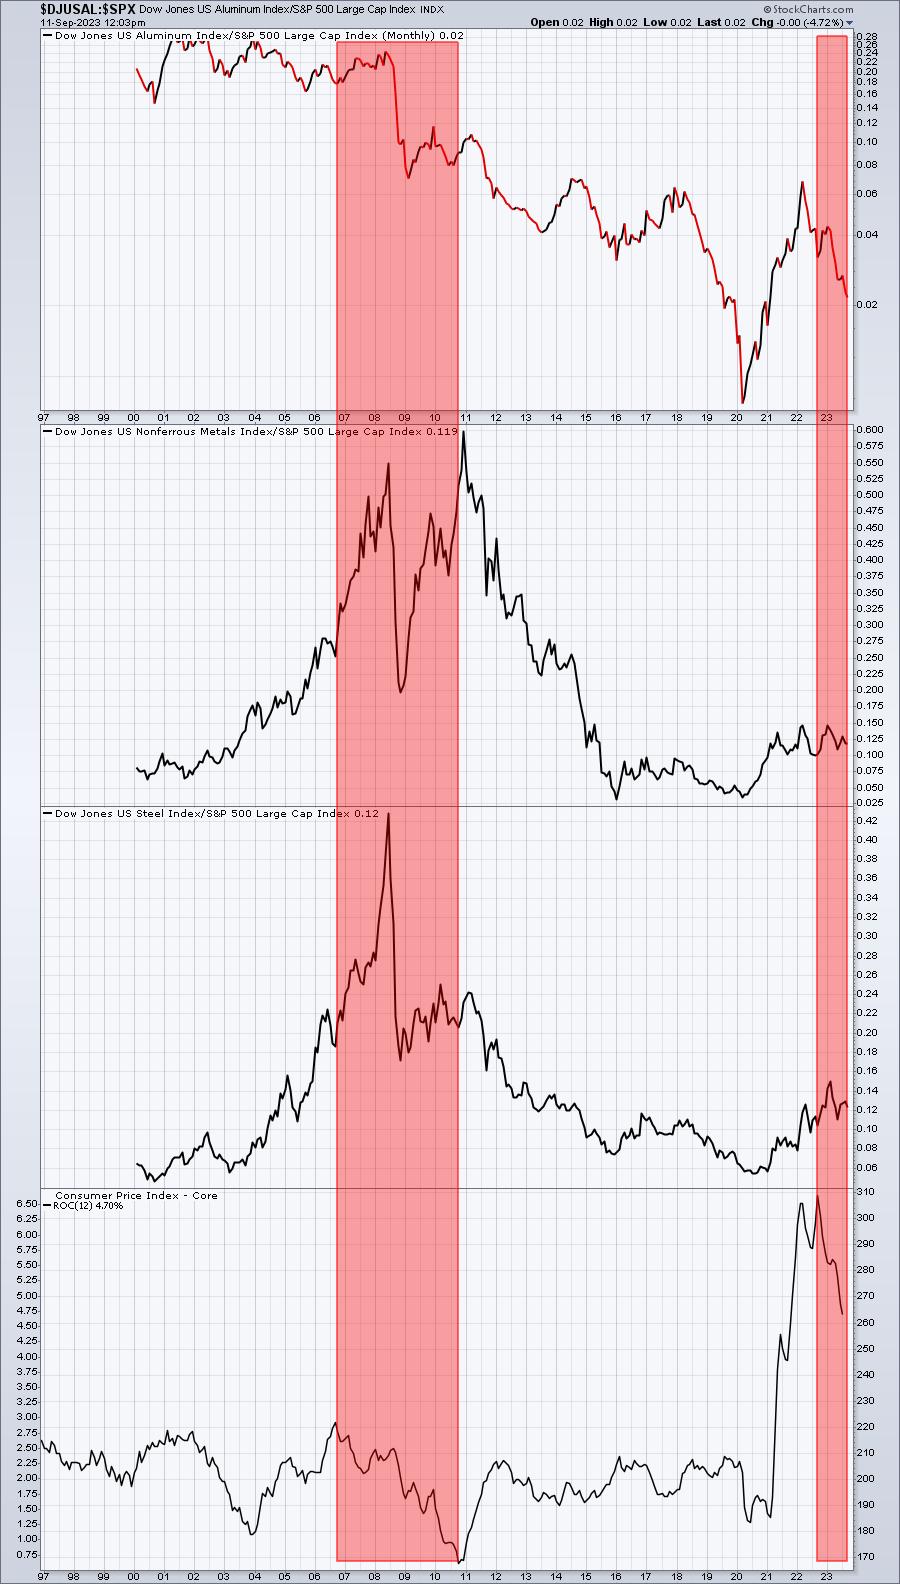
The annual inflation rate (Core CPI) has fallen back to 4.70%, well off the 6.50% rate that we saw in the 2nd half of 2022. We can have commodity-led bull markets, but I do not believe this is one of them. Materials performed quite well when inflation was rising, but we are now on a path to 2%. I just don't see this group outperforming the S&P 500 for the foreseeable future, unless I'm wrong about lower inflation ahead.
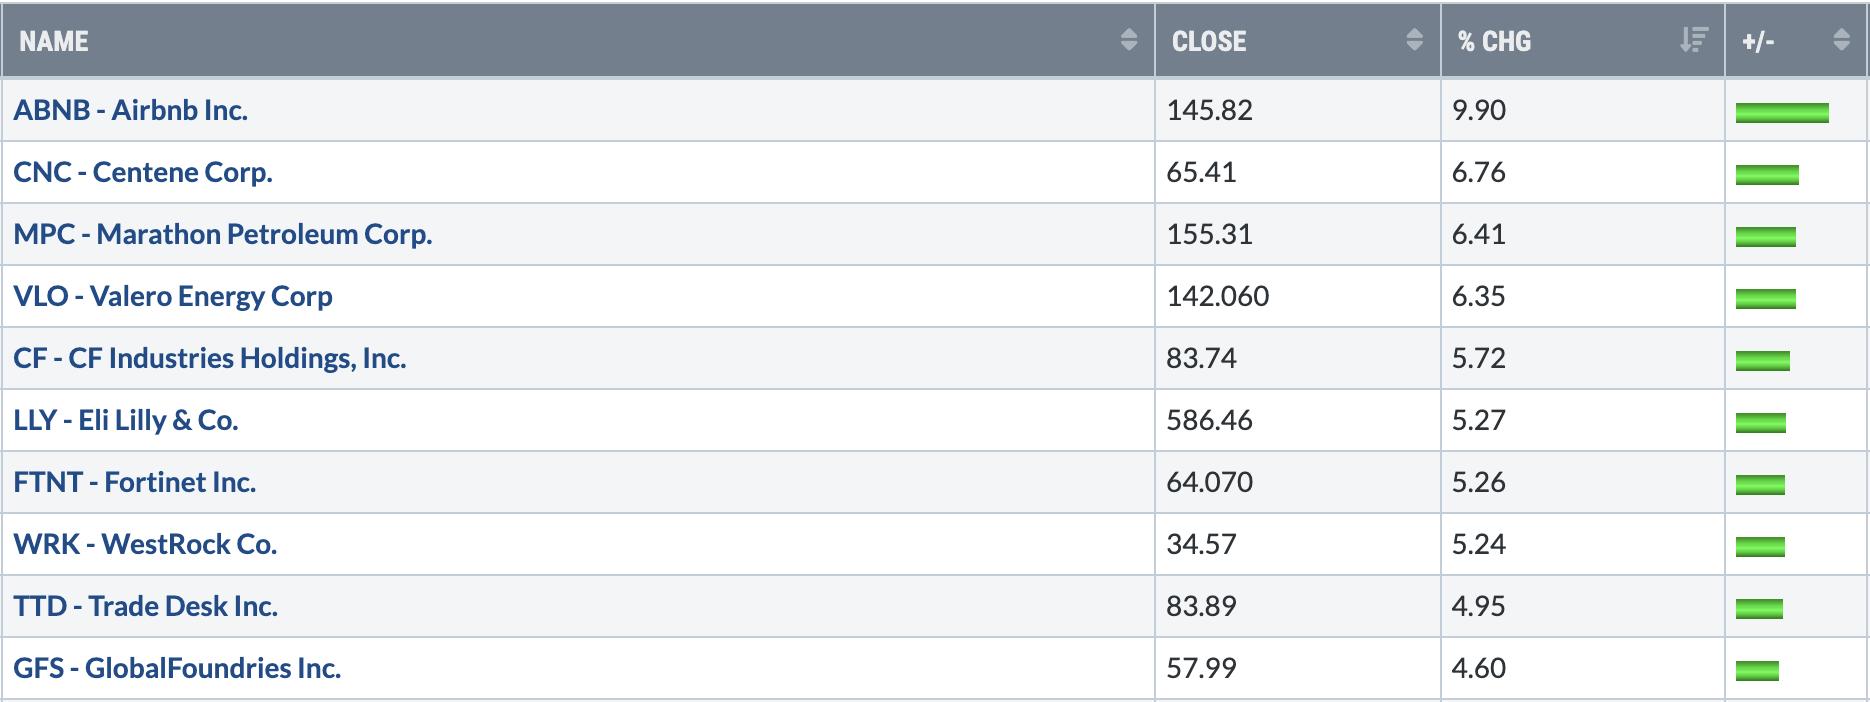
Top 10 Stocks - S&P 500/NASDAQ 100
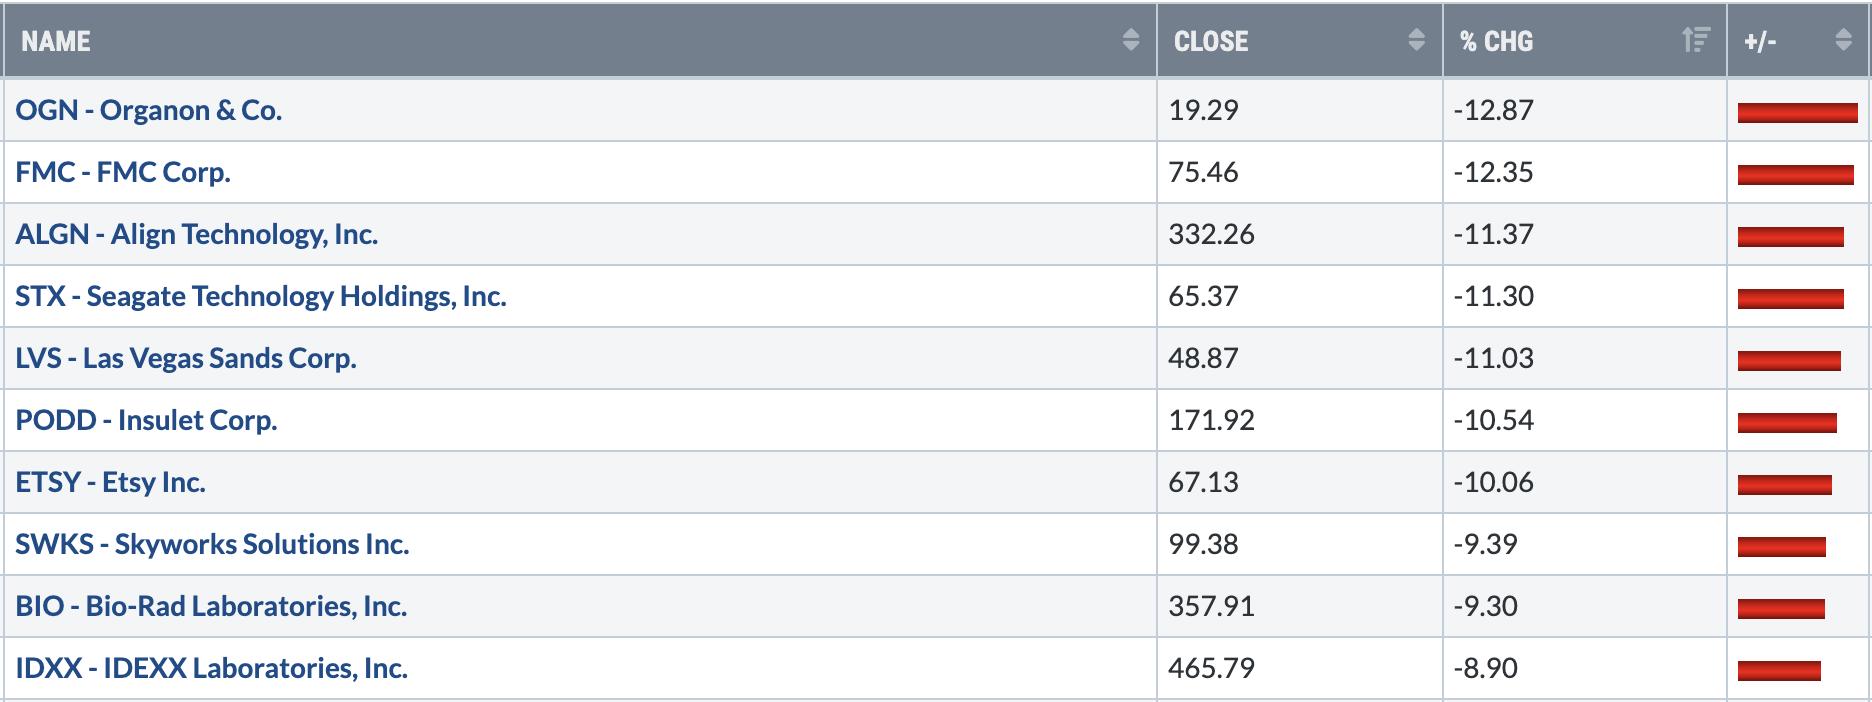
Bottom 10 Stocks - S&P 500/NASDAQ 100
Big Picture - September 2023
This is a chart that doesn't change much from week to week. Accordingly, beginning in October 2023, I will only provide this chart in the first EB Weekly Market Report of each calendar month.
For now, here's a quick refresher on what I provided last week. For more details on the chart, please refer to last week's EB Weekly Market Report:
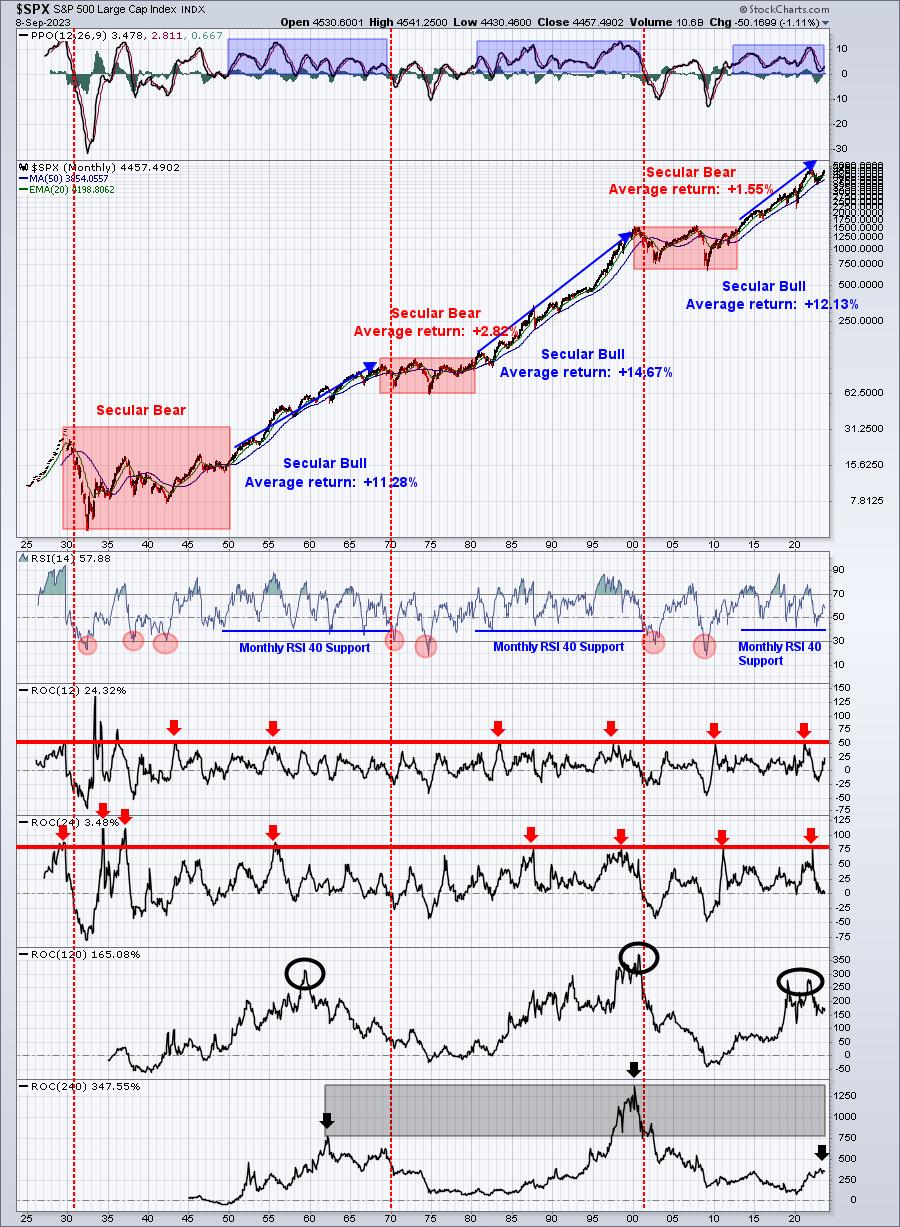
September Update:
Please refer to last week's commentary. Suffice it to say, I remain very bullish based on this long-term PERSPECTIVE. It's extremely important that we ALWAYS keep this chart in mind when evaluating the market from week-to-week or month-to-month.
Major Indices
Last week, we looked at the 15-year weekly chart on the S&P 500. This week, let's see how that compares to the NASDAQ 100 ($NDX):
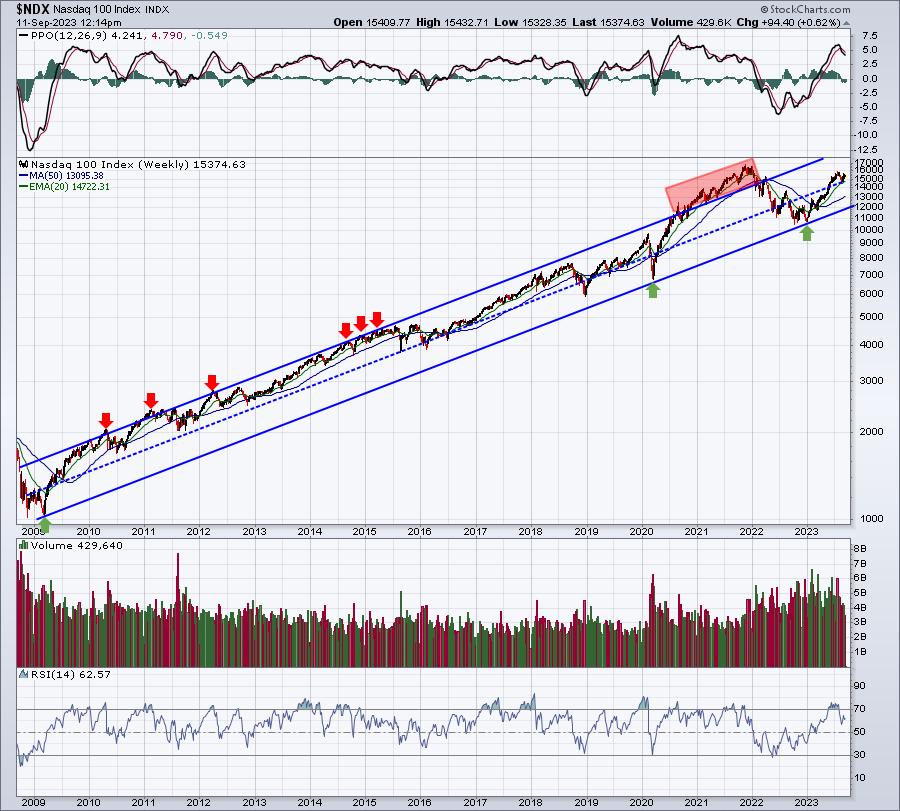
One difference that I immediately spotted is that our 2009, 2020, and 2022 bear market lows connect perfectly. Clearly, this is a MAJOR channel support line. However, a big similarity is that every time we've moved outside the top channel line, we've encountered difficulties. From a Big Picture perspective, moves outside this channel are simply unsustainable - even for a secular bull market. Currently, we're trading almost squarely in the middle of this channel, which leaves us PLENTY of upside room on a relative basis in the years ahead. For those who insist we're going to move lower, you can see that, historically, we don't spend a lot of time in the lower half of this channel. Most of our time has been in the upper half, which is quite encouraging for those of us in the bullish camp.
Sentiment
Equity-only put-call ratio ($CPCE):
I use two primary CPCE signals, one short-term (speed boat) and the other long-term (ocean-liner). The stock market repeatedly moves higher and lower in both uptrending and downtrending markets. But once you've established the primary trend, which, in my opinion, is clearly higher (see NASDAQ 100 chart above), you can apply the 5-day equity only put call ratio ($CPCE) to help spot key short-term market tops and bottoms. Recently, the pendulum swung to extreme pessimism, which helped me call a bottom in mid August. Check it out:
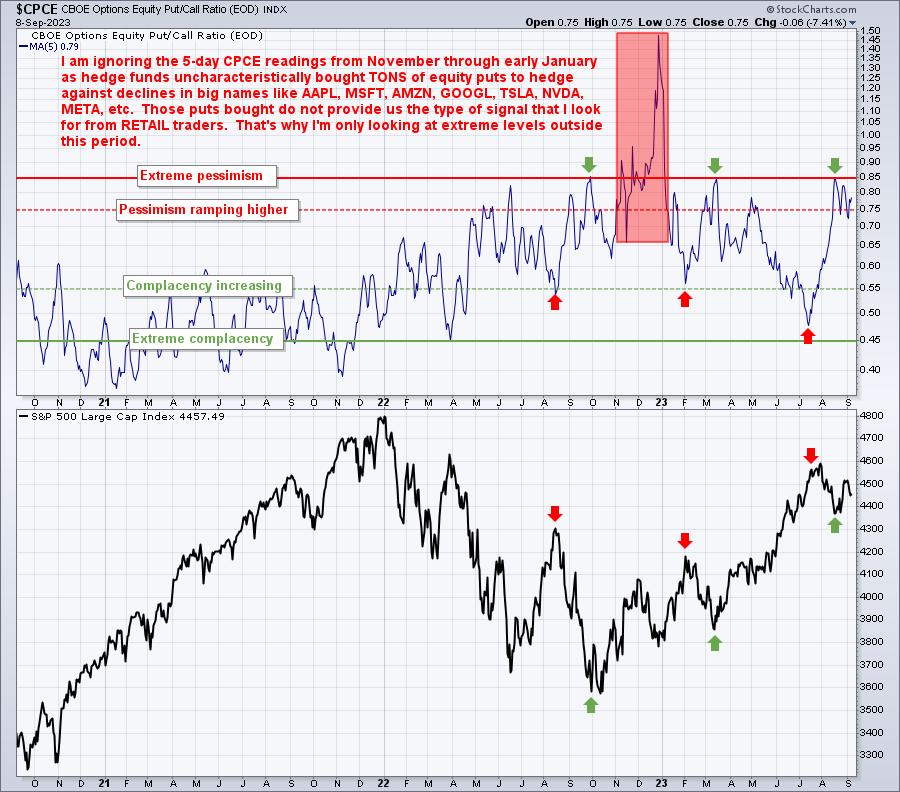
Last week's selling left retail traders still extremely pessimistic, which could help to limit downside action in the 2nd half of September. If we do move lower in the next 2-3 weeks, it'll likely be a MAJOR bottom based on the already-elevated put call readings.
The "ocean-liner" 253-day moving average of the CPCE will be provided once per month, unless the environment changes and dictates otherwise. Its current signal remains VERY bullish for the intermediate- to long-term (at least the next 2-3 years).
Volatility Index ($VIX):
The VIX "environment" is much different in 2023 than it's been at any time in the prior 5 years. Let me explain first with a chart:
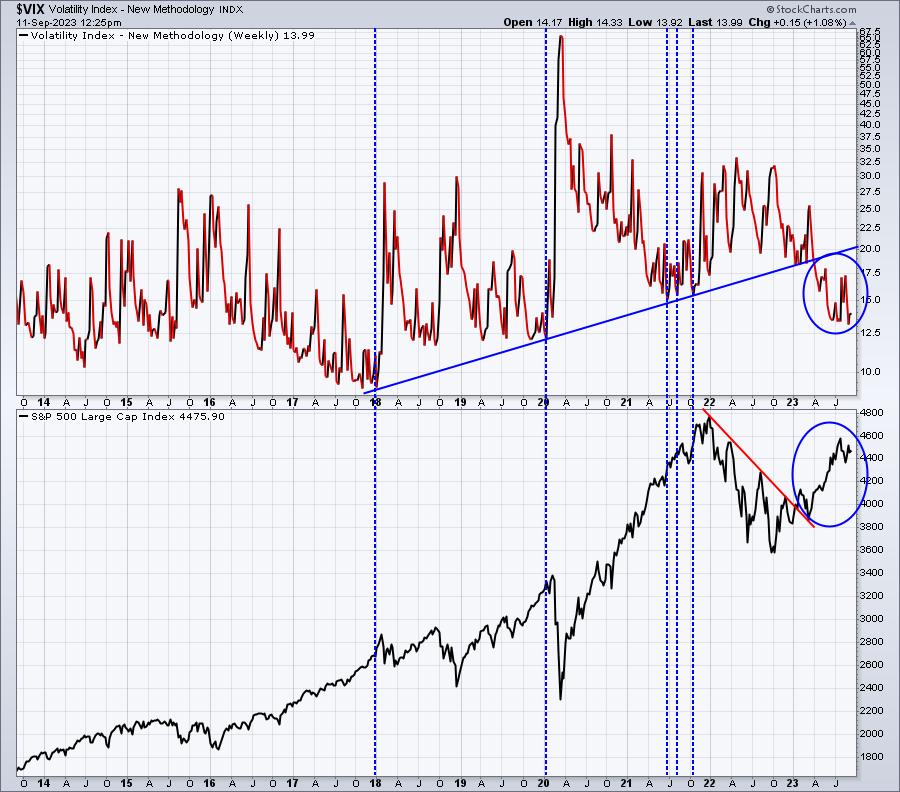
We know that the VIX typically moves opposite the S&P 500. But when we go through periods when the S&P 500 rises ALONGSIDE the VIX, we can be in trouble. Here's my reasoning. If the VIX keeps pushing higher it means the expected volatility is higher. Market makers are increasing the premiums on options. They do this to help protect themselves from more violent moves ahead. In other words, nervousness is INCREASING. As the S&P 500 rises too, it creates an uncomfortable feeling for me, one that suggests that the stock market will NOT handle bad news very well. The VIX lows were going higher and higher from 2018 through 2021 and I annotated it with a rising trendline. Note that the S&P 500 continued to print higher highs throughout these 4 years. The fear level increased with each new high, a Big Picture warning signal, in my view. When other bearish signals came together in late-2021 simultaneously, it triggered a CYCLICAL bear market - the 14th bear market since 1950.
But look at what the VIX has done on this chart in 2023! That uptrend line has been broken. This tells me that market makers do not see big volatility, or lower prices, ahead. Market makers believe we're going higher. Retail traders, based on the high CPCE readings, believe we're going lower. Who ya putting your money on?
I'll take the market makers EVERY SINGLE TIME. We're going higher, though there's always the chance that the second half of September rears its ugly head again. The further we drop, the better the opportunity. That's how I'm looking at it.
Options Expiration Week
We published our latest Max Pain Report yesterday, which shows that we could have some downside this week. We'll discuss this in more detail tomorrow afternoon during our monthly Max Pain event that begins at 5:00pm ET.
The impact of options expiration can be felt at various times. Normally, we see peculiar behavior as we move closer to options-expiration Friday, which is this Friday, September 15th. Sometimes, however, it stretches into the early to middle part of the following week. Again, we'll discuss all of this tomorrow afternoon.
Intermarket Relationships
Last week, I focused on critical relationships between (1) consumer discretionary (XLY) and consumer staples (XLP) and (2) the NASDAQ 100 ($NDX or QQQ) and the S&P 500 ($SPX or SPY). These are very important signals that tell us if the market environment is risk-on or risk-off. They both also provide us signals about the health of growth stocks vs. value stocks. During secular bull market advances, the XLY typically leads the XLP higher. We normally see the QQQ outperform the SPY. This is historical fact, not opinion. So watching these relationships is critical. I'll plan to look at both of these intermarket relationships on a regular basis (every other week, every third week, possibly once a month, whatever makes sense) in our EB Weekly Market Reports. Checking on them weekly, however, is a bit redundant.
This week, I want to focus on the another key relationship between growth stocks vs. value stocks (IWF:IWD), which is the relationship between large cap growth and large cap value. Check out this 5-year chart of the S&P 500, with the IWF:IWD ratio and correlation in the panels below:
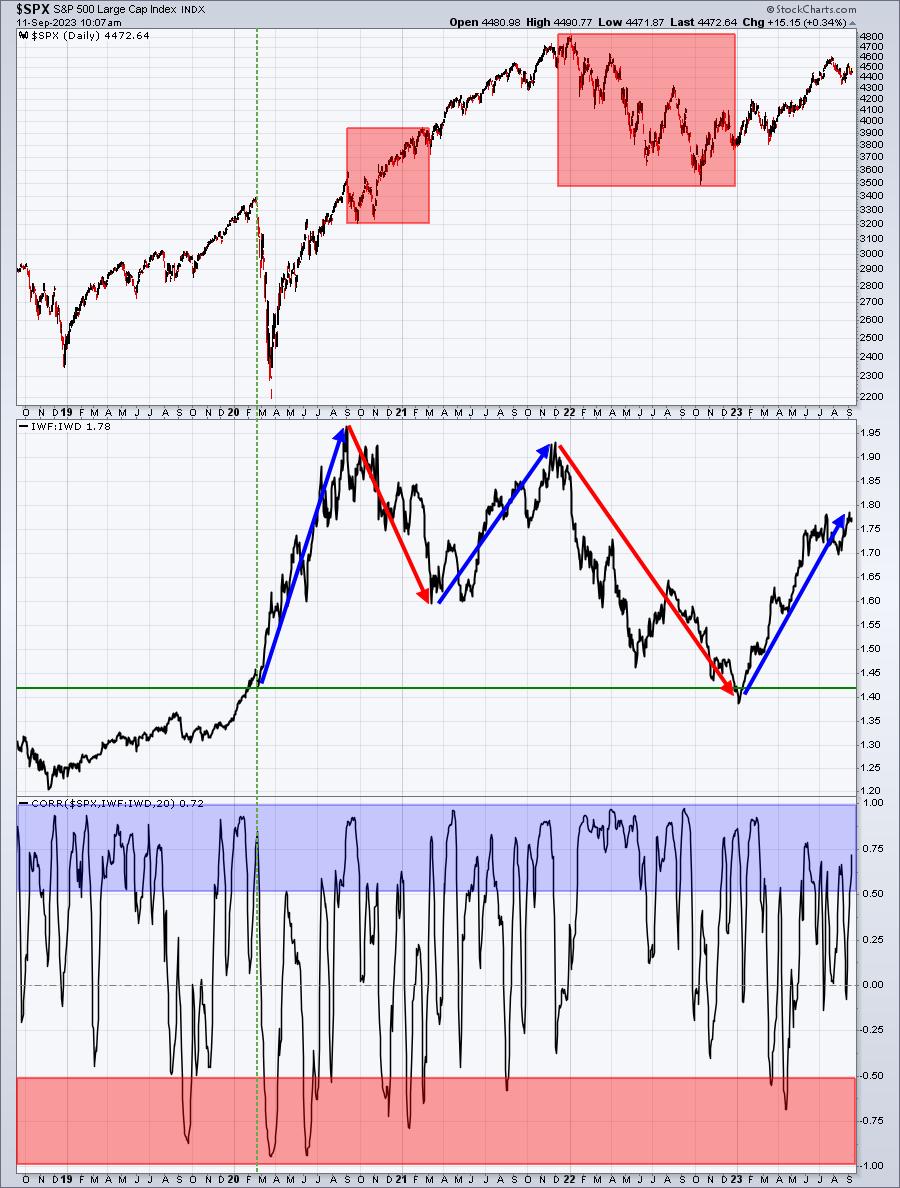
These ratios are quite important as well, helping us to evaluate the strength of market action. If our indices are moving higher, but these ratios are struggling, it's obviously a key signal that value has taken over leadership. That can be a bad thing, but not always - especially if it's only temporary, perhaps a few weeks to a few months.
I've broken down this chart since the start of the 2020 pandemic (green-dotted vertical line) into 5 different periods of strength and weakness on the IWF:IWD ratio. Notice that the 3 periods when this ratio was rising, the S&P 500 exploded higher. However, of the 2 periods that this ratio declined, the S&P 500 performance was mixed. One time (2020-2021), it kept going higher, while the other time (all of 2022), it consistently moved lower. That's why I said when this ratio is dropping, it CAN be a bad thing. But it doesn't guarantee it. We can simply have a period of very bullish rotation where the secular bull market RISING TIDE lifts all boats. That's what happened when value stocks played "catch up" in 2020-2021.
Finally, the bottom panel highlights the positive and negative (inverse) correlation between the S&P 500 and the IWF:IWD ratio. You can see it's positively correlated much more often than it is negatively correlated. It's the reason why I follow this ratio, but don't put the same emphasis on it that I do the XLY:XLP or QQQ:SPY ratios. These latter two ratios have a much more powerful positive correlation with the S&P 500, especially the XLY:XLP.
Trade Setups
I want to continue focusing on stocks that could run higher into year end for various reasons. Last week, I pointed out JPM and BA, neither of which performed well since. However, I still like both and, remember, the trade setups here in the EB Weekly Market Report are focused more on swing trades and weekly charts and less on day trades and daily charts. I felt JPM could decline back into the lower-140s, possibly even into the upper-130s, so it's weakness last week is not a concern. BA dropped more than I expected, but it can be very volatile - in both directions. My decision in selecting both JPM and BA is that I expected them to outperform through year end.
This week, I have one stock that reported great results last quarter and has been consolidating sideways ever since. While it's not in the industrials of financials area like BA and JPM, respectively, it is a stock that is looking much better on its weekly chart and seasonality suggests we could see a continuing trend higher into year end. Check out F5 Networks (FFIV) weekly price chart and seasonality chart:
F5 Networks (FFIV):
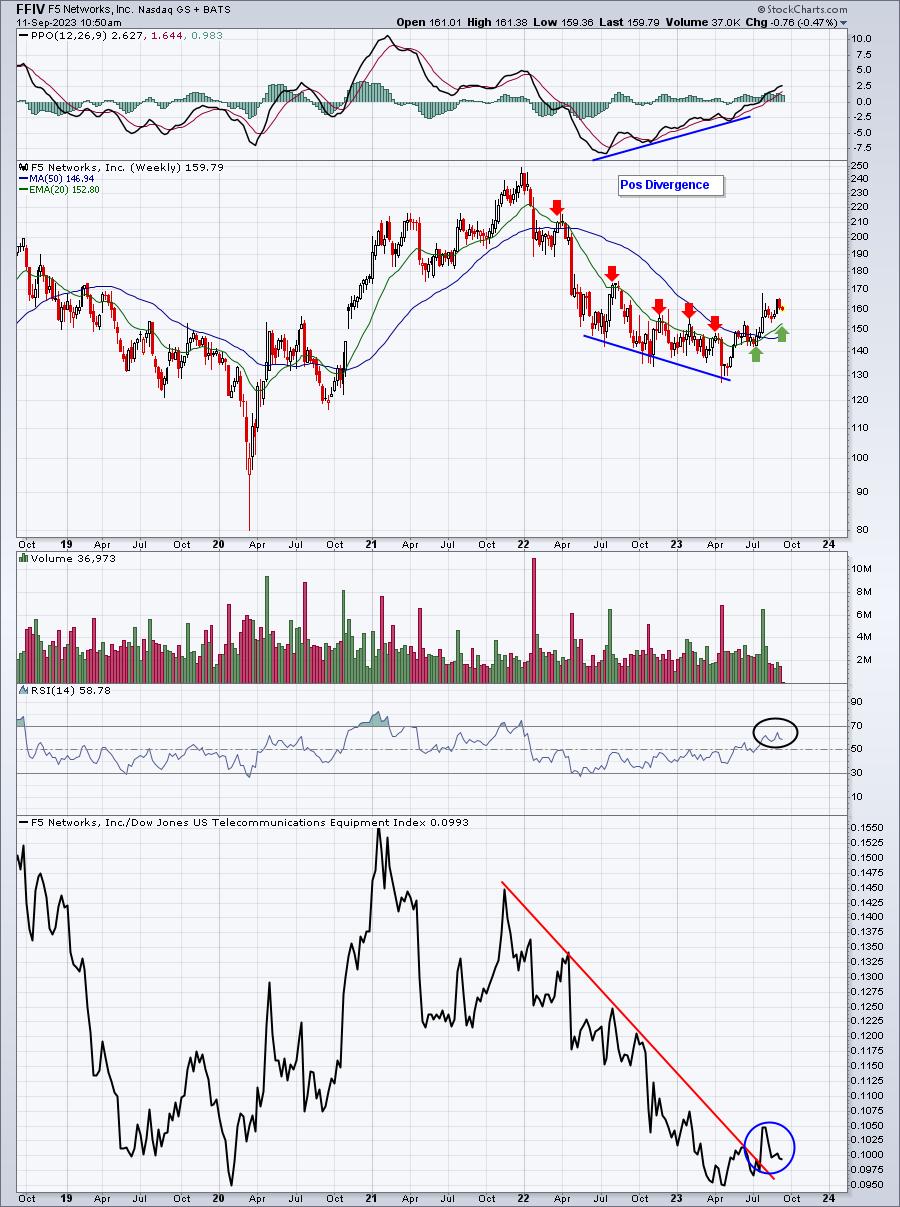
FFIV appears to have broken its weekly price downtrend on big volume in July and its relative strength vs. its telecom equipment peers ($DJUSCT) seems to have broken its relative downtrend as well. The weekly RSI strength and move through 60 recently is also a signal of a reversal in trend. Then throw in this seasonality chart:
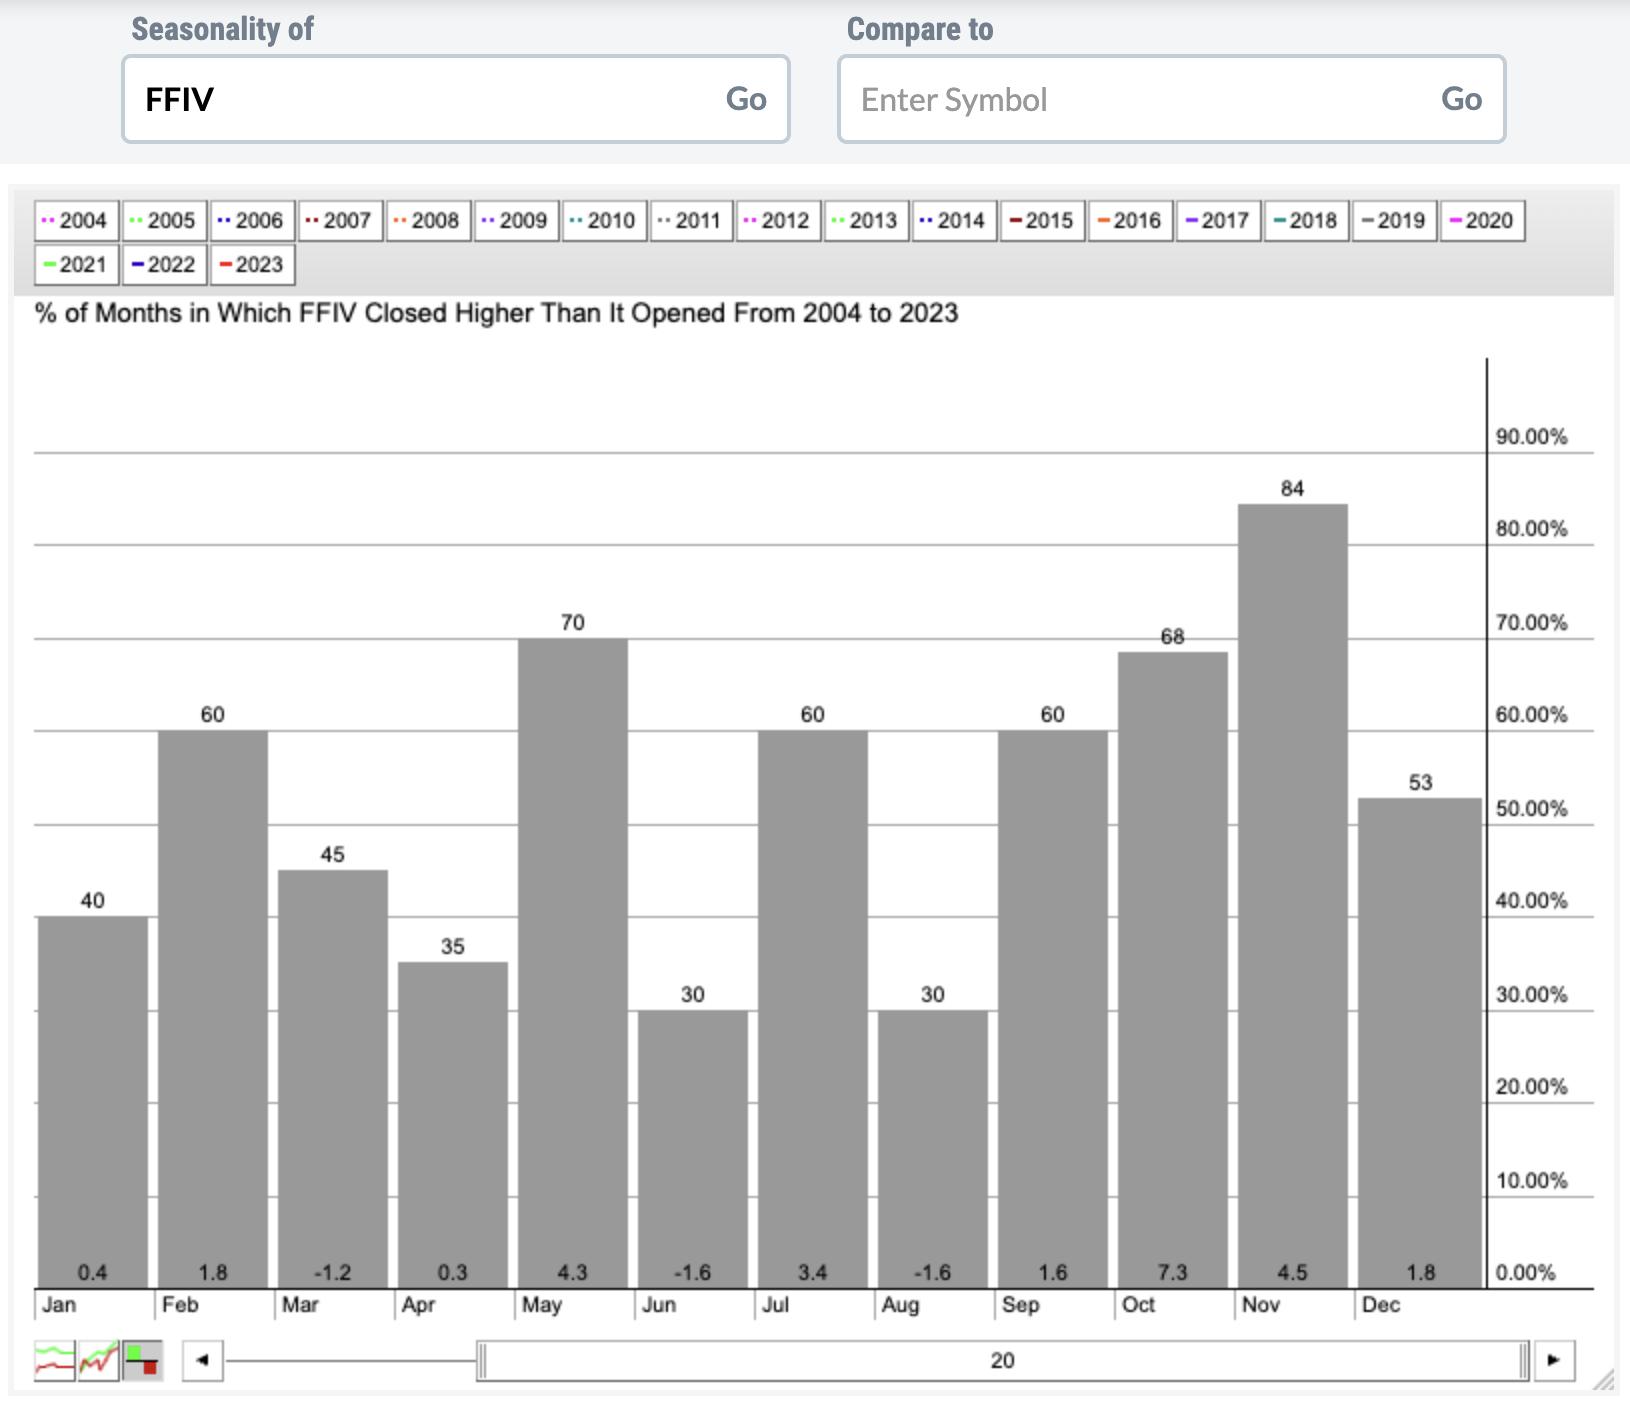
Check out those October and November returns. September and December also sport positive returns. And if I break down the returns by calendar quarter, this is what I get:
- Jan-Mar: +1.0%
- Apr-Jun: +3.0%
- Jul-Sep: +3.4%
- Oct-Dec: +13.6%
When I see technical conditions reverse and turn bullish just as a historical bullish period nears, I tend to grow much more optimistic. I expect FFIV to be an outperformer through year end.
Looking Ahead
Upcoming Earnings
There isn't likely to be a lot of market movement based upon key earnings reports. Most large companies that could influence the benchmark S&P 500 and/or the NASDAQ 100 have long since reported results. Here are a few interesting companies reporting this week, however, by day and market cap:
Monday: ORCL ($340 billion)
Tuesday: None
Wednesday: None
Thursday: ADBE ($255 billion), CPRT ($43 billion), LEN ($34 billion)
Friday: None
Key Economic Reports
The beige book is likely to grab attention and headlines on Wednesday afternoon at 2pm ET, but otherwise it'll be a fairly slow week for economic reports. Key economic news will be out next week, including both the monthly CPI and PPI reports. Those will come one week before the Fed decides whether or not to raise interest rates.
This week's reports:
Monday: None
Tuesday: None
Wednesday: CPI
Thursday: PPI, initial jobless claims, retail sales, business inventories
Friday: Empire state manufacturing index, industrial production, capacity utilization, consumer sentiment
Historical Data
Each week, I'll provide you the average annualized returns for each calendar day and by index. Here are the historical numbers for this week:
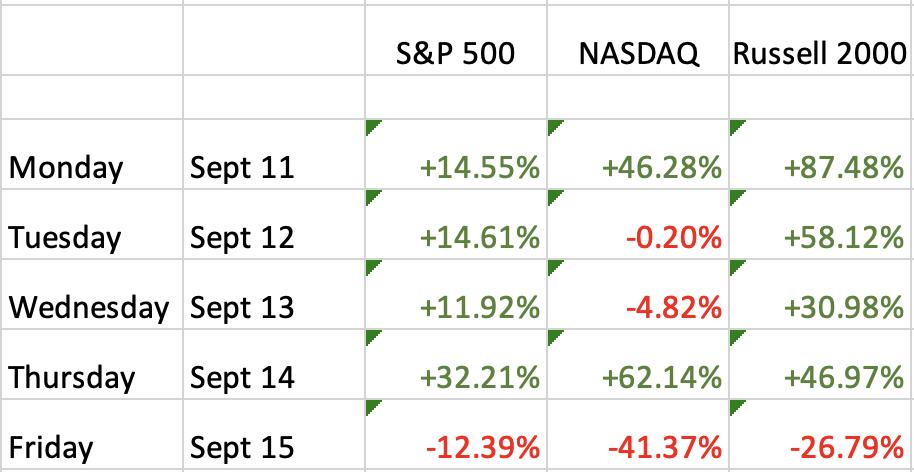
The S&P 500 data dates back to 1950, while the NASDAQ and Russell 2000 information date back to 1971 and 1987, respectively.
Just like the end of last week favored small caps (Russell 2000, or IWM), this week does as well - and by a considerable margin. But I believe that seasonal information ALWAYS takes a back seat to technical analysis and current market conditions.
Final Thoughts
Here is what I'm thinking right now:
- We remain in a very bullish market, though I do acknowledge the rough patch that lies ahead seasonally.
- I'm still a fan of small caps (IWM) through year end; historically, though, the QQQ outperforms the IWM, especially during secular bull market advances. For most ETF traders, it probably makes sense to have investments in the SPY, QQQ, and IWM, but the percentages in each could vary based on how aggressive you want to be.
- While seasonally the next couple weeks can be difficult, we also know we have 3 very important things to be aware of. The first two are inflation reports (CPI and PPI) that will be released on Wednesday and Thursday, respectively, of this week. The third is the Fed's next meeting, to be held September 19th-20th (next Tuesday and Wednesday). Most are expecting a pause in the hike cycle. If they stray, well.....
- Semiconductors ($DJUSSC) had a bad week last week and have started this week on a sour note; I'd like to see this group hold onto the 9200-9300 level on any further weakness.
- Earnings news will be very light, with only a couple of what I'd consider key reports - ORCL and ADBE. Economic news picks up, however, with those 2 inflation reports discussed in this report, plus retail sales, industrial production, and consumer sentiment.
- Intermarket relationships and sentiment BOTH favor higher prices ahead. Technical conditions favor another leg higher as well.
- Many companies throw out their "dirty laundry" in late September. Don't be surprised to see a highly-visible company or three issue revenue/EPS warnings for the current quarter. They can't "kick the can down the road" any longer as year end is approaching.
- I'm keeping my eyes on the prize. We're in a secular bull market, so I believe ANY additional selling in September will provide us a tremendous opportunity for entry later this month, particularly in leveraged ETFs, for those who like to dabble in those much riskier ETF products.
September 11th
It's been 22 years since the horrific attacks against the U.S. on September 11th, 2001. We continue to hold close in our hearts all of those impacted by those heinous acts.
God Bless America!
Feedback
I hope you enjoyed our second edition of our EB Weekly Market Report! We'd absolutely love your feedback, whether positive or negative. Let us know what you think by sending us your comments to "[email protected]".
Thanks and happy trading!
Tom