
EB Weekly Market Report - Monday, September 18, 2023
Thanks to everyone that has provided feedback after our first two EB Weekly Market Reports. We've read every comment and intend for this report to evolve over the next few weeks based on changes that we believe make sense, along with making a few changes based on your suggestions. One change that we absolutely are trying to address is how our report appears in your email. We understand it's annoying to scroll back and forth to read our content. The appearance currently depends on your email provider, but we'll have a solution that will work for everyone. Please continue to provide us your feedback. You can reach out to us at "[email protected]". Again, we read every comment so now is a GREAT time to have your voice heard.
Below is our third EB Weekly Market Report. As you will see, each EB Weekly Market Report will address different areas and asset classes. It's a different report with a unique perspective, unlike our Daily Market Reports, which focus much more on the here and now. We intend to publish on either Sunday or Monday of every week, but ultimately we'd like to publish on Sundays - ahead of the opening bell on Monday. When I'm traveling or otherwise busy on the weekend, Monday will be our other option. This weekly report replaces our Monday EB Daily Market Report and provides all of our members with a broader "Big Picture" outlook on the U.S. stock market. Our market outlook will focus more on longer-term weekly charts, as opposed to the daily charts more often used in our EB Daily Market Report. We believe it enhances our current product lineup and appeals to everyone - those with a longer-term mindset and those focused primarily on the near-term.
Because of our "top-down" approach to trading, it makes a lot of sense to begin each week with a Big Picture focus, citing the current long-term technical outlook and how that might impact the market given our short-term signals that we discuss daily. Our EB Weekly Market Report will also provide a consistent, once-per-week review at key sentiment and intermarket relationships that we value so highly at EarningsBeats.com and has helped us to guide our members through a very tumultuous 3-4 year period, beginning with the 2020 pandemic, right through the most recent 2022 cyclical bear market and subsequent 2023 secular bull market advance.
We'll also review the prior week's action and provide trade setups, but mostly (not always, as you'll see below) with a longer-term mindset - think of longer-term swing trading, which should appeal to those of you that like the idea of longer-term momentum trading, providing wider stops and targets.
Here's Week 3.
Weekly Market Recap
Major Indices
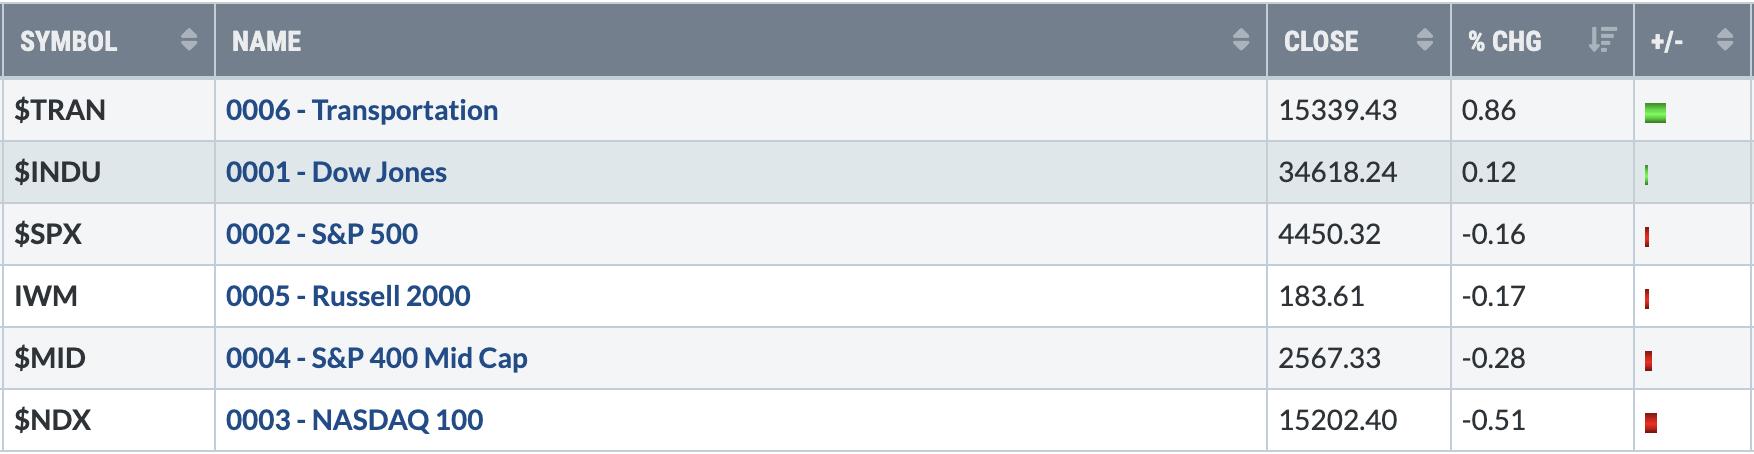
It hasn't happened often, but the NASDAQ 100 actually trailed our other major indices last week. Is it the start of something much bigger on a relative basis? Well, it's WAY too early to go there, but the risk of the NASDAQ 100 UNDER performing has grown in recent weeks, especially with weekly PPOs so stretched on key industry groups like semiconductors ($DJUSSC), software ($DJUSSW), internet ($DJUSNS) and others. Meanwhile, transports ($TRAN) led despite multiple warnings last week from airlines ($DJUSAR). Airlines moved lower for the better part of 10 weeks, so we could certainly argue that the "sell on rumor" was in play. As airlines actually warn, it's quite possible we see "buy on news". If the DJUSAR closes beneath 148, then another leg lower could well be underway. If it holds, however, don't be surprised to see the bad news last week act as a catalyst for higher prices into year end. Truckers ($DJUSTK) and railroads ($DJUSRR) actually performed quite well last week, helping to the TRAN to relative gains for the week.
Sectors
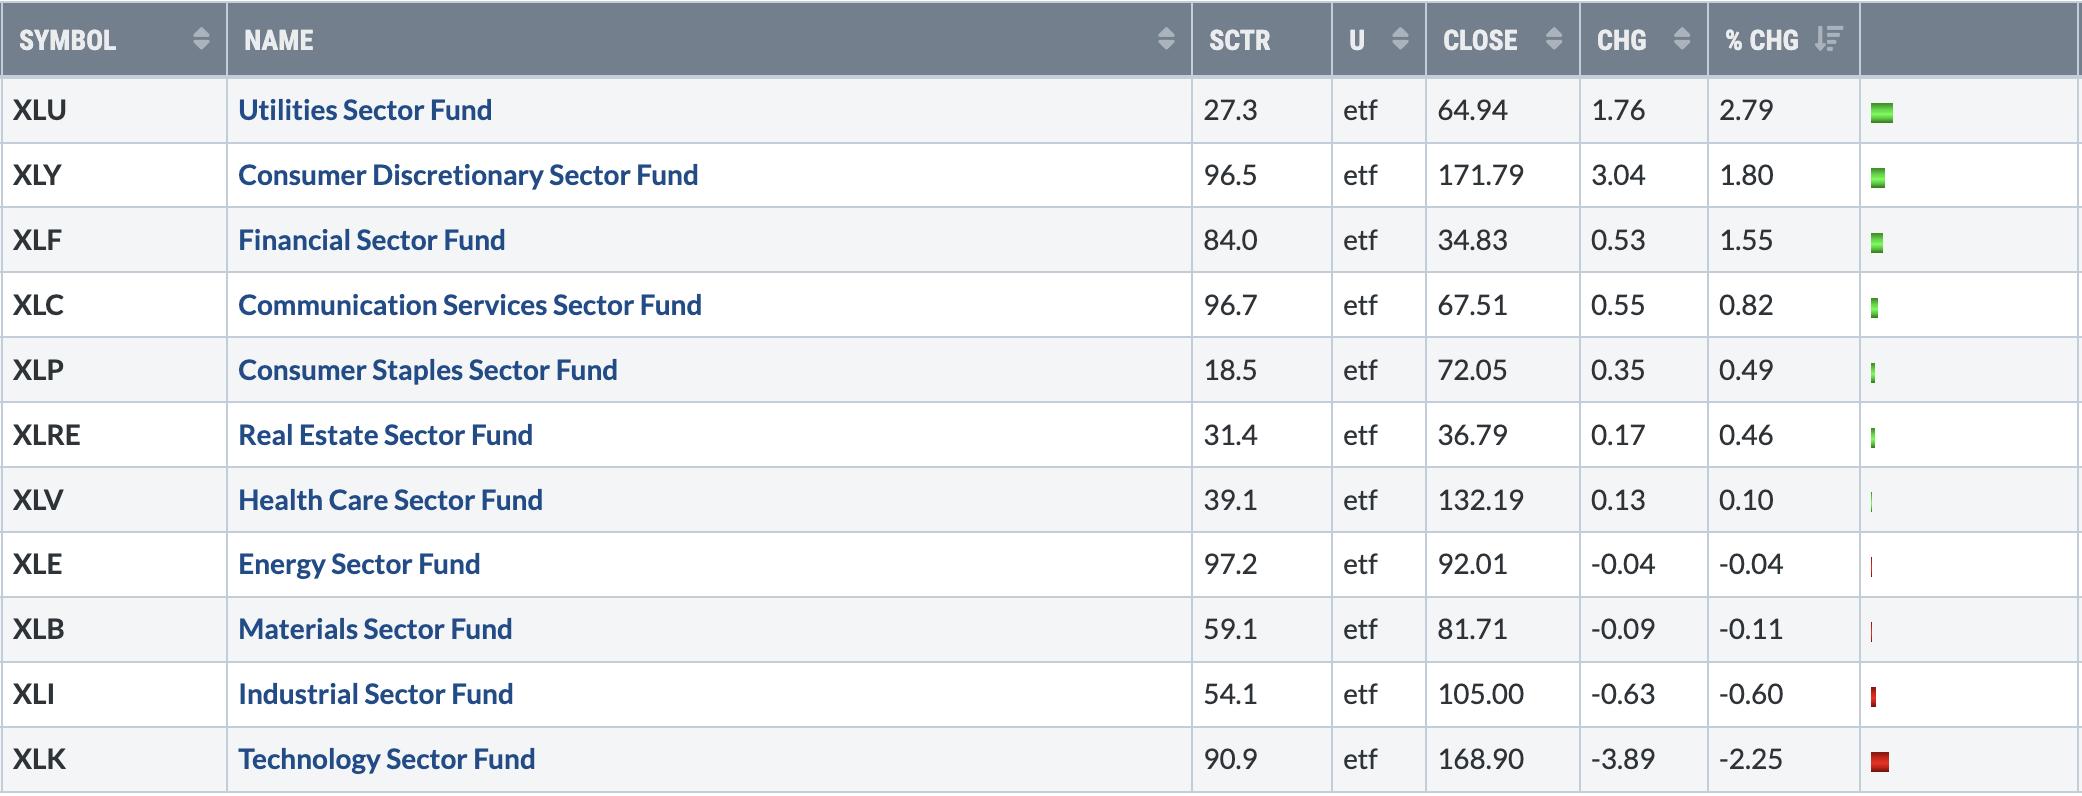
Utilities (XLU) gained last week and was our top-performing sector, while technology (XLK) was our worst. But if we pull up weekly charts on both, you'll quickly see that the XLU has its key 20-week EMA just above current price, while the XLK shows its 20-week EMA just below current price. The technical outlook is quite different for the two. Check out these charts:
Utilities (XLU):
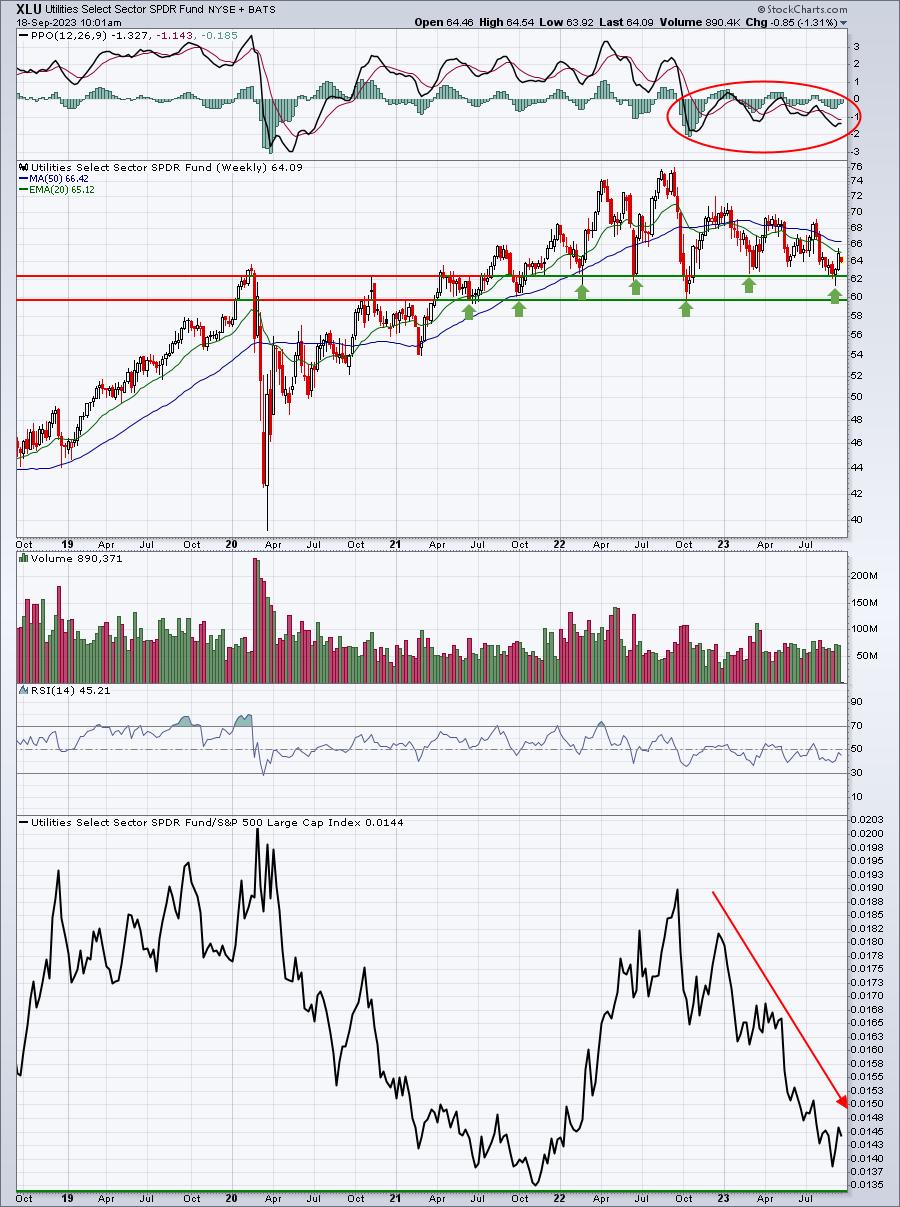
The XLU has shown a negative weekly PPO throughout much of 2023 and its strength last week was a COUNTERTREND move to the upside. There's no real strength here, either on an absolute or relative basis.
Technology (XLK):
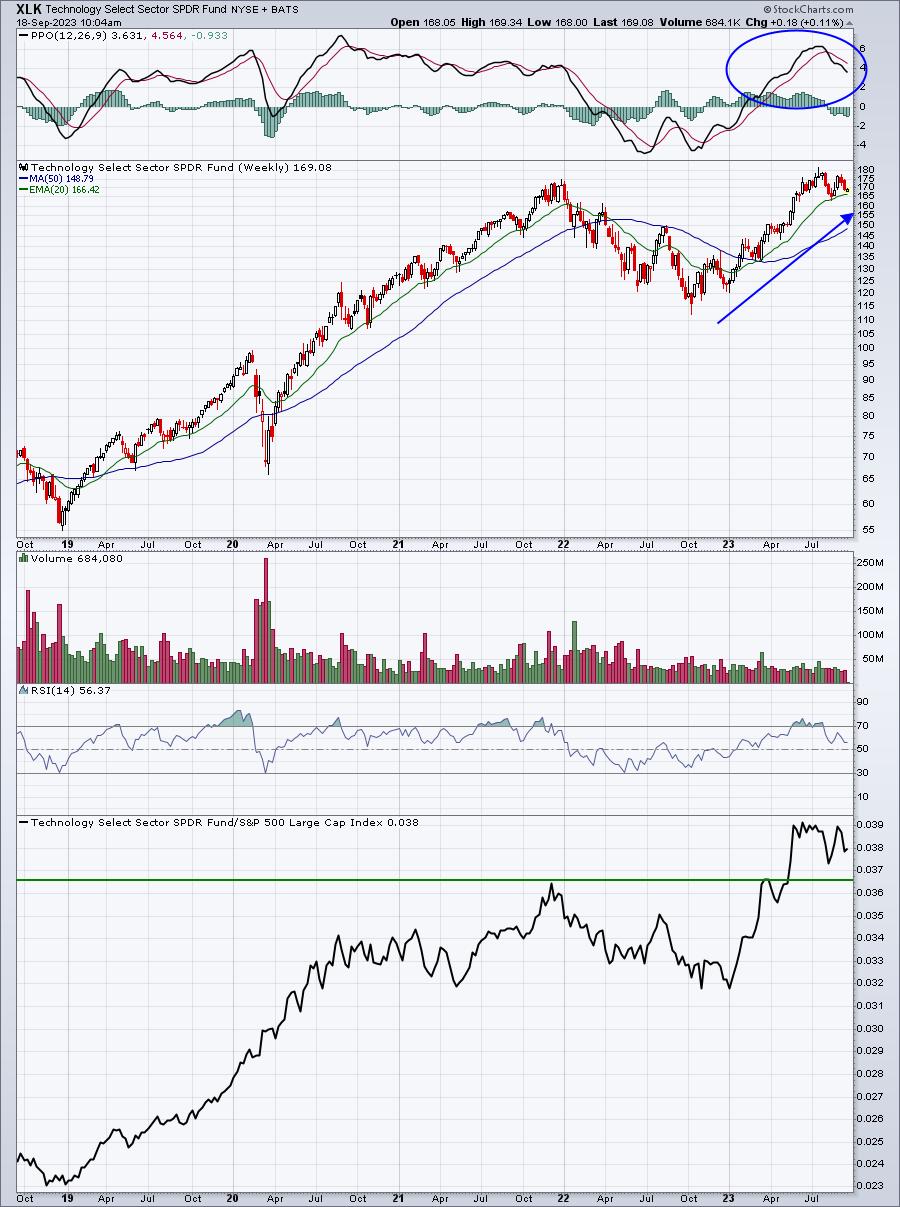
I believe the differences between the XLU and XLK charts are rather self-explanatory. Those trying to read something into utilities leadership last week have lost sight of PERSPECTIVE. Now, if we see this behavior continuing for a month or more and clear technical breakdowns on the XLK emerge, then we'll likely have a different discussion.
Top 10 Industries Last Week
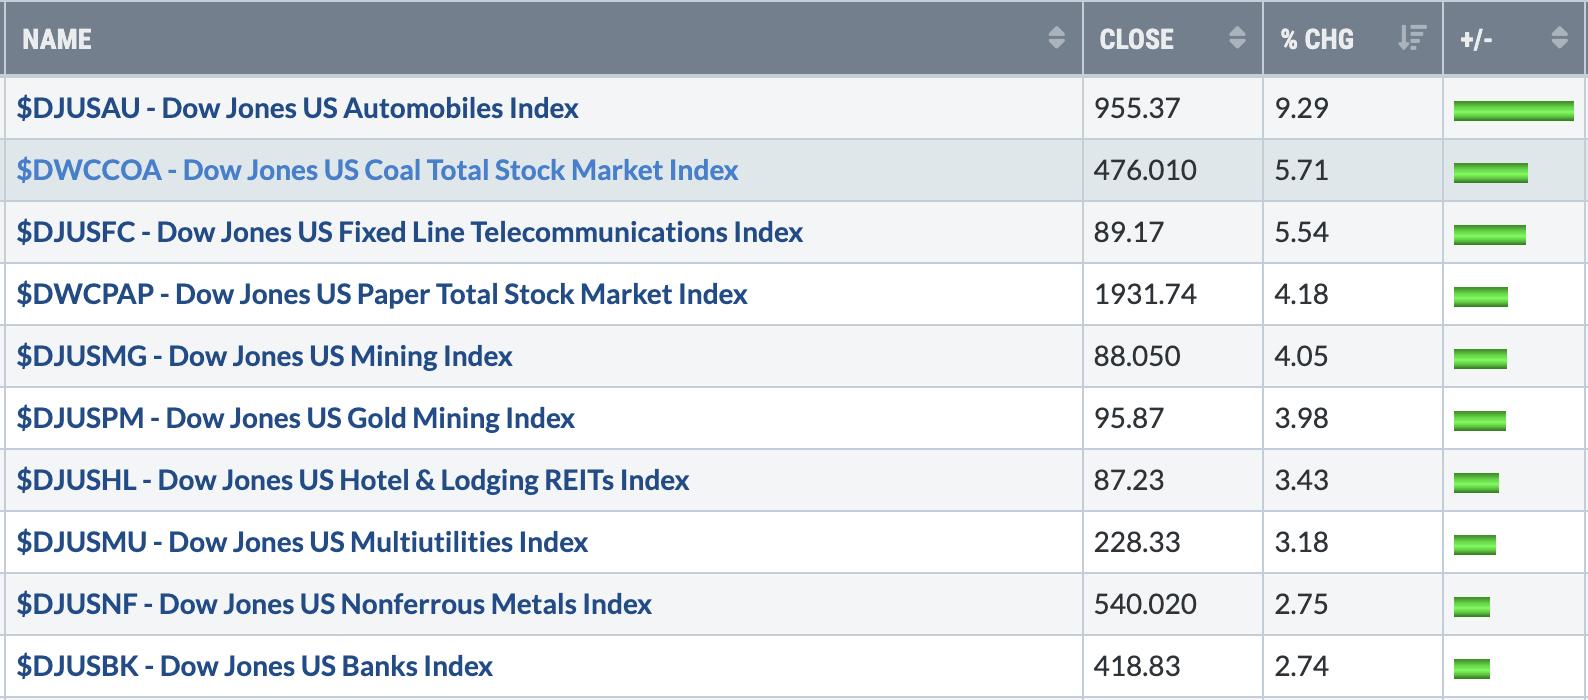
Automobiles ($DJUSAU) remain a favorite industry group of mine, mostly because I'm a big fan of Tesla (TSLA). Technically, it's important to note that this group's recent strength has NOT produced severely overbought conditions and a "tree growing to the sky" weekly PPO. Check out the long-term weekly chart here and note how high previous weekly PPOs have moved:
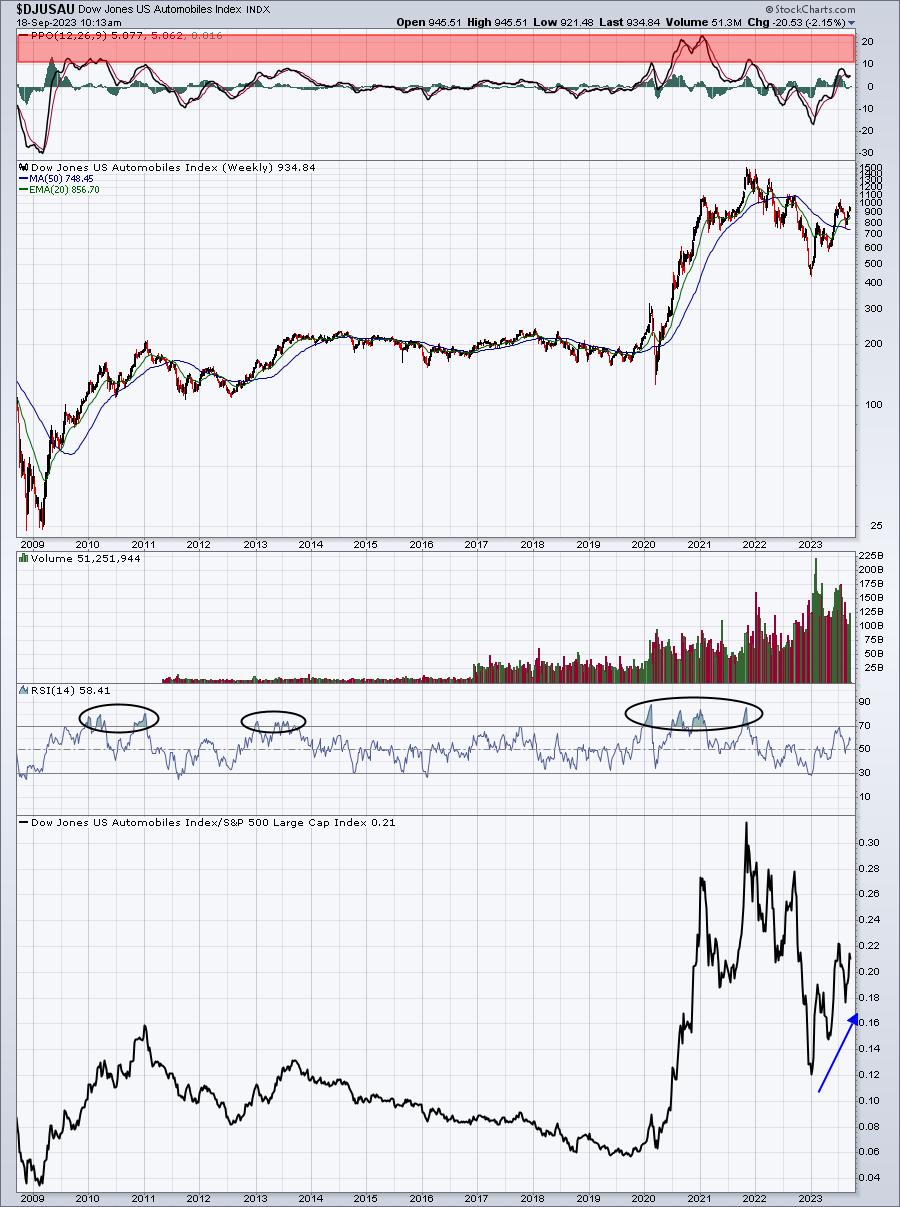
The red-shaded area shows that during advances, the DJUSAU can see its PPO reach into the teens (2009/2010) and even well above 20 (2020/2021). Furthermore, check out the history of its weekly RSI, moving through 70 on several occasions. Right now, the DJUSAU sports a weekly PPO and weekly RSI of 5 and 58, respectively. I'd argue that the DJUSAU is one industry group with potentially much more upside room.
Another interesting industry group on this list is banks ($DJUSBK), which came in 10th last week. Banks have been through a lot over the past 4 years and 2023 has been no exception. With so much bad news built in, don't be surprised to see this group thrive in Q4. Since this secular bull market began in 2013, I want you to look at how banks have performed in Q4, especially October and November:
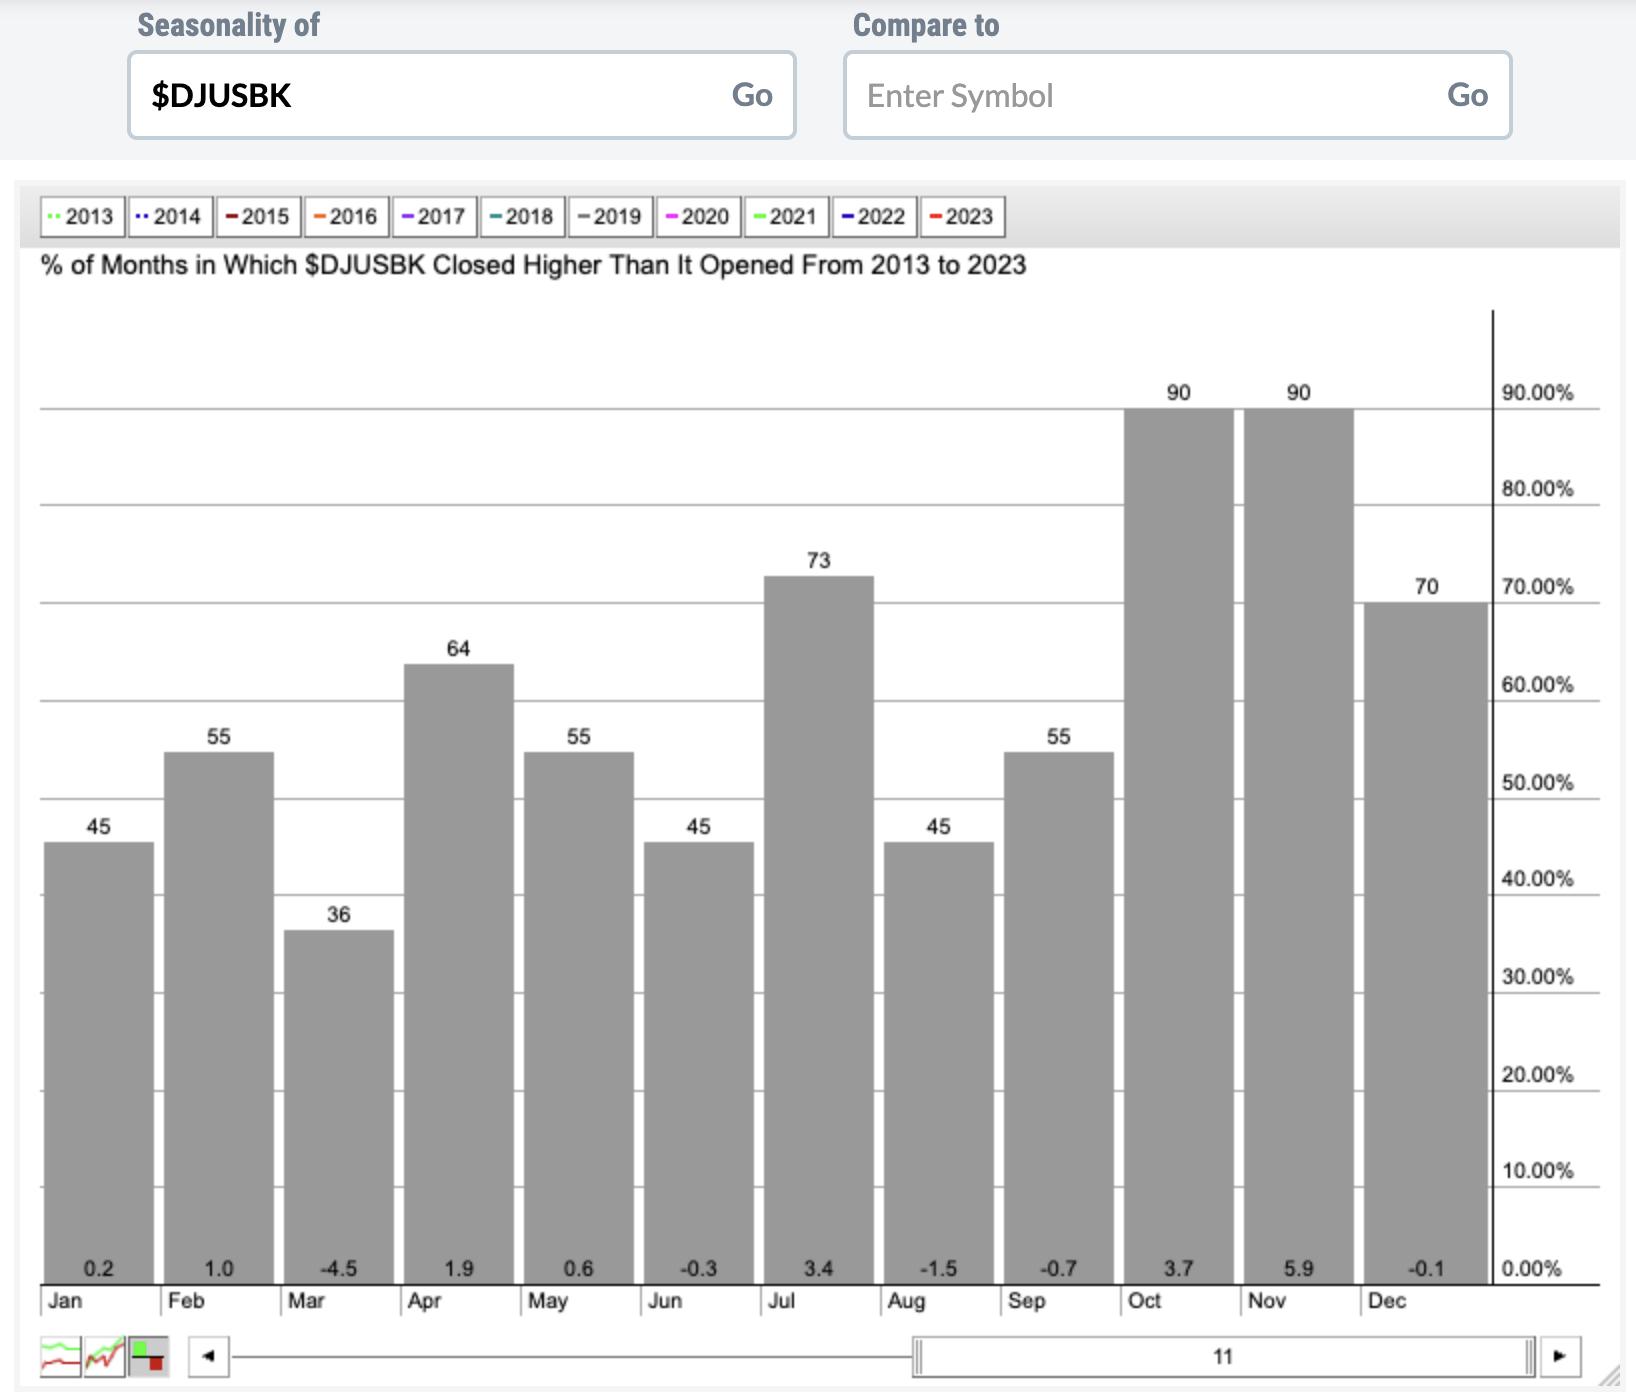
Here are how banks have performed by calendar quarter over this period:
- Q1: -3.3%
- Q2: +2.2%
- Q3: +1.2%
- Q4: +9.5%
To average such a strong return in Q4 over an 11-year period is noteworthy, in my opinion. October and November have been the best two consecutive months for banks - BY A MILE! We're now less than two weeks from the start of October and banks jump into the Top 10 industry group rankings last week? Is Wall Street beginning to prepare for yet another strong quarter ahead? Well, seasonality would certainly suggest that's a strong possibility.
Bottom 10 Industries Last Week
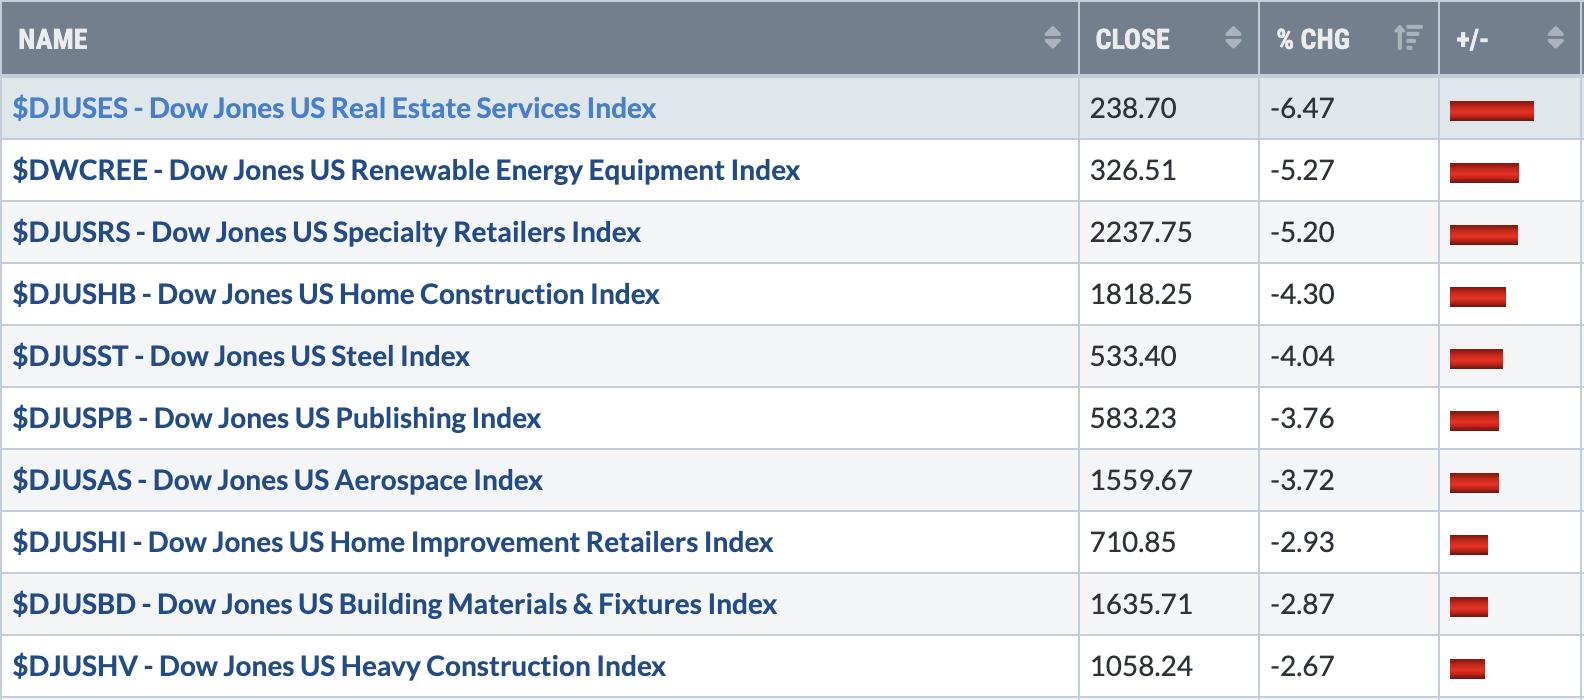
Materials (XLB) reached an all-time high just before the 2022 cyclical bear market took prices lower nearly across-the-board. While the XLB remains about 10% off of that high, steel ($DJUSST) has been one component industry group that's held this sector together. The DJUSST hit its all-time high in Q1 2023 and is currently testing its 50-week SMA, just as it did back in May. I believe the DJUSST is a key when evaluating how materials perform during the balance of 2023 and into 2024. If our global economy expands once all the central banks cease hiking rates, and that's what many charts are telling me, then steel should hold onto support. There's actually a bullish ascending triangle in play on this group. Check this out:
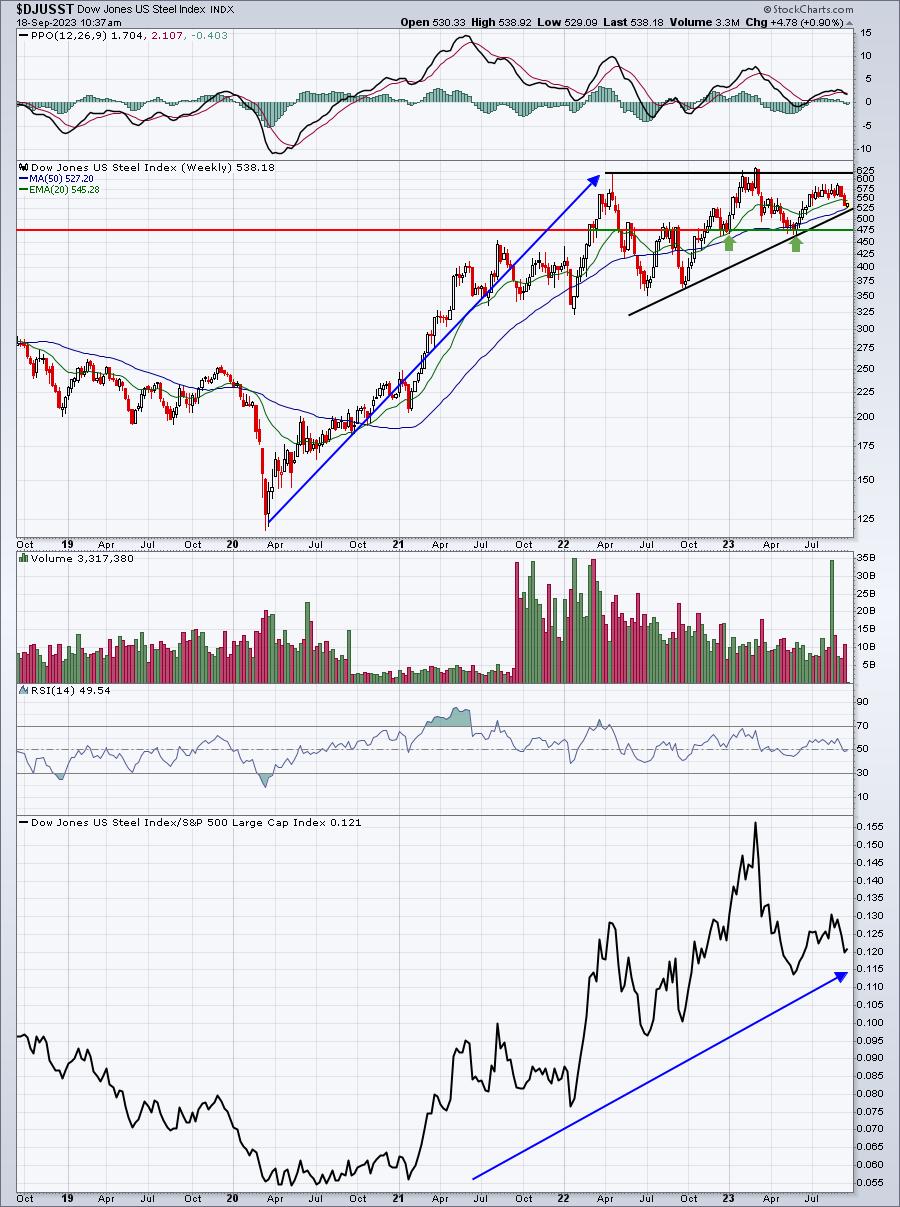
Steel had an amazing run higher and this bullish ascending triangle pattern constitutes a continuation pattern. These tend to break in the direction of the prior trend, which in this case, was higher. Don't be surprised by a strong Q4 in the steel group, helping to keep materials afloat and in an overall uptrend - at least on an absolute basis. I still have my doubts that materials will lead the next leg of this bull market.
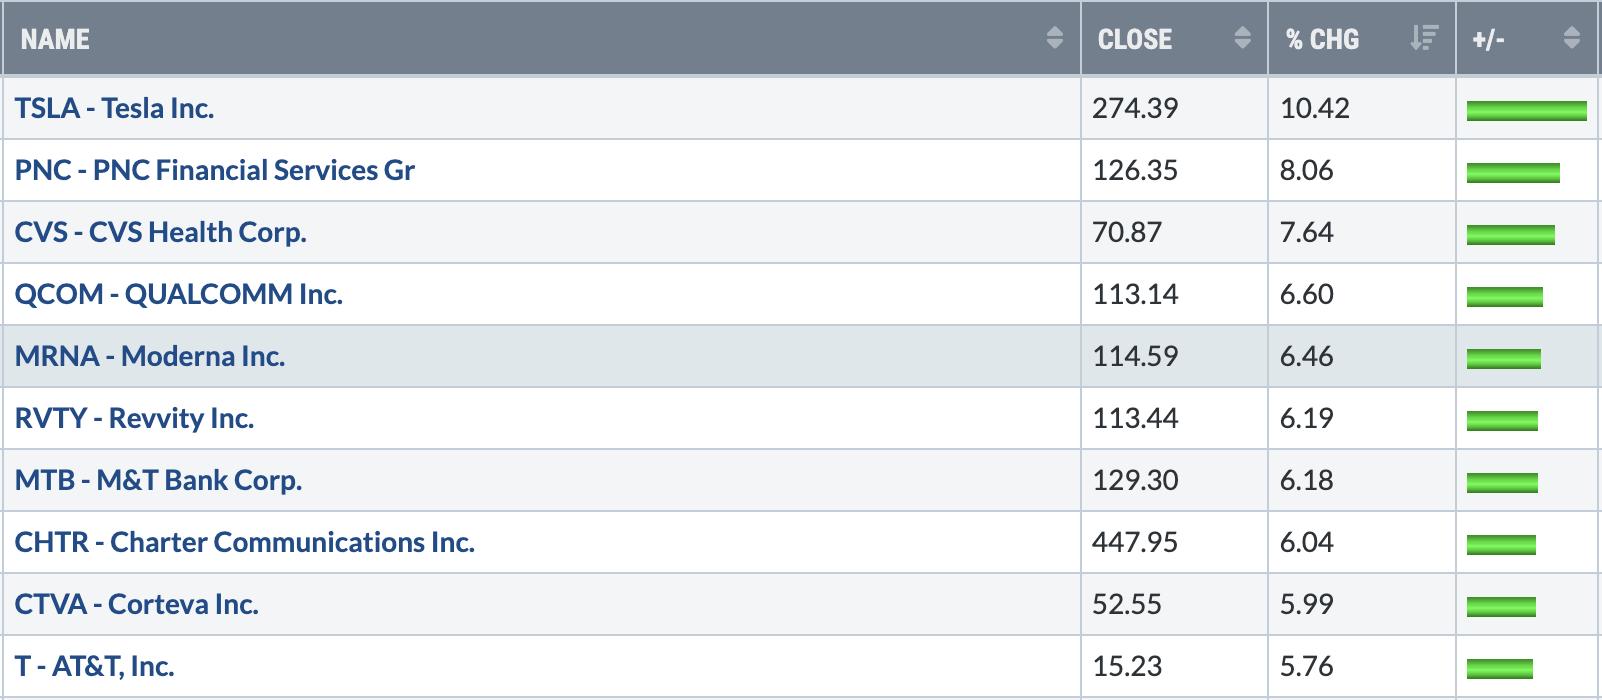
Top 10 Stocks - S&P 500/NASDAQ 100
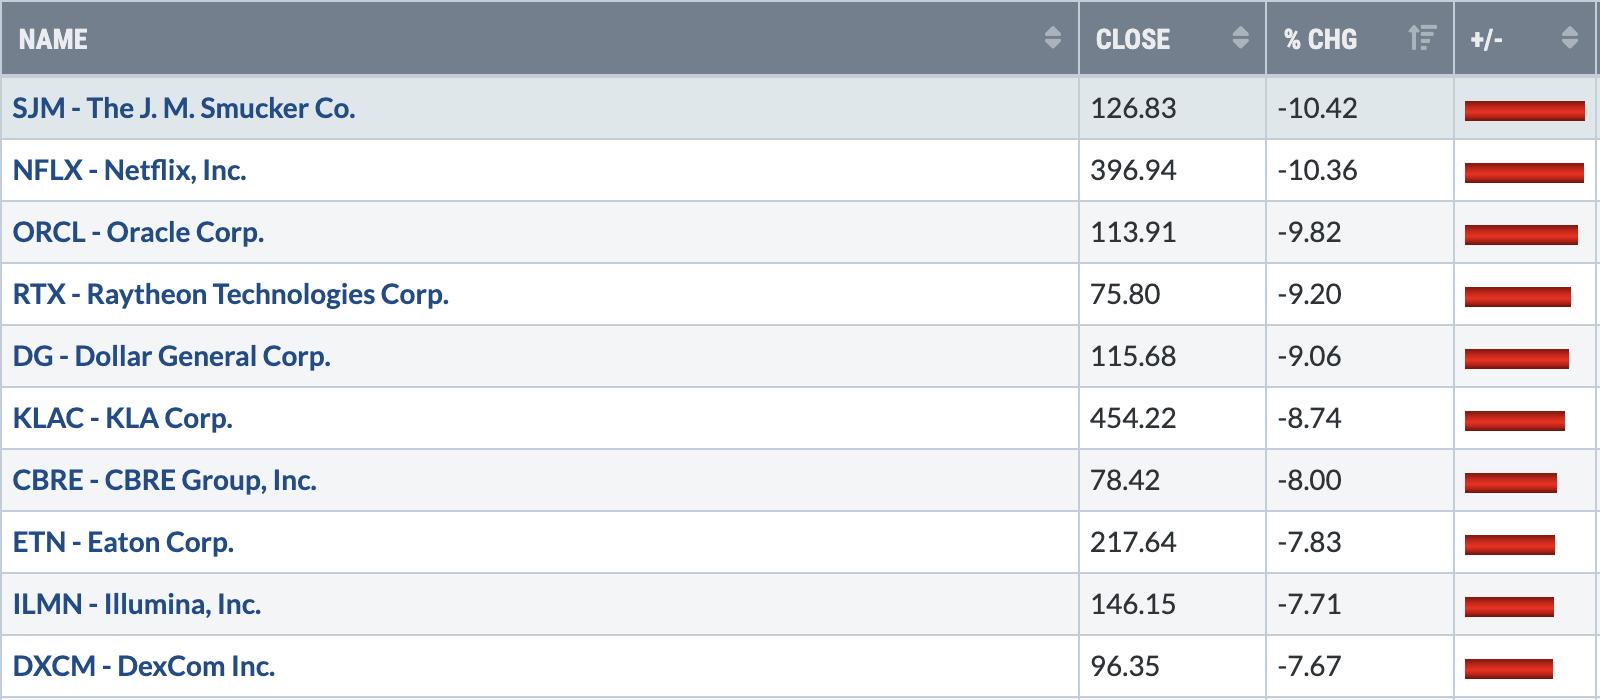
Bottom 10 Stocks - S&P 500/NASDAQ 100
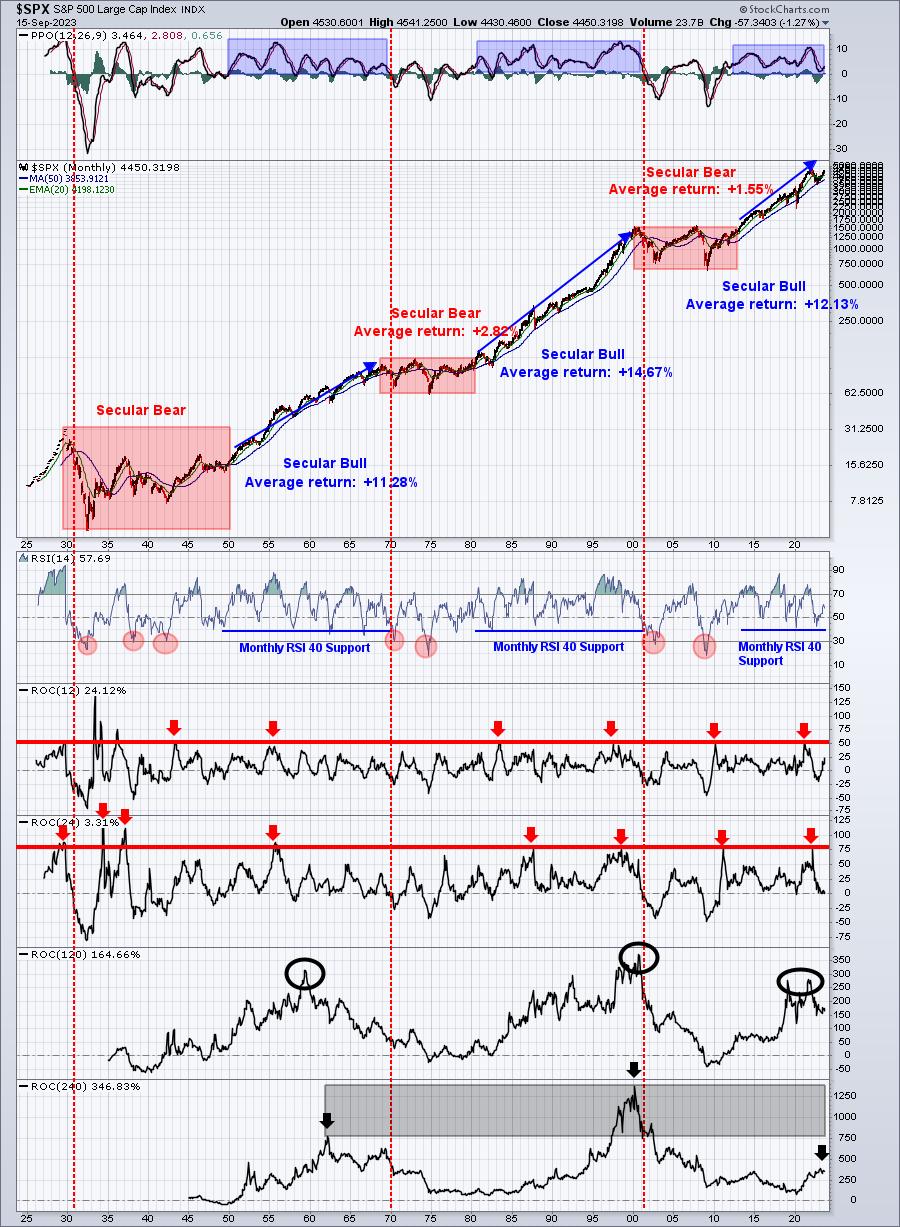
Big Picture - September 2023
This is a chart that doesn't change much from week to week. Accordingly, beginning in October 2023, I will only provide this chart in the first EB Weekly Market Report of each calendar month.
Just as I did last week, I'm providing a quick refresher. For more details on the chart, please refer to our first EB Weekly Market Report (two weeks ago):
September Update:
Please refer to commentary from our first EB Weekly Market Report. It takes a LOT to change long-term perspective. Nothing has changed in the past two weeks. It's extremely important that we ALWAYS keep this chart in mind when evaluating the market from week-to-week or month-to-month.
Major Indices
From an intermediate-term weekly perspective, I've highlighted both the S&P 500 and NASDAQ in the prior two weeks. Today, let's look at the small cap IWM (tracks the Russell 2000):
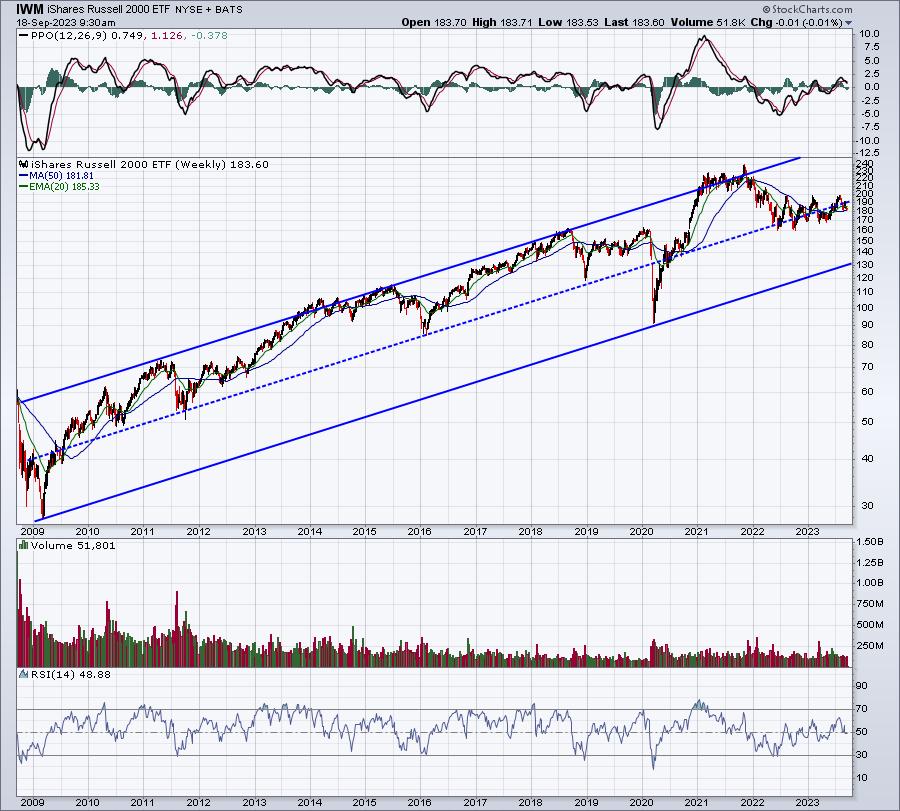
You can go back to the last two EB Weekly Market Reports and look at the weekly S&P 500 and NASDAQ 100 charts that I provided. They both show a channel very similar to this one. This covers 15 years. The IWM, while underperforming the NASDAQ 100 over much of this period, remains in a very strong secular bull market uptrend just like the others. Long-term perspective shows us that they've all performed well. Getting into the IWM when its weekly RSI is below 50 has been a solid investment in the past. The timing may not be perfect, but the odds of strong gains in the IWM increase as its weekly RSI falls.
When you ignore perspective, it's easy to say, "what's wrong with small caps?" or "will they ever go up again?" The above chart clearly shows a long-term uptrend in small caps. But various asset classes like large, mid, and small cap stocks do not always move together. They take turns in a leadership role. During secular bull markets, the NASDAQ tends to perform best, so it usually makes sense to overweight the group. Currently, however, the NASDAQ is much more overbought than our other indices, because they've led this 2023 rally by a mile. Need proof? Check this out:
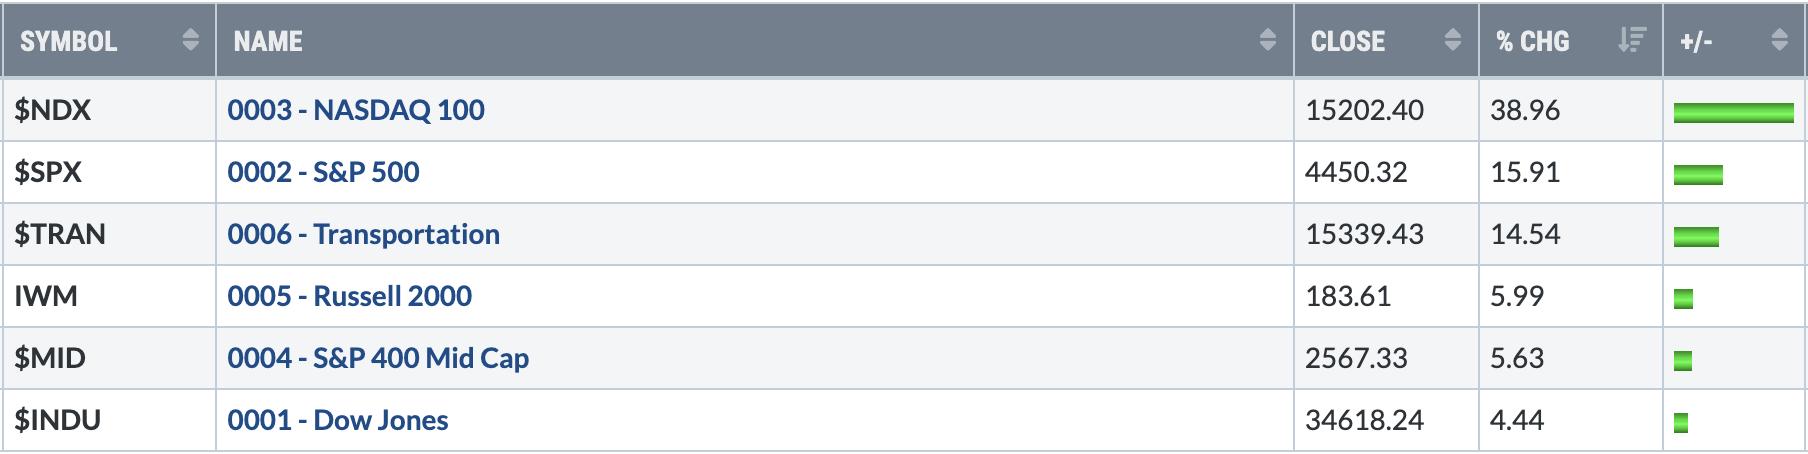
This is a year-to-date performance summary. Traders see this type of relative performance on the chart and assume it will go on forever. It doesn't. Yes, I still LOVE the NASDAQ 100 index. But it's very extended and carries an inordinate amount of risk on a relative basis as we head into Q4. It absolutely could continue higher, that's not my point. My point is HOW MUCH RISK are you willing to take to continue riding this index? Secular bull markets carry all groups higher (or certainly the overwhelming majority). Rotation will allow other asset classes to play "catch up". Will it happen right now? Will it happen next year? I don't have that crystal ball, unfortunately. I only know that the RISK of it happening is much greater now than it was 9 months ago. So I adjust my portfolio accordingly. I've been on the NASDAQ train for much of 2023. It's simply time to consider other trains now. Keeping some NASDAQ 100 exposure likely makes sense, but overweighting it? Not my style at this point, especially knowing that Q4 tends to favor rotation to more value-oriented areas.
Sentiment
Equity-only put-call ratio ($CPCE):
I covered sentiment last week and I don't plan to cover it every week, but I do want to point out that the 5-day SMA of the CPCE remains at .85, showing extreme fear. I would argue that we have little downside based on this sentiment indicator. That doesn't mean we won't see some whipsaw and, perhaps, a one or two-day swift move to the downside this week. After all, it's Fed week AND it's September 18th. Fed meetings can create tons of volatility and the upcoming 1-2 weeks represents one of the worst historical periods of the year, if not THE worst. I'm preparing for it by owning ONLY major ETFs, but with ZERO leverage. It's too risky on either the short or long side, in my opinion, to over expose a portfolio. I do love, however, the current panicked state of the options market - check out this updated 5-day reading of the CPCE:
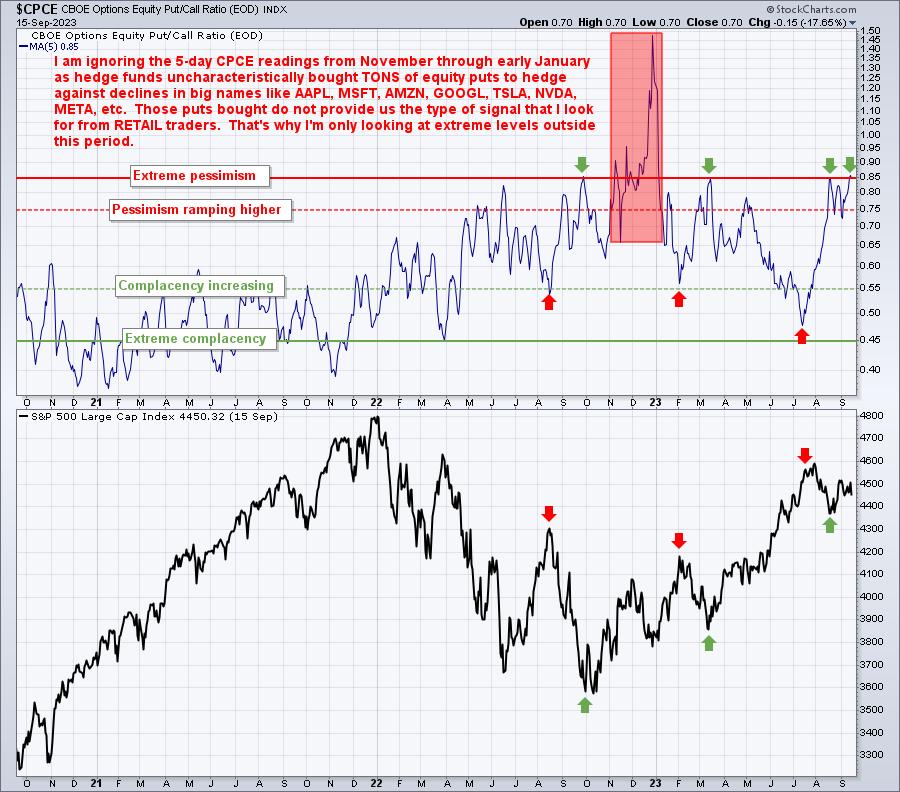
Ordinarily, I'd extremely bullish when I see CPCE readings like this. And I AM extremely bullish. But I'm fearful of a quick drop given the panicked state of options traders AND the Fed, which I don't trust AT ALL. My ideal scenario would be one more quick drop after Wednesday and then I would consider BEGINNING to build a leveraged ETF position - most likely in the TNA (tracks IWM, or Russell 2000 small caps, at a 3 to 1 clip).
One other potential catalyst to scare traders near-term is the 10-year treasury yield ($TNX), which resides right now at 4.33%, on the cusp of a possible breakout above the key yield resistance from 4.33% to 4.35%. Today's intraday high was 4.36%, so we're close.
The U.S. Dollar
I have a rather unique way of looking at the U.S. Dollar ($USD) and predicting its next movement and I've seen not seen anyone else look at this way. But from Economics 101, this makes common sense to me. First, I've done a lot of research into the correlation between the U.S. bond and stock market vs. foreign bond and stock markets. I've found the most positive correlation between the U.S. and Germany. In other words, when U.S. stocks rise, there's a strong chance that German stocks rally - more so than any other country. I hear CNBC "experts" trying to tie behavior in China to the U.S., which is a HUGE mistake, in my opinion, because these two countries show VERY LITTLE positive correlation over the years. In other words, "what happens in China stays in China".
Let me show you the correlation of the U.S. stock market vs. both Germany and China, so that you can see for yourself what I'm talking about:
S&P 500 ($SPX) vs. German DAX ($DAX)
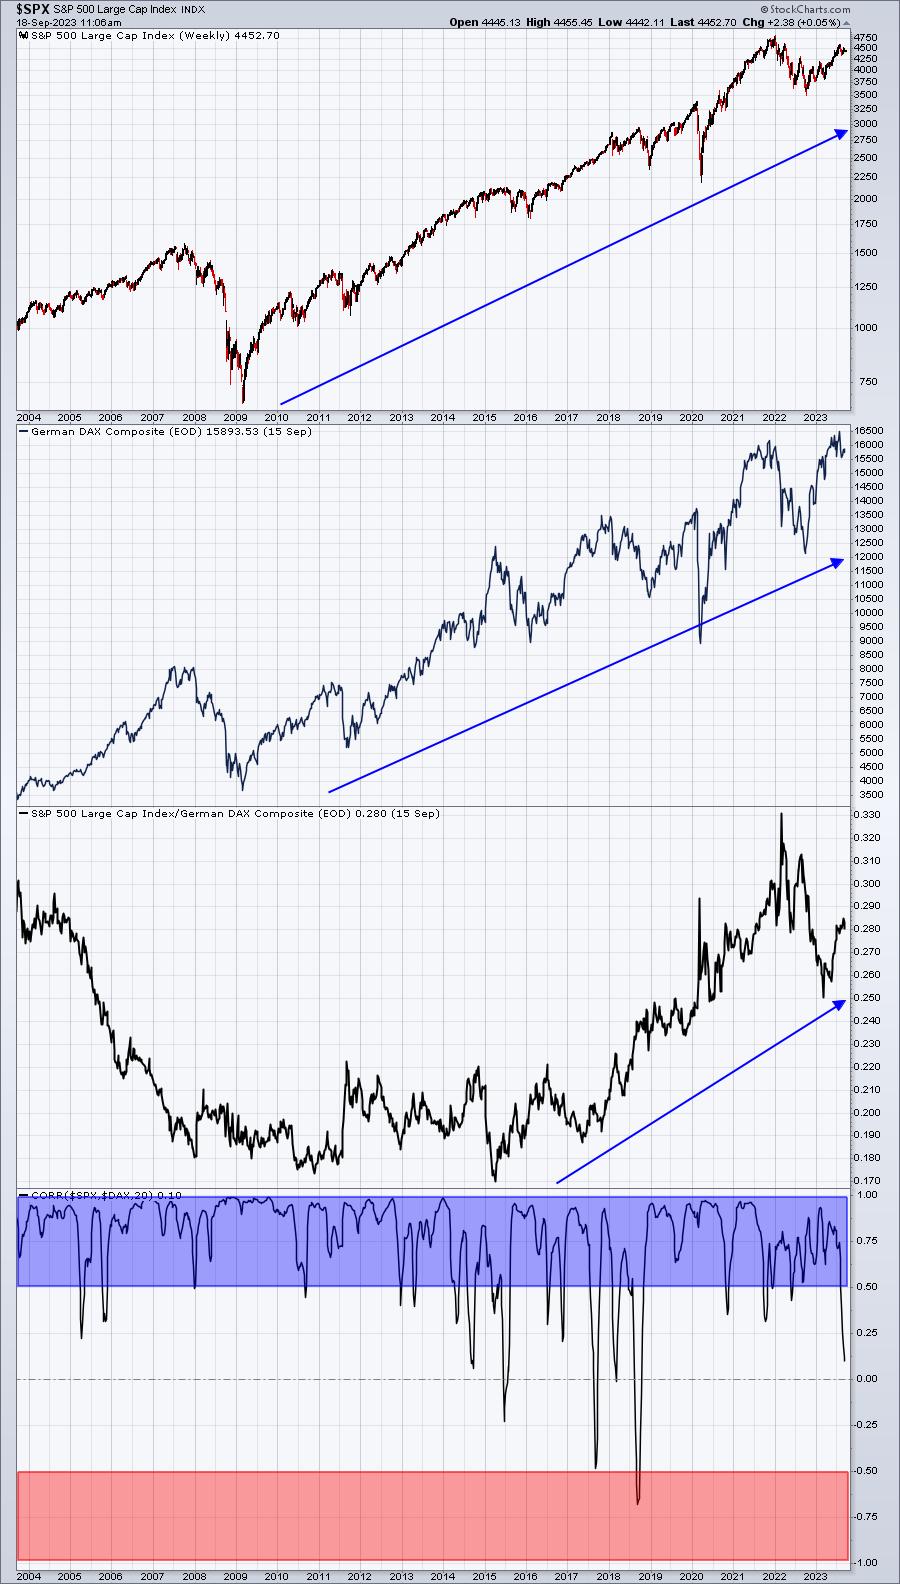
Don't these two charts simply look somewhat alike? Both are in uptrends and they both downturns at similar times. I mean, if you looked at the German DAX quickly, you might think it was the S&P 500. The bottom correlation panel, however, says it all. The blue-shaded area shows that the SPX and DAX tend to move hand in hand with one another most of the time. That's what positive correlation from .50 to 1.00 tells us. Check out how often we see negative, or inverse, correlation that reaches the -0.50 level. Once in 20 years.
S&P 500 ($SPX) vs. China Shanghai Composite ($SSEC)
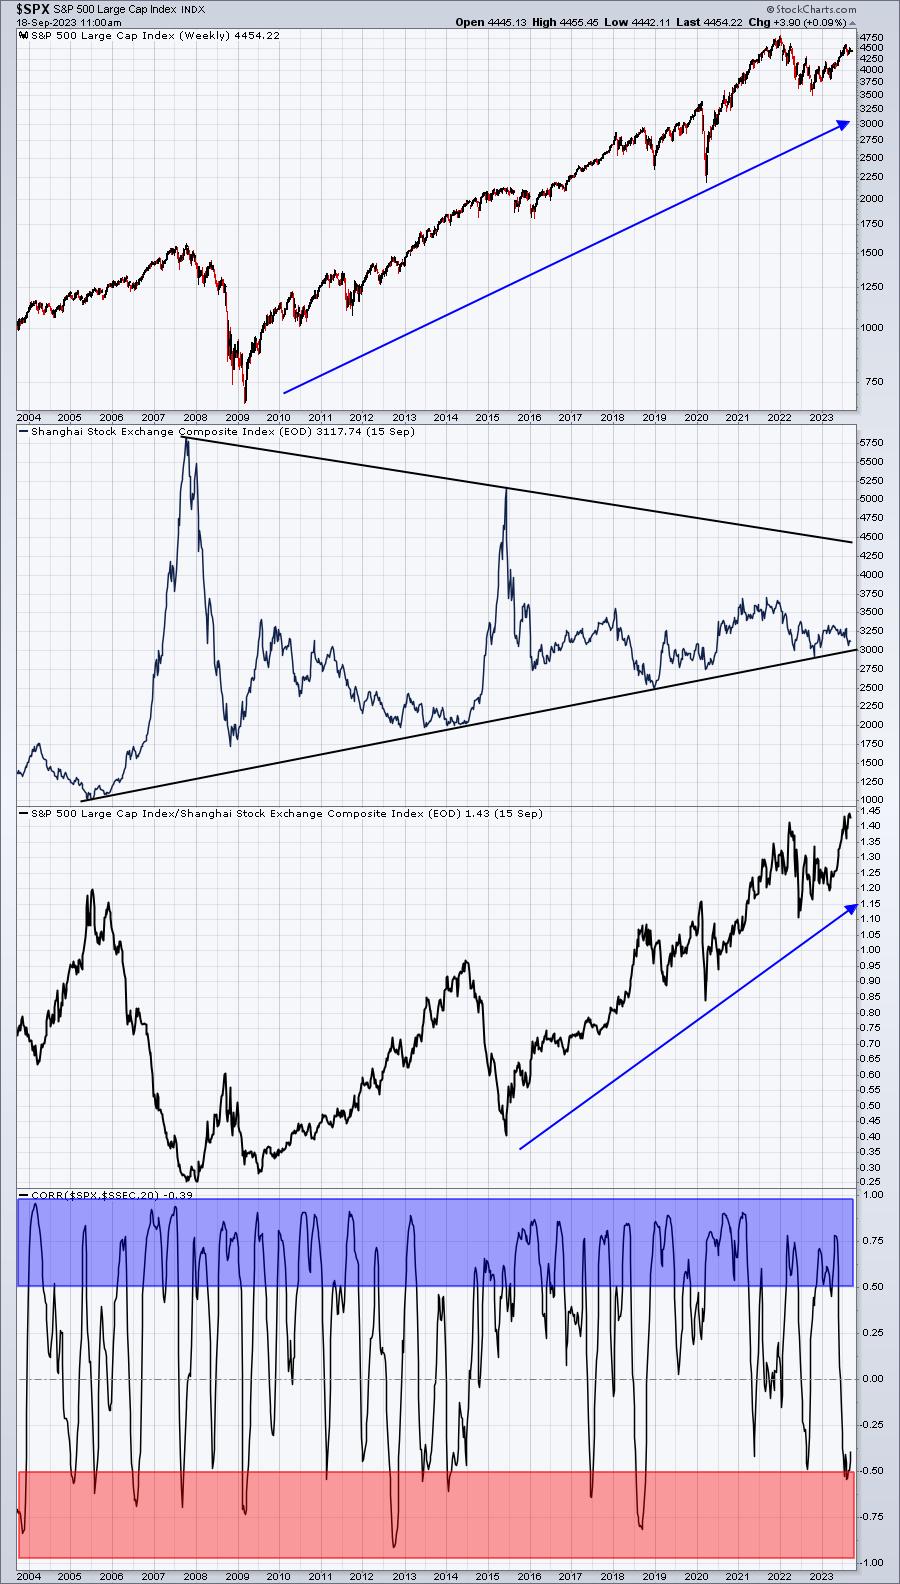
Again, I've used the shaded areas to highlight positive (blue) and negative/inverse (red) correlation. This chart looks a little bit different, doesn't it? I'd still say there's mostly positive correlation, but it isn't nearly as strong as with Germany. You can simply look at the price chart of the S&P 500 (consistently rising) and China's Shanghai Composite (lower highs, higher lows) and see that they certainly don't mirror one another.
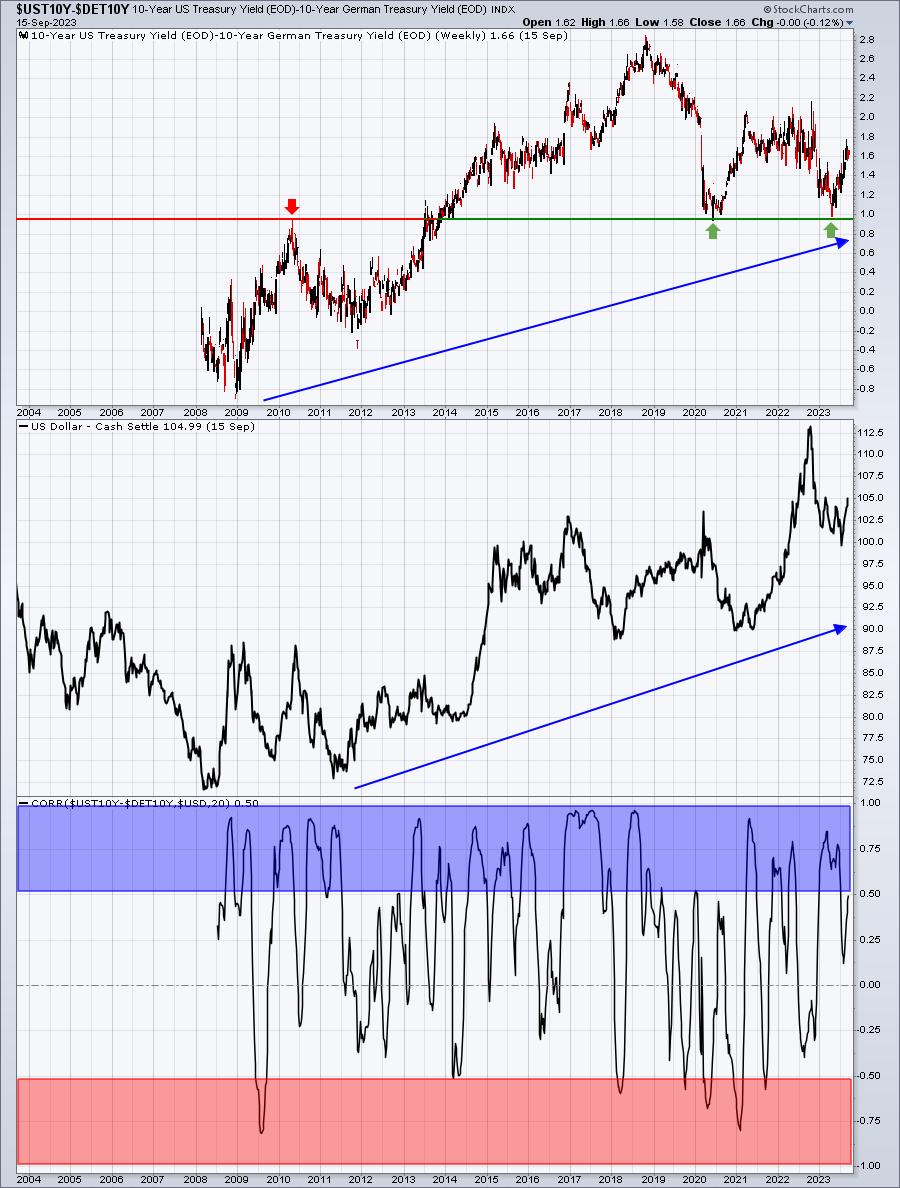
Because the U.S. and Germany is so positively-correlated, I believe that it makes sense to track our bond markets, relative to one another, to gain insight into which economy is stronger and, hence, which currency is likely to be stronger.
In order to track this, I take the U.S. 10-year Treasury Yield ($UST10Y) and subtract the German 10-Year Treasury Yield ($DET10Y). When I do that over the past 20 years, this is what it looks like:
Trading Foreign ETFs
It's extremely important to consider the U.S. Dollar ($USD) whenever you trade a foreign ETF (Exchange-traded fund) and I'll explain why. Once again, I'll use Germany as an example of how this works. Let's assume you believe the German DAX is headed higher and you want to benefit from that. The EWG is the international ETF that tracks the German DAX. On the following chart, though, you'll notice that the EWG doesn't do a great job of tracking the German DAX. Check this out:
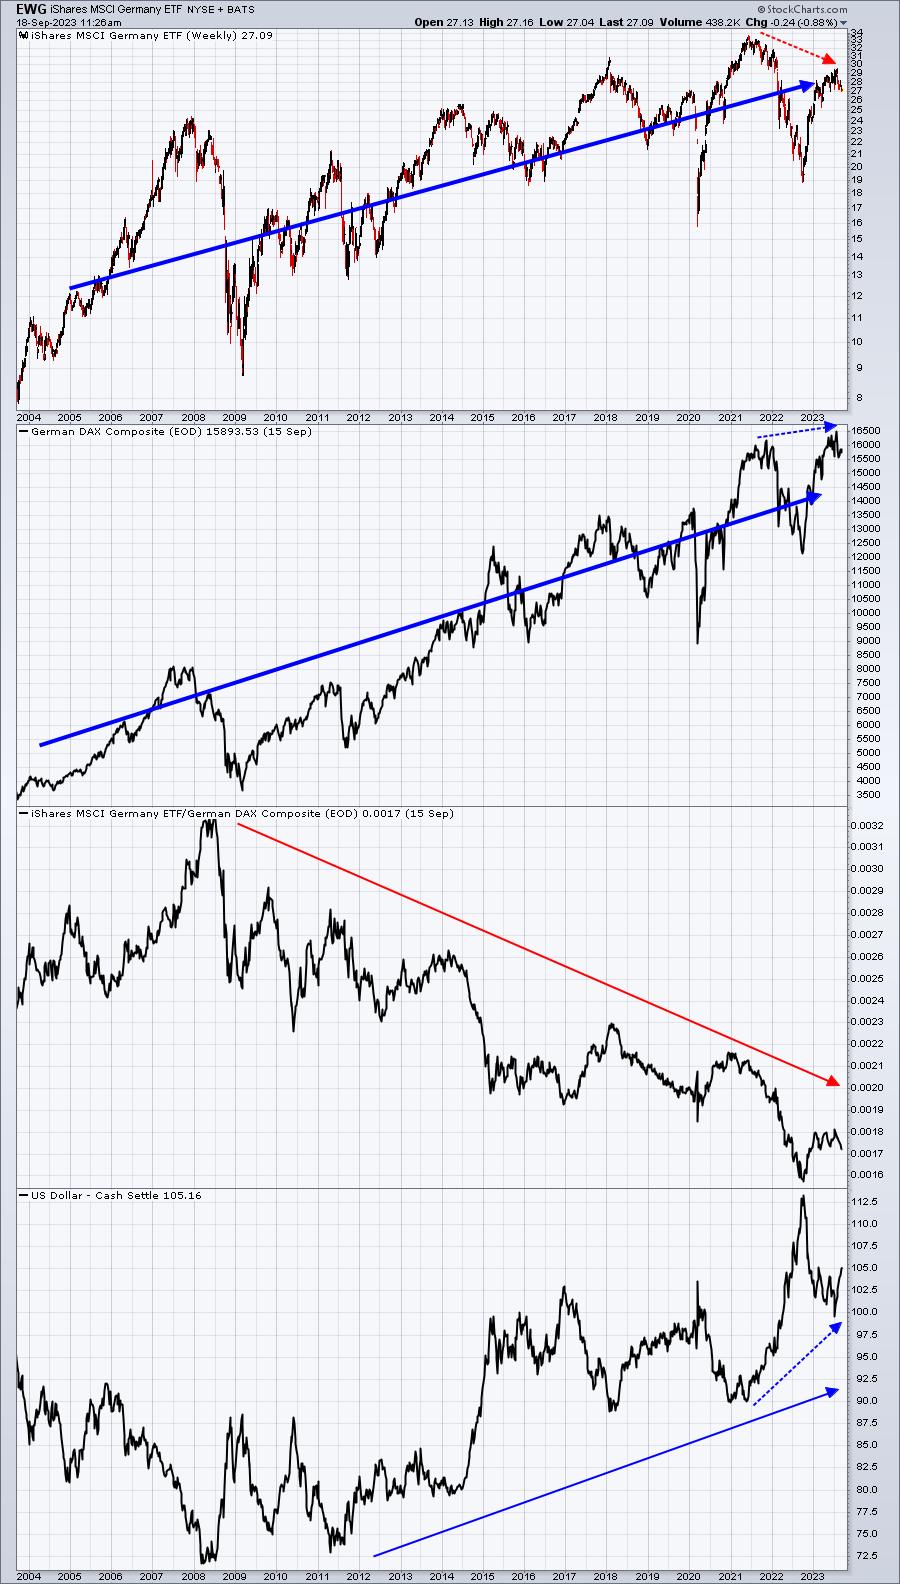
I want to draw your attention to a few things on this chart:
- The thick blue directional lines on both the EWG and DAX appear similar, both rising throughout the past 20 years. This gives the illusion that the EWG tracks the DAX perfectly.
- Look from 2021 to 2023. The EWG is lower and the DAX is higher. How can that be? Well, there's a currency component to trading international ETFs. A rising dollar eats away at EWG returns, while a falling dollar lifts EWG returns. You can see that the USD rose from 2021 through 2023 and that caused the EWG to significantly underperform the DAX.
- The EWG/DAX relative price panel has been in decline since 2008. That coincided with a bottom in the USD and a 15-year uptrend in the greenback.
Here's the bottom line. When the U.S. economy is outperforming foreign economies, or even if it's simply EXPECTED to outperform, a rising dollar will lessen the performance of foreign ETFs. And the opposite is true as well.
Trade Setups
I want to continue focusing on stocks that could run higher into year end for various reasons. In the first two weeks, I pointed out JPM, BA, and FFIV as stocks that I believe will outperform the S&P 500 into year end, possibly longer. It's still early and these potential trades should be considered more swing trades based on weekly charts and less based on daily charts. I still like all 3, though JPM has been an outperformer the past two weeks, while BA has been an underperformer. FFIV was relatively neutral last week.
This week, I have one stock that reported great results last quarter and exploded higher on massive volume. I've been patient and waiting to see if it would drop back to an area of key support. It's there now:
Upwork, Inc. (UPWK):
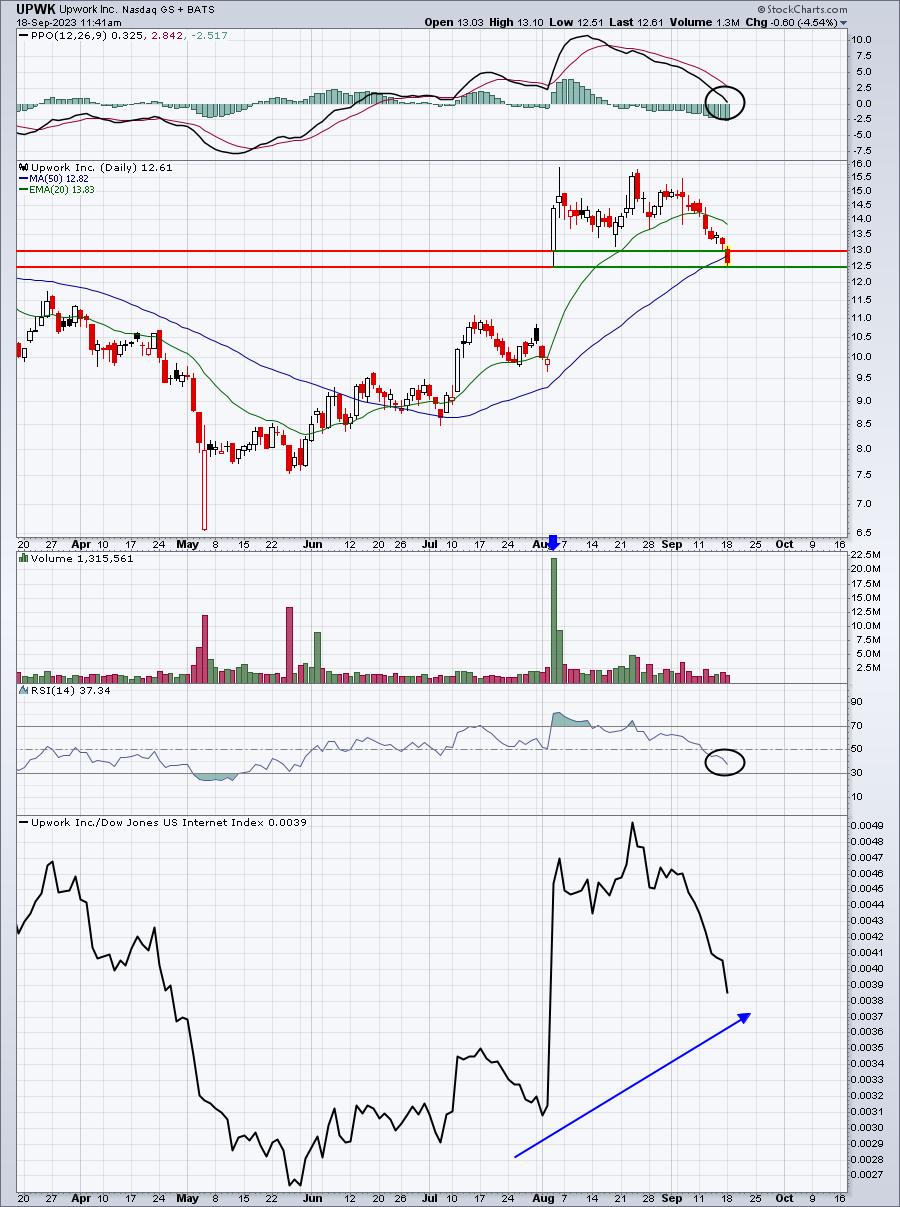
UPWK opened at 13.00 after its huge earnings report. It traded as low as 12.50 that day, meaning that, after the good news, buyers supported the stock at 12.50. Today, UPWK just hit that 12.50 low. It also opened above 13.00 at 13.03. If UPWK closes today above 13.00, it would be confirming a potential bottom. If it closes below 12.50, then we could see further selling and a possible gap fill down as low as 9.97, its closing price before earnings were announced. In my experience, the top of gap support generally holds in cases like this. I bought UPWK today as it approached 12.50 and I'll buy more if it moves back through 13.00. It's a risky trade, especially given the upcoming Fed meeting AND this time of year (latter part of September), but the technical conditions that I like are present. I'll keep a tight stop.
I want to ALWAYS remind everyone that I am NOT a Registered Investment Advisor (RIA) and am not recommending that anyone buy any securities that I mention. EarningsBeats.com, nor any of its employees, are RIAs. Please consult your financial advisor before buying or selling any securities. The above analysis should be construed as education only. You are responsible for any securities that you buy or sell.
Looking Ahead
Upcoming Earnings
We won't see much in the form of market-moving earnings reports this week. Here are a few interesting companies reporting this week, however, by day and market cap:
Monday: None
Tuesday: AZO ($46 billion)
Wednesday: FDX ($64 billion), GIS ($38 billion), KBH ($4 billion)
Thursday: DRI ($18 billion), FDS ($16 billion)
Friday: None
Key Economic Reports
There's not a lot of economic reports, but it's still a very big week, because of the latest FOMC policy statement, which we'll get on Wednesday at 2:00pm ET.
Here are this week's economic reports:
Monday: September housing market index (45 actual vs. 50 estimate)
Tuesday: FOMC meeting begins. Housing starts, building permits
Wednesday: FOMC policy statement at 2:00pm ET
Thursday: Initial jobless claims, Philadelphia Fed Mfg Index, existing home sales, leading indicators
Friday: None
Historical Data
Each week, I'll provide you the average annualized returns for each calendar day and by index. Here are the historical numbers for this week:
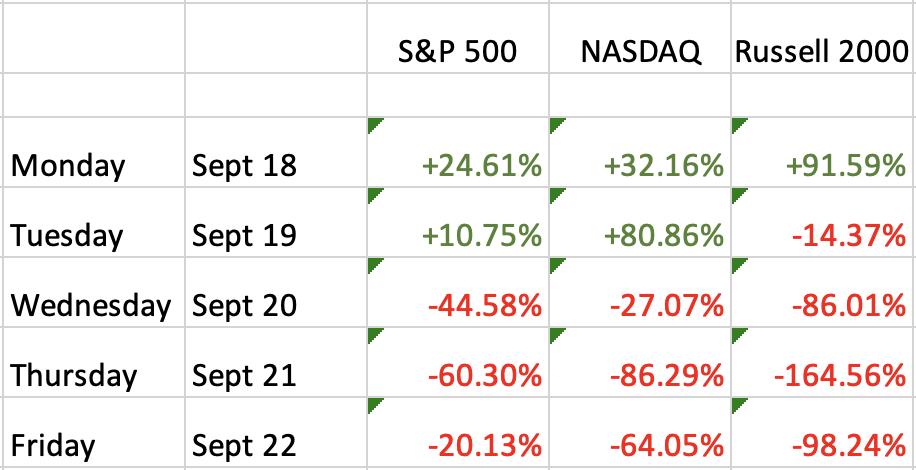
The S&P 500 data dates back to 1950, while the NASDAQ and Russell 2000 information date back to 1971 and 1987, respectively.
You can see that historical clouds begin to roll in on Tuesday and into Wednesday. Of course, we'll get the latest from the Fed on Wednesday. Will stocks follow their normal seasonal pattern and move lower or will this year be an anomaly? A lot will depend on what the Fed says as the most market participants are expecting no change in the fed funds rate.
Final Thoughts
Here is what I'm thinking right now:
- We remain in a secular bull market, but anything can happen short-term. Given the Fed meeting this week and typical market behavior in late September, it might make sense for many short-term daytraders and swing traders to be more cautious than usual.
- The CPI and PPI reports last week really show nothing to make me think the Fed will grow more hawkish, but I honestly don't trust this Fed, so we shall see.
- I like the fact that the 5-day moving average of the CPCE remains at .85. This is historically a level where we see a big jump in U.S. equity prices. This spike could occur at any time, but as we move closer to the end of the month, the more bullish I'll likely get.
- Both the home construction ($DJUSHB) and semiconductors ($DJUSSC) had bad weeks last week and could experience further downside as I mentioned in a previous EB Weekly Market Report; 9295 is a key closing support level on the DJUSSC, so watch it closely. Failure there could lead to another 12-15% decline, based on its potential head & shoulders top.
- Earnings news will remain very light, with only one truly key report - FDX. Obviously, the key economic news will be the Fed meeting and what Fed Chief Powell has to say afterwards. Volatility can be severe after a policy decision is announced.
- I'm not really seeing any significant long-term deterioration in my sustainability ratios. I do expect many of them to weaken as we move into Q4 as value-oriented stocks have a history of leading into year end.
- Many companies throw out their "dirty laundry" in late September. Don't be surprised to see a highly-visible company or three issue revenue/EPS warnings for the current quarter. They can't "kick the can down the road" any longer as year end is approaching.
- As we move into the upcoming bearish historical period, many media outlets will discuss armageddon, especially if we show further short-term weakness. I'll, on the other hand, be studying rotation to gather more clues in terms of leadership as we approach the VERY bullish fourth quarter.
Feedback
I hope you enjoyed our third edition of our EB Weekly Market Report! We'd absolutely love your feedback, whether positive or negative. Let us know what you think by sending us your comments to "[email protected]". We are still working to improve the layout and presentation and encourage you to share your thoughts with respect to this exciting new report!
Thanks and happy trading!
Tom