
EB Weekly Market Report - Monday, October 2, 2023
October Seasonality ChartList Available
Just wanted to let everyone know that the October Seasonality ChartList has been updated, complete with 1 or 2 key support levels annotated onto each of the 20 stocks' charts. You can view or download this ChartList at our website.
Our first month of Weekly Market Reports is now complete. Thanks to everyone that has provided feedback. Please keep the feedback coming, our door is always open! We are continuing to make changes based on this feedback. One change that we absolutely will make is how our report appears in your email. We understand it's annoying to scroll back and forth to read our content and every email provider is different in this regard. The appearance currently depends on your email provider, but we'll have a solution that will work for everyone. Hopefully, we'll have this change made within a week or two. You can reach out to us at "[email protected]" to share any suggestions, criticisms, or a good-old fashioned "Well Done!". Again, we read every comment so now is a GREAT time to have your voice heard.
Because of our "top-down" approach to trading, it makes a lot of sense to begin each week with a Big Picture focus or refresher, citing the current long-term technical outlook and how that might impact the market given our short-term signals that we discuss daily. Our EB Weekly Market Report will also provide a consistent, once-per-week review at key sentiment and intermarket relationships that we value so highly at EarningsBeats.com and has helped us to guide our members through a very tumultuous 3-4 year period, beginning with the 2020 pandemic, right through the most recent 2022 cyclical bear market and subsequent 2023 secular bull market advance.
We'll also review the prior week's action and provide trade setups, but mostly with a longer-term mindset - think of longer-term swing trading, which should appeal to those of you that like the idea of longer-term momentum trading, providing wider stops and targets.
On to October....
Weekly Market Recap
Major Indices
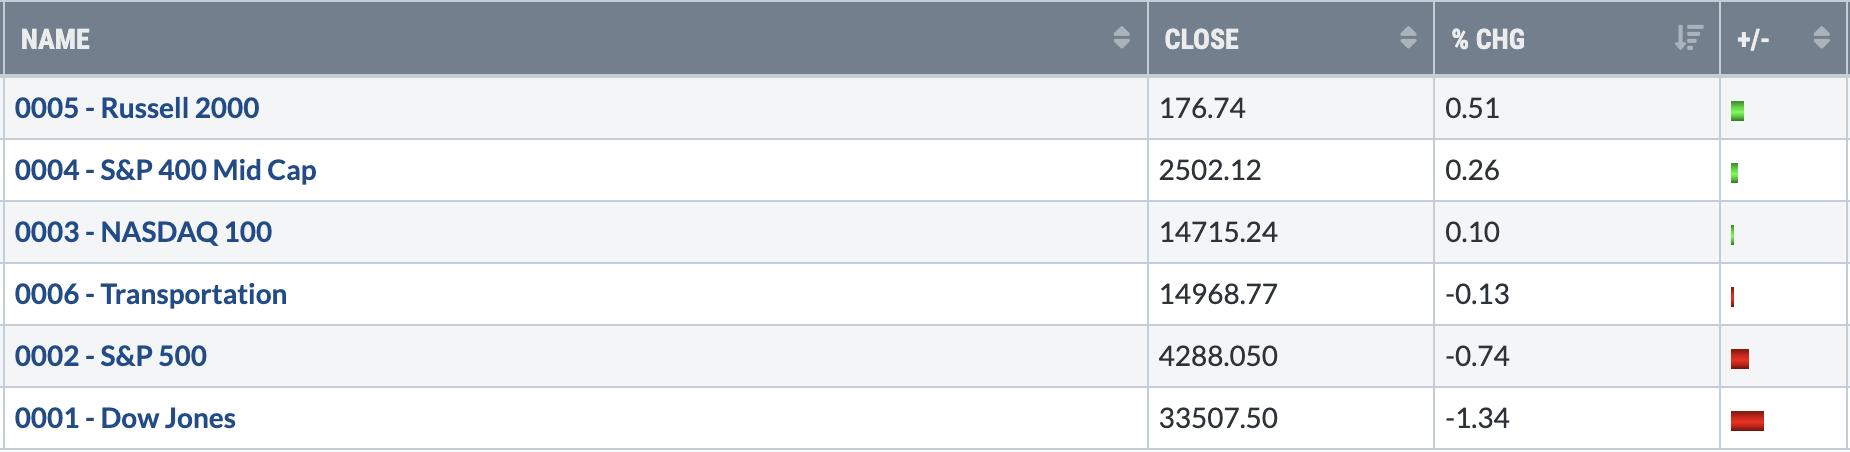
It was a relatively flat week as the NASDAQ finished almost squarely on its previous weekly close. We saw a bit of relative strength in the small cap Russell, while the Dow Jones and S&P 500 lagged. The Dow Jones lost a short-term price support level, so we can focus on a price support level that could be significant for two reasons:
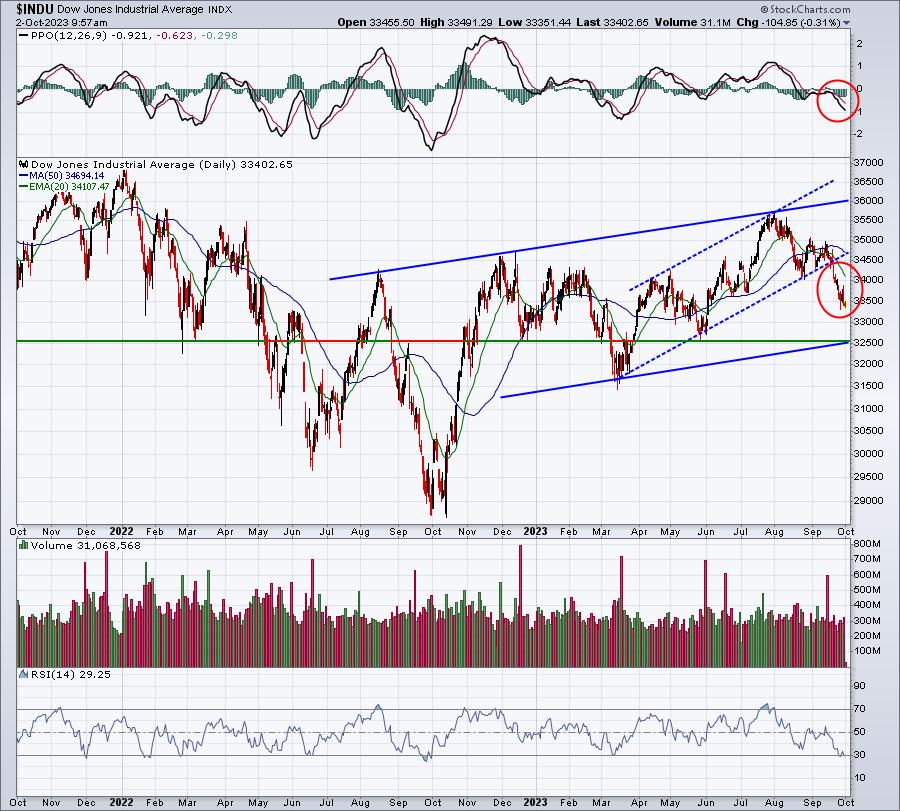
I'm not predicting that the Dow Jones will lose another 1000 points. I still remain bullish for Q4, but you have to understand the new risk in the Dow Jones, given September's channel breakdown.
First, the 6-month channel (blue-dotted lines) was not sustainable. The Dow Jones cannot move higher at the pace of 10% every six months. We're talking about conglomerates that grow their earnings at a very modest clip, with the possible exception of a few of the technology names. So that channel was very likely to break at some point. The solid blue lines mark another possible channel where prices would move up at a much slower pace. This IS a more sustainable channel to watch. We never know when the upper and lower channel lines will be tested, which is why I said I'm not suggesting the Dow Jones will drop back to 32500 price and channel support. But 32500 is currently the most formidable support on this chart. In other words, the closer the Dow Jones gravitates to this level, the better the reward to risk is to trade this index (DIA is an ETF that tracks the Dow Jones). Trading successfully is all about managing risk, while optimizing return.
Sectors
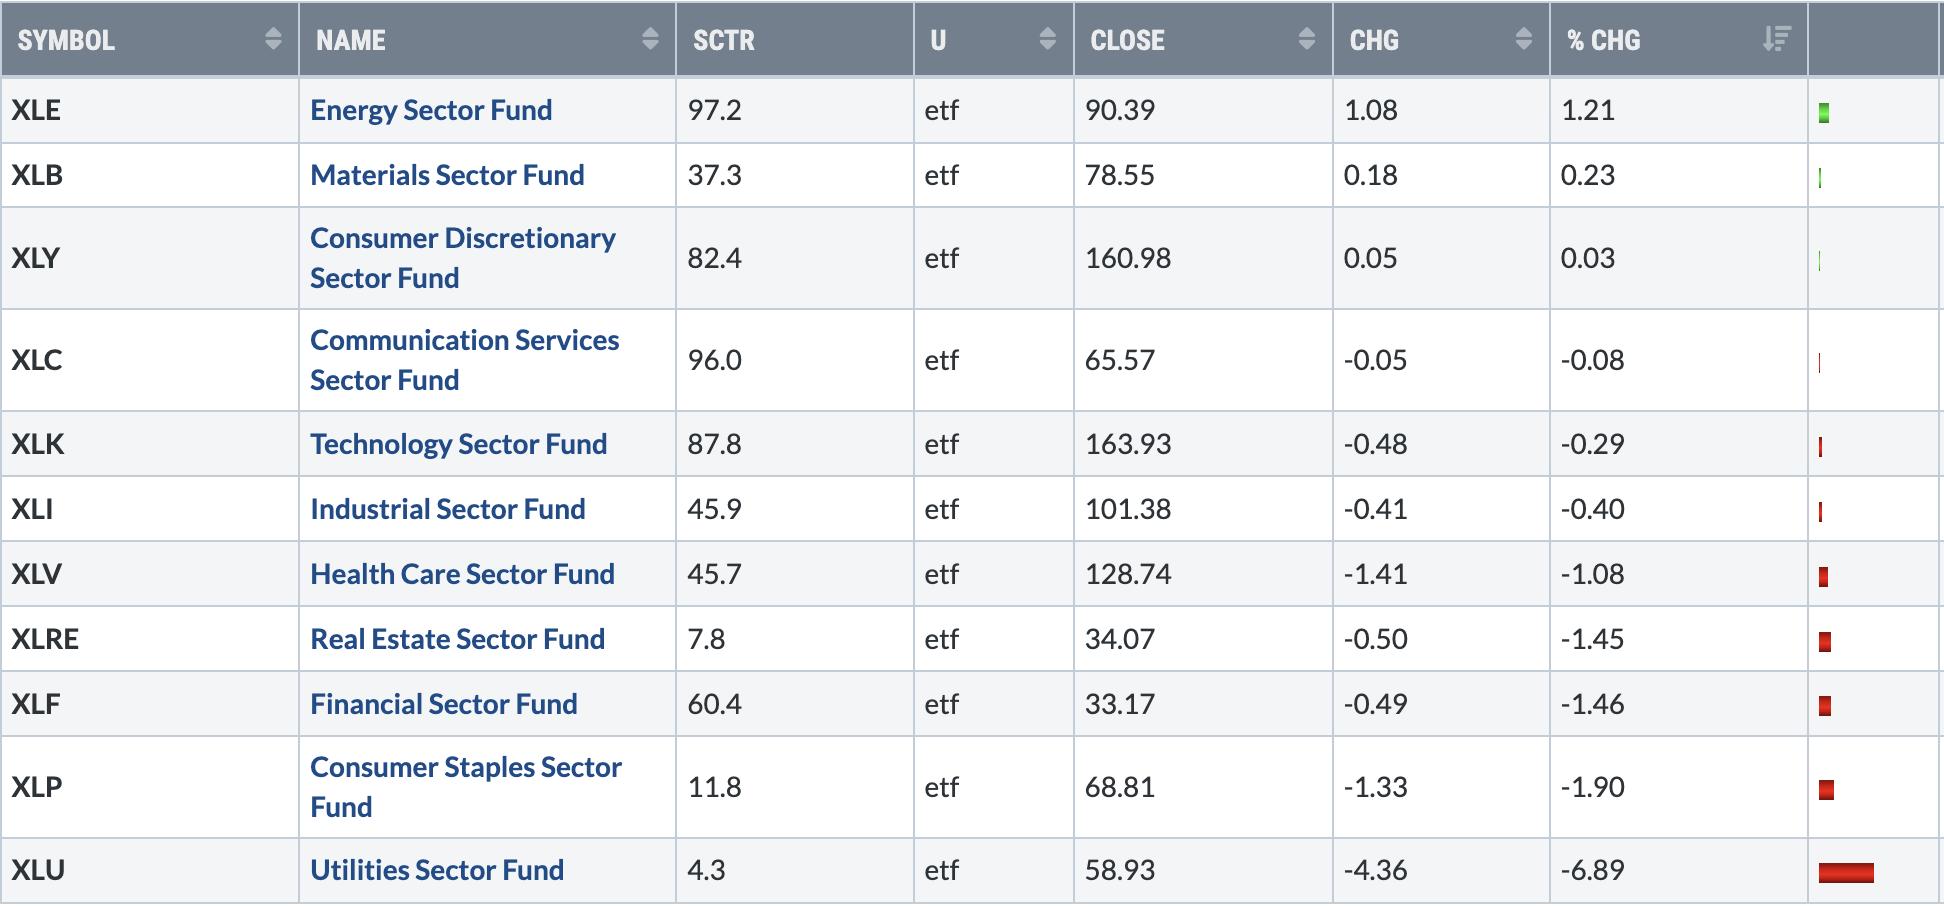
Utilities (XLU) have been crushed and certainly a big part of it has been the surge in the 10-year treasury yield ($TNX). Income-oriented investors usually flock to utilities, because of the high dividend yields. But as those investors can choose to lock in the safety of 10-year treasury yields, they abandon utilities. Many of those utilities now boast even higher dividend yields, but those yields are not guaranteed. It's hard to knock a 10-year treasury note whose interest rate is approaching 5%. One way to explain this visually is to, you guessed it, look at a chart:
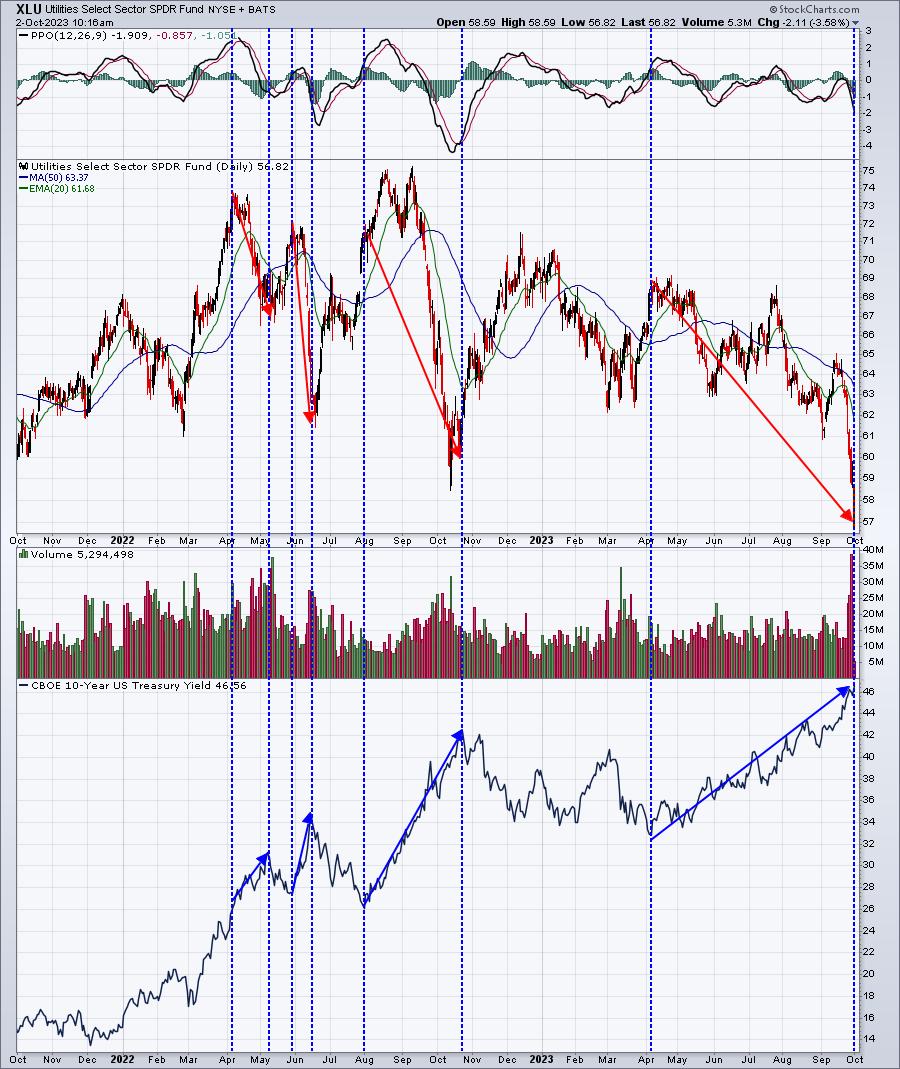
In the bottom panel, I've pointed out some of the biggest surges in the TNX over the past couple years. March 2022 was an exception where utilities gained while the TNX moved up, but the strength in utilities at that time could be explained by the cyclical bear market. Money typically finds defensive areas like utilities as bear market fear begins to take its toll on stocks. Otherwise, surges in the TNX have accompanied extremely weak price action in utilities.
Top 10 Industries Last Week
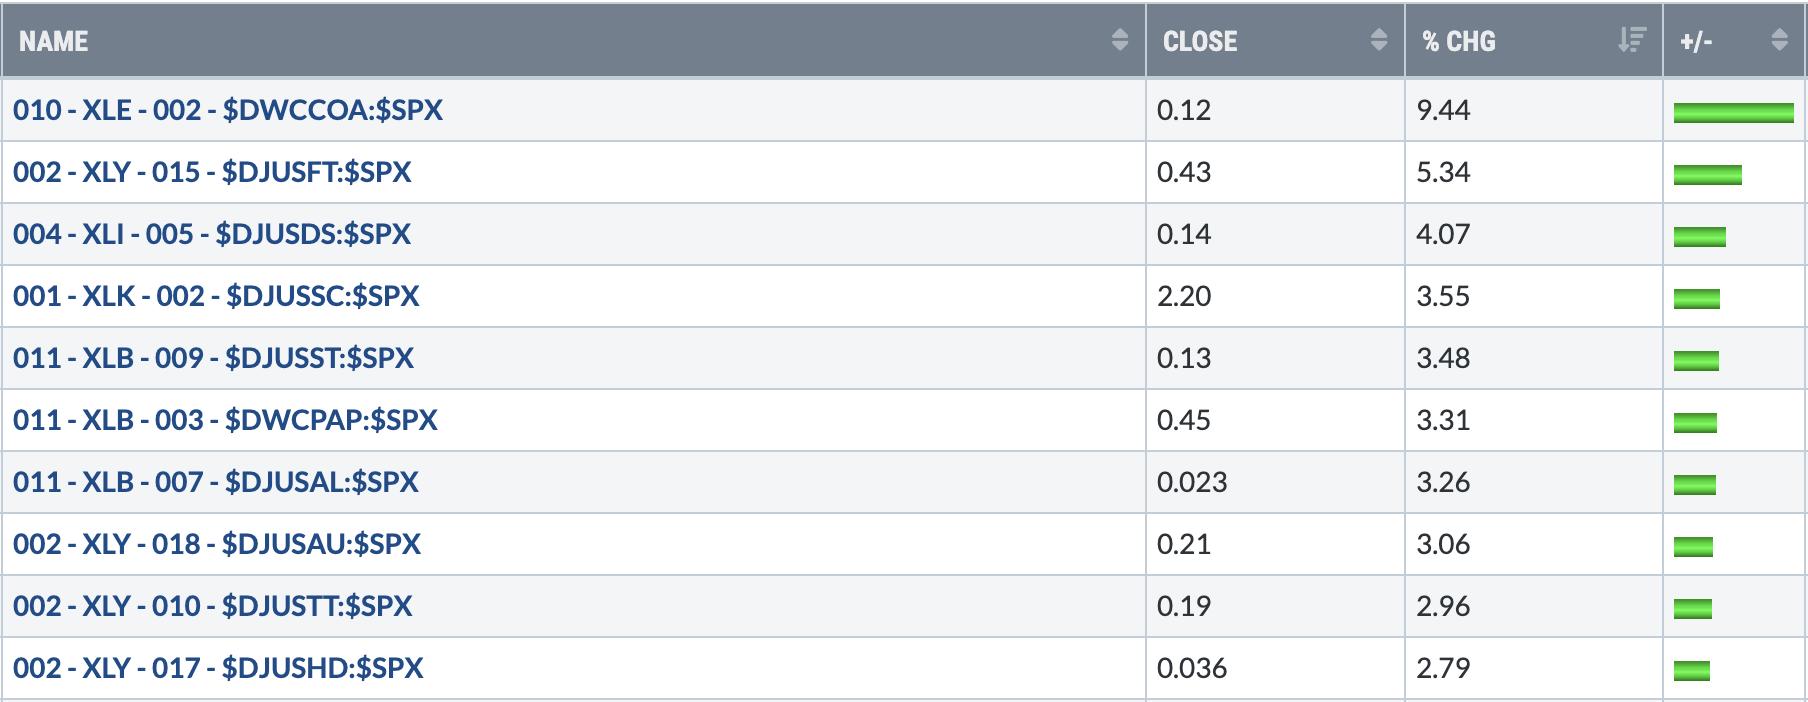
I've numbered industry groups in this ChartList by including the sector that they're in. Footwear ($DJUSFT) was one of the best-performing industry groups, but I doubt that short-term strength continues based on its chart. The downtrend channel remains in play, but it is worth pointing out that another low could see a positive divergence emerge:
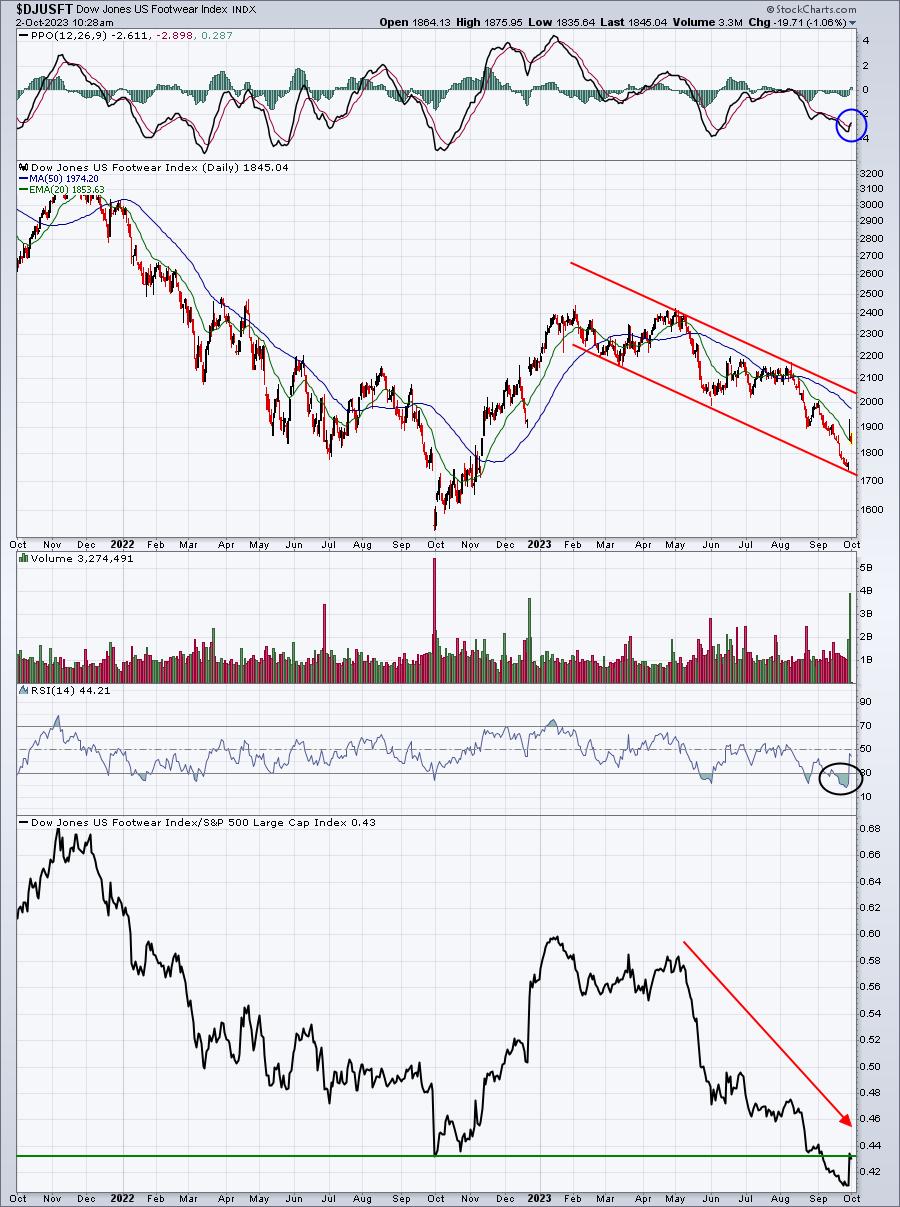
Note that while absolute price action here remained well above the October 2022 low, relative price action did not. In other words, footwear continues to lag vs. the benchmark S&P 500 as money finds other better alternatives to invest in. The Nike (NKE) quarterly earnings report late week was responsible for the price surge on both an absolute and relative basis. It'll be interesting to see if this was simply a bounce or if it marks a more meaningful period of rotation into this beaten-down group.
Bottom 10 Industries Last Week
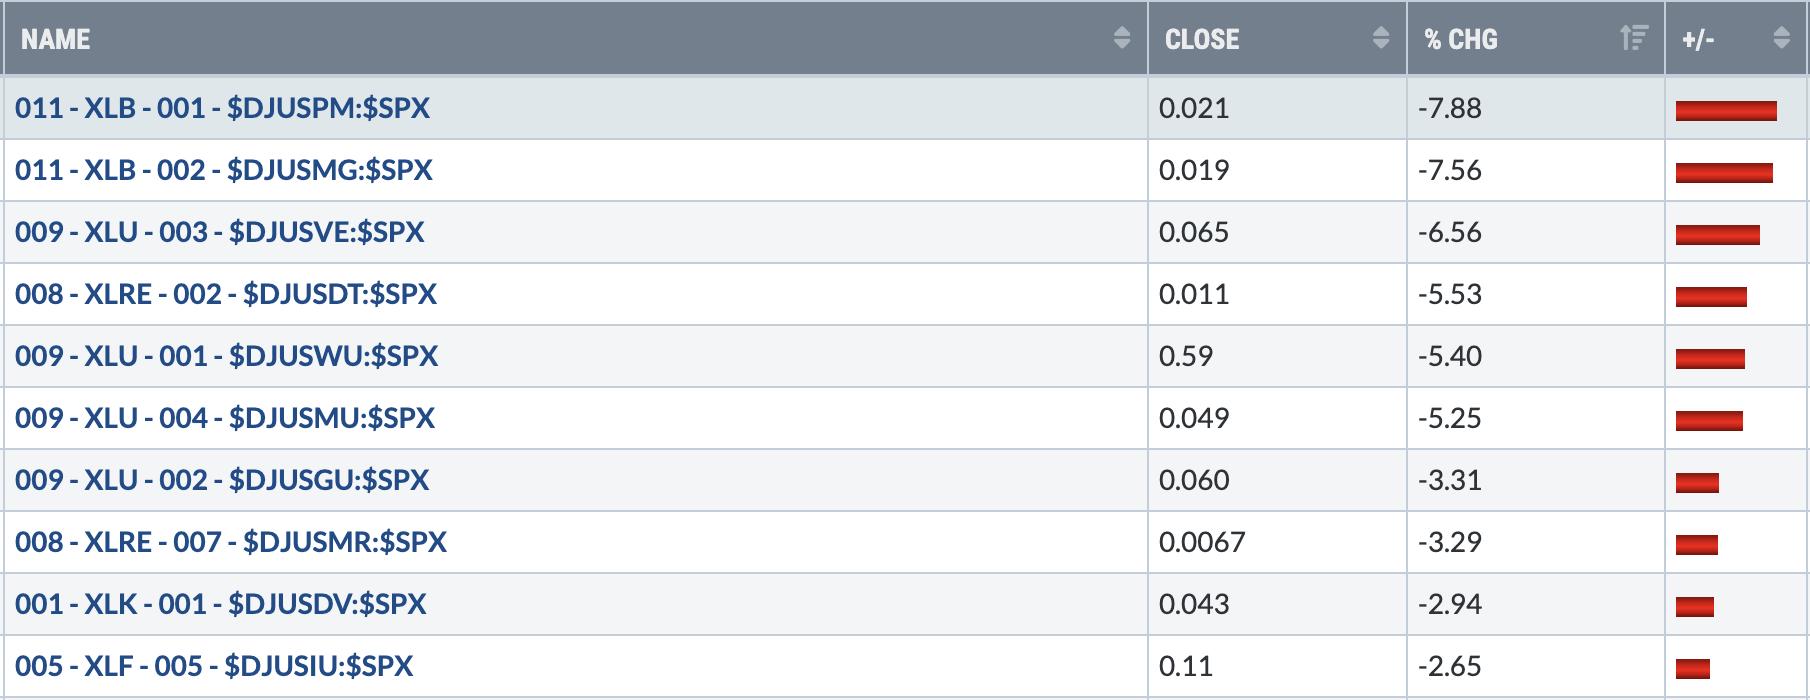
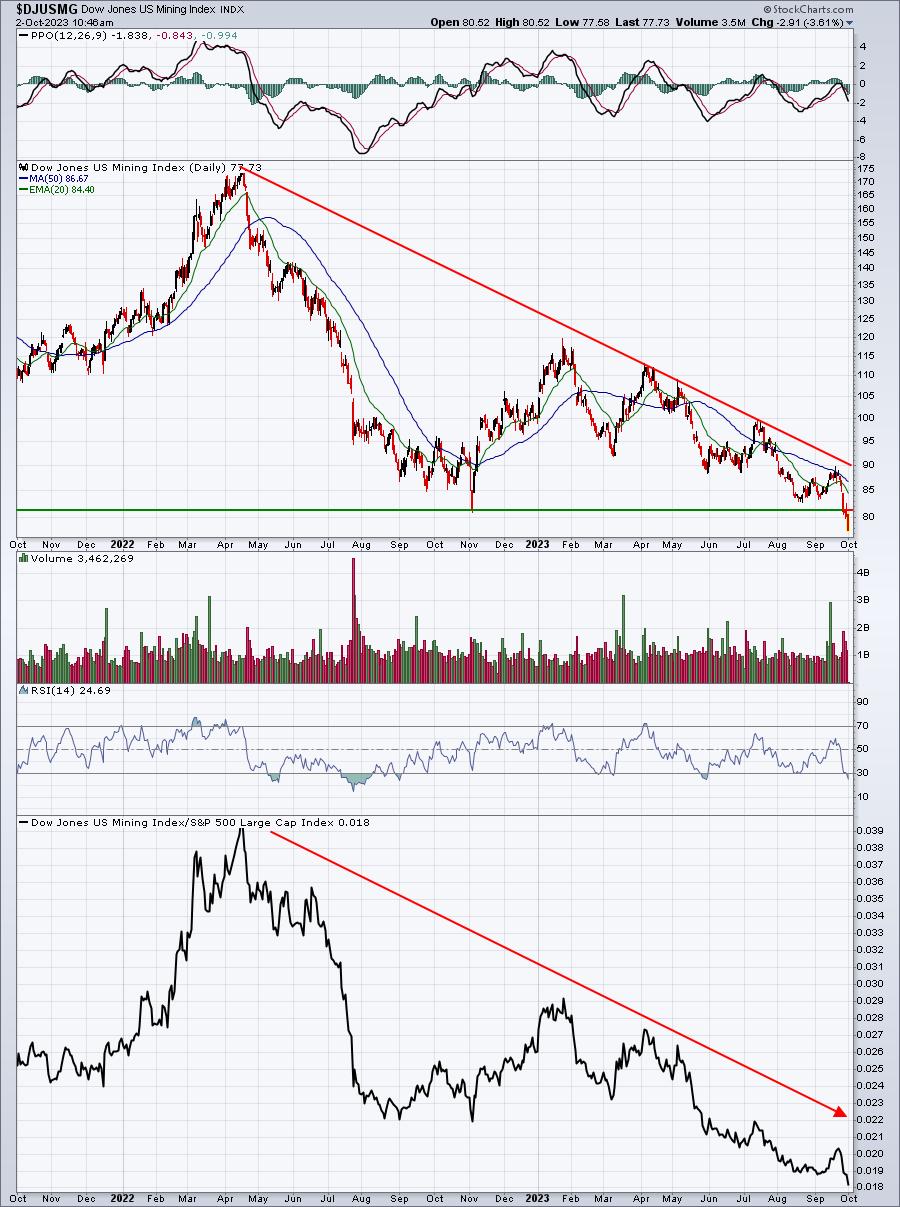
Many had pointed out the bullish price pattern of gold ($GOLD) earlier in 2023. I wasn't one of them as I look at gold a bit differently than most. Gold is a separate asset class that appeals to investors during times of high volatility and fear. Last week, both the precious metals stocks ($DJUSPM) and mining stocks ($DJUSMG) broke down, even though volatility ($VIX) was surging intraweek and finished fairly flat. It's one more reason that I believe the market is telling us that volatility will calm down and return to recent lows. That's not a great environment for precious metals and miners, so I look at breakdowns in both of these industries to be a bullish signal for U.S. equities ahead. Check out the breakdowns:
$DJUSPM:
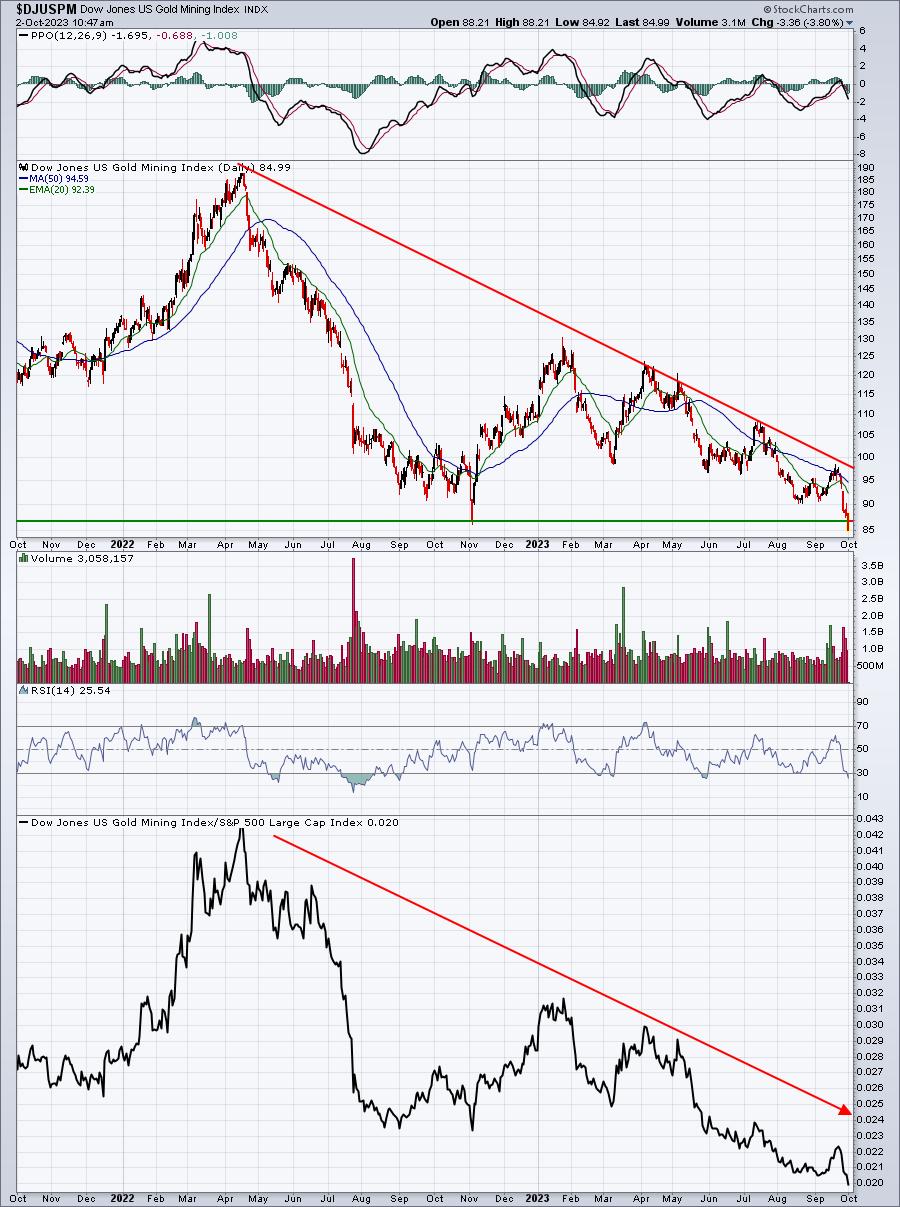
$DJUSMG:
And here's gold ($GOLD) itself. Check out how its relative strength vs. the S&P 500 continues to deteriorate:
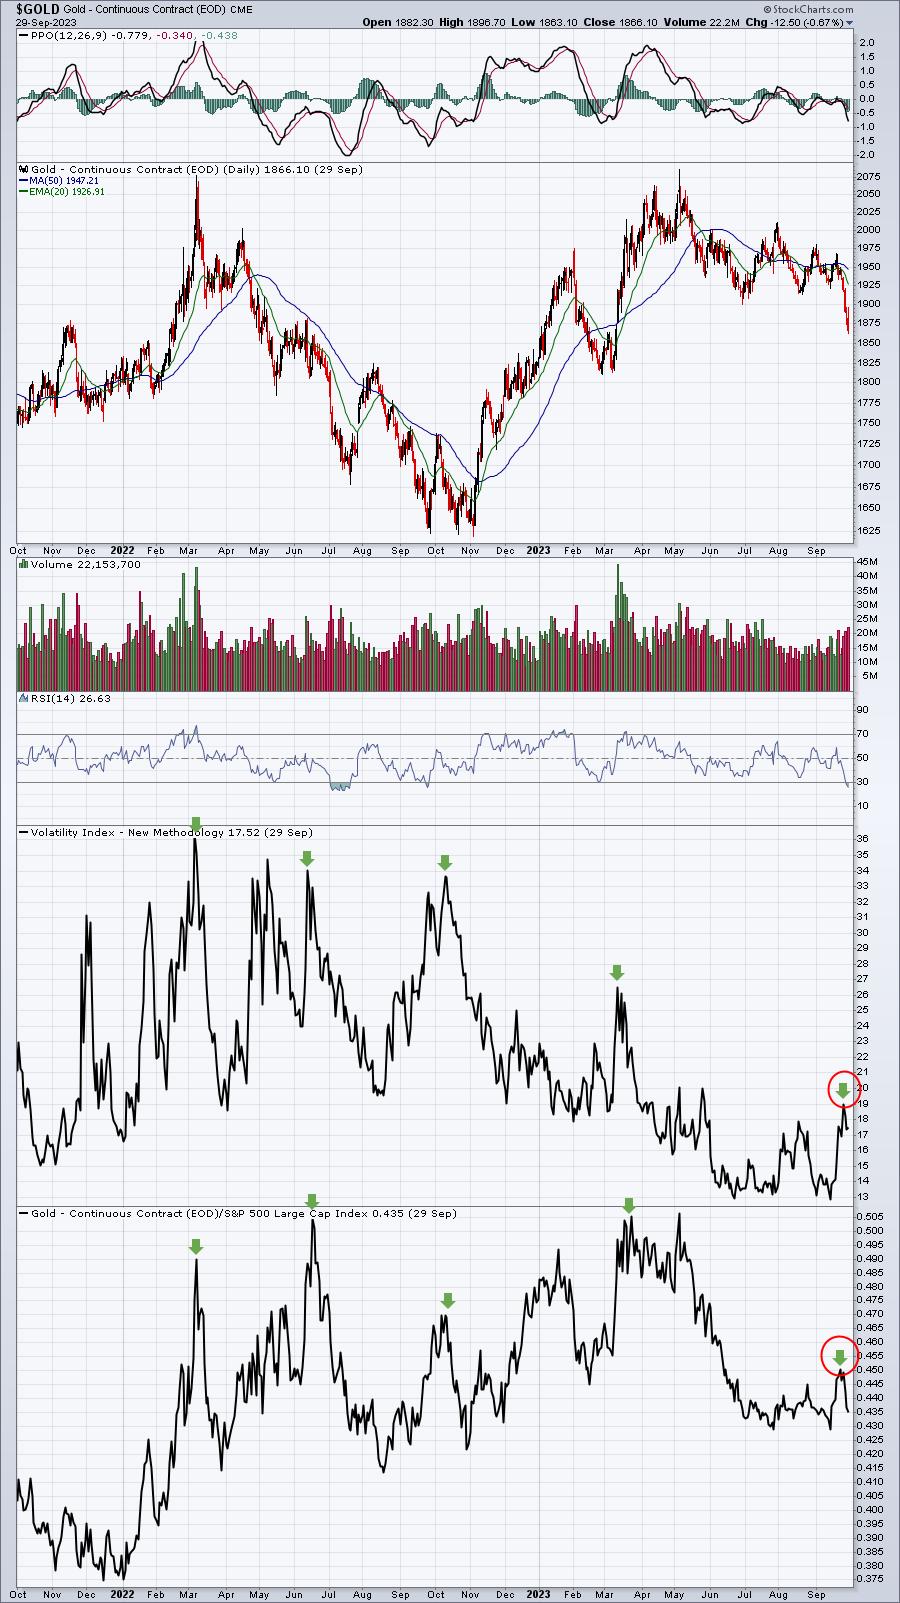
Gold made a GREAT investment during the January-June period of the cyclical bear market in 2022. But once signals emerged that a stock market bottom was in, you can see the relative performance of gold deteriorate. More recently, in September, volatility increased, the S&P 500 lost 4300 price support, and yet gold's relative bounce was much, much lower than those earlier in 2022 and 2023. And today, the GOLD:SPX relative ratio is very close to a 2023 low, despite all the summer "noise" and price decline. If Wall Street firms are not willing to commit to gold during a period of turmoil, then neither am I.
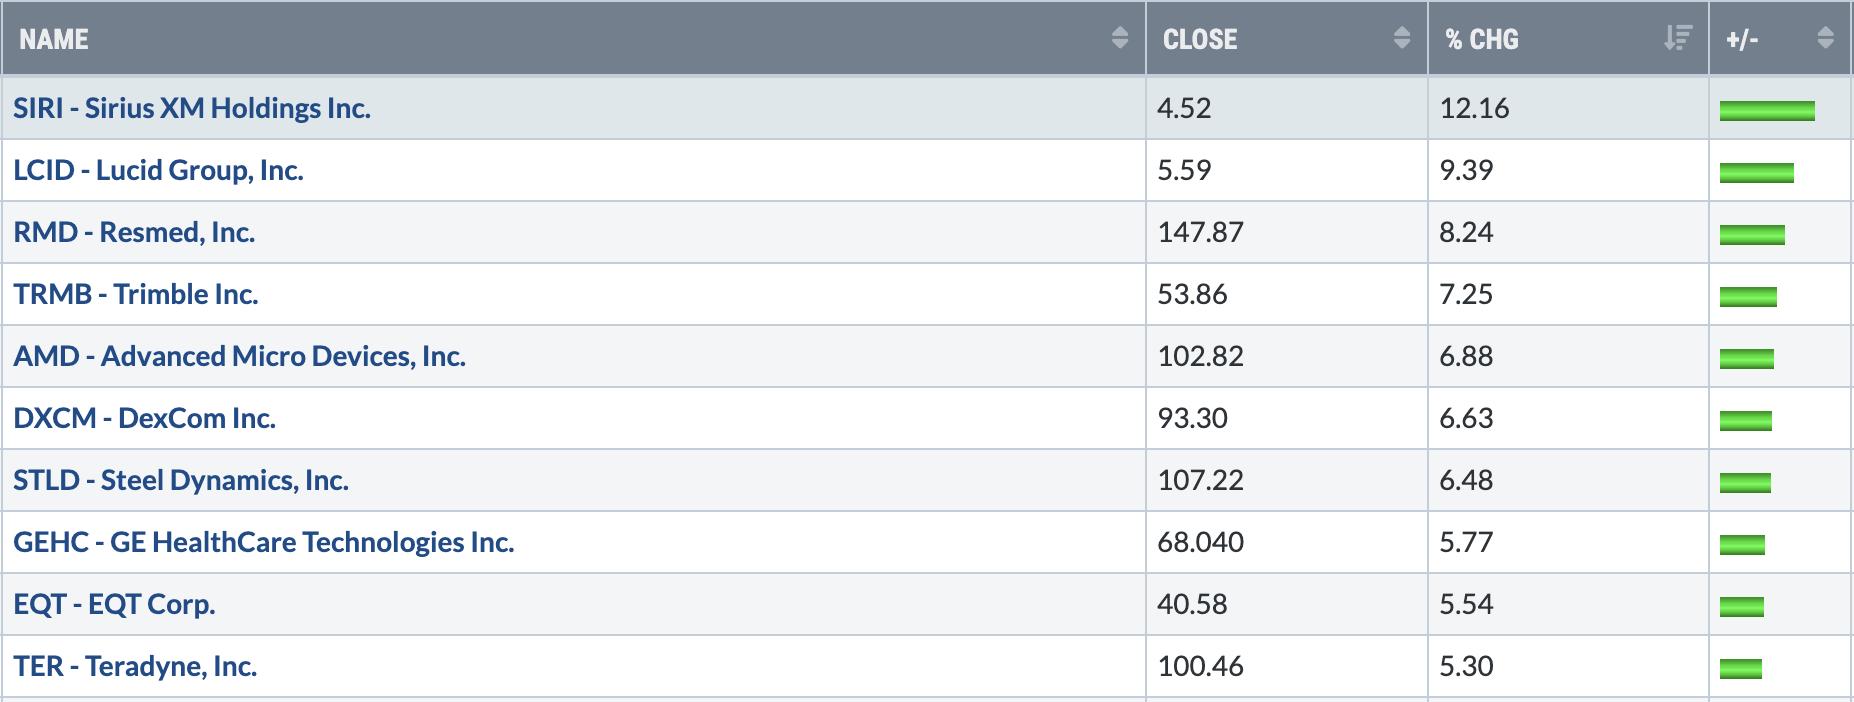
Top 10 Stocks - S&P 500/NASDAQ 100
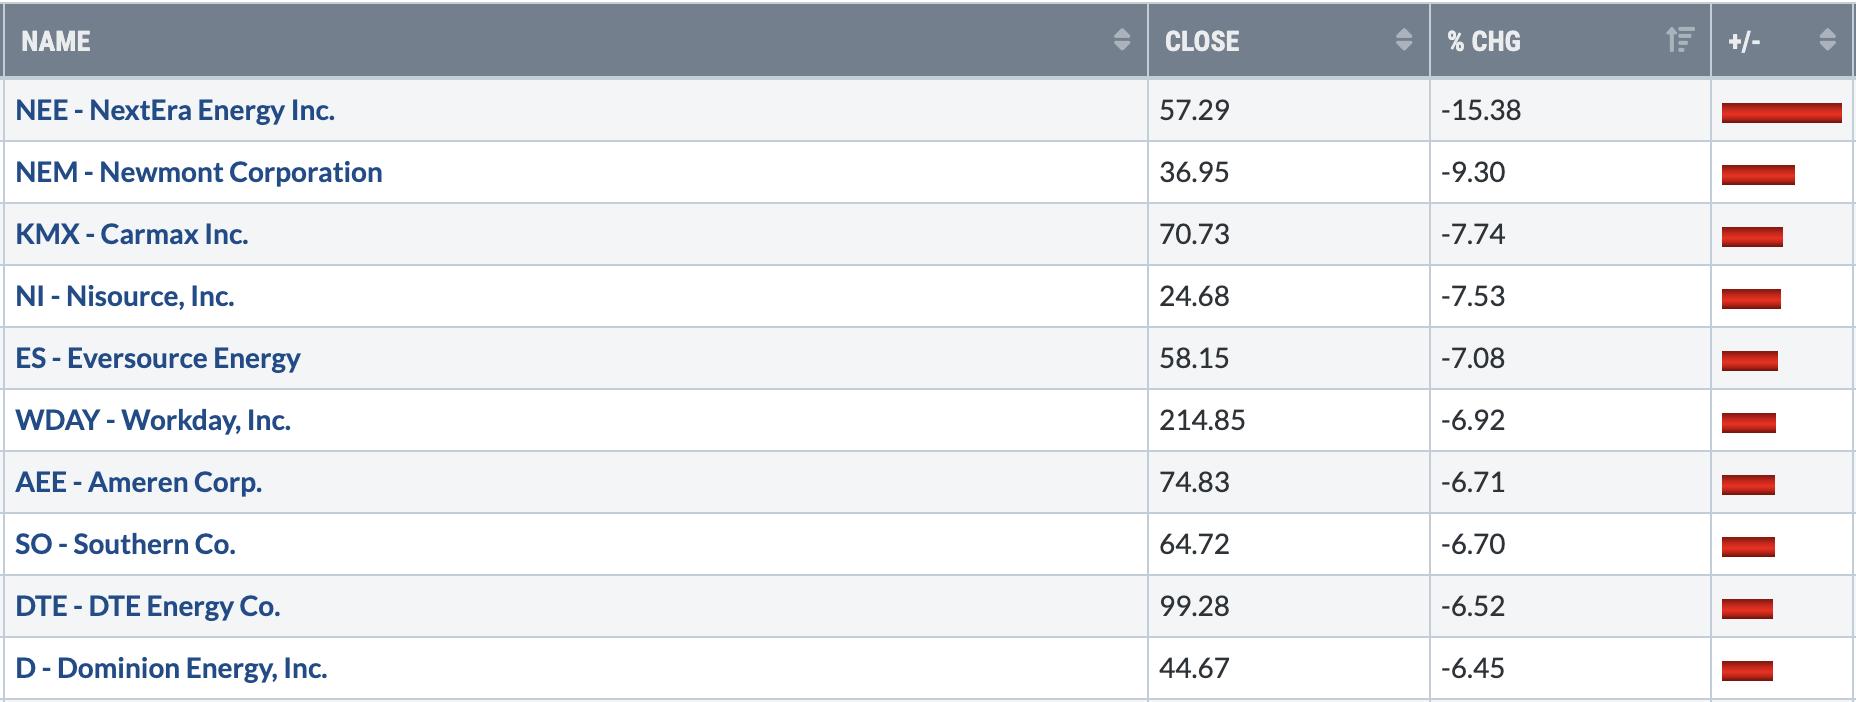
Bottom 10 Stocks - S&P 500/NASDAQ 100
Big Picture - October 2023
This is a chart that doesn't change much from week to week. Accordingly, beginning in October 2023, I will only provide this chart in the first EB Weekly Market Report of each calendar month:
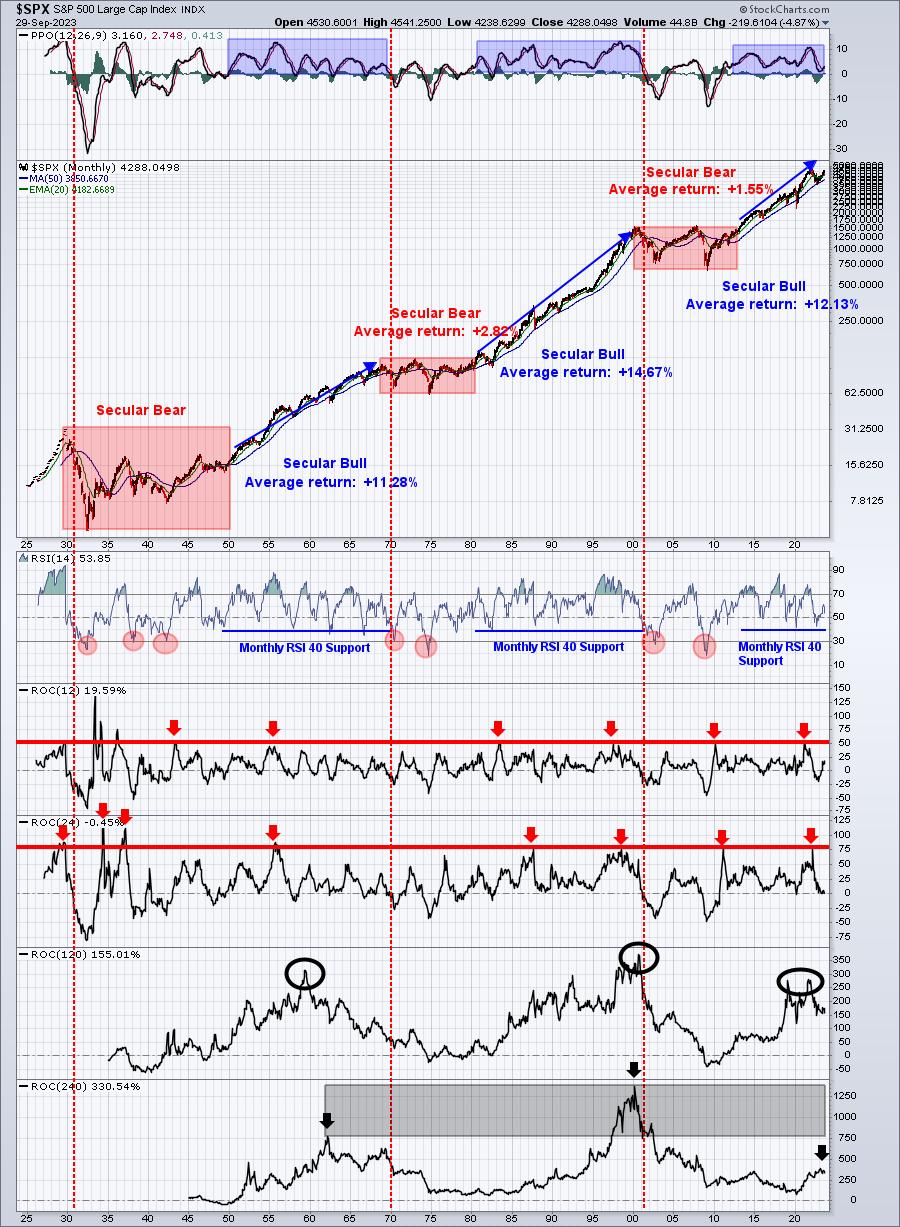
October Update:
It's the first Monday of the month, so let's check in to this chart to see if any significant changes have occurred. Keep in mind this is a MONTHLY chart, so reviewing it in detail every week really isn't necessary. I like to look at price action/channels, divergences, RSI, and the rates of change (ROC) from 2-year, 10-year, and 20-year perspectives. This chart really helps to keep me grounded, instead of focusing entirely on daily charts, which can change character quite often and have you questioning what you actually see. Daily charts and media outlets are a dangerous combination, where it's very easy to allow your mind to focus on short-term back and forth action that's not so important if you maintain long-term perspective.
Despite the summer turbulence that we've seen since mid-July, this long-term monthly chart hasn't really budged. The monthly PPO, after nearly touching centerline support, is well above zero and trending back to the upside, which is indicative of a secular bull market. The monthly RSI dropped, as we should expect, but at 53, we're still well above the key RSI 40 level. None of our ROC levels (2-year, 10-year, or 20-year) are flashing alerts.
I see absolutely nothing that would worry me as a long-term investor.
Major Indices
Last week, I mentioned the S&P 500 looked GREAT as it was still holding onto price support at 4305 and remained in a fairly well-defined intermediate-term channel. Well, the price support was lost
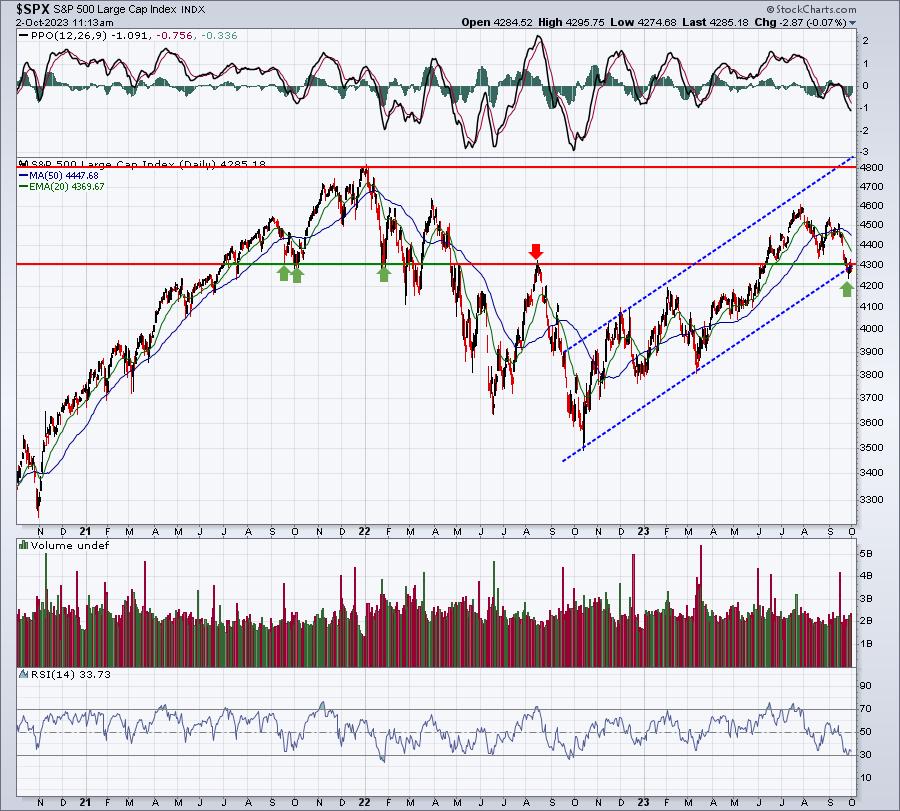
Channel lines are quite subjective as I could connect intraday highs and lows, closing highs and lows, or some mixture of both. While I wouldn't say we've seen a breakdown that automatically signals the likelihood of lower prices, the further we drop, the more ominous this chart looks. One conservative strategy for short- to intermediate-term traders would simply be to wait until the S&P 500 closes back above 4305. We've done it intraday - last Thursday and Friday - but were unable to close there in both cases. We remain below 4305 as I write this.
I also wrote last week about the hourly positive divergence and how that could be a catalyst for higher S&P 500 prices in the very near-term. Let's check out that chart:
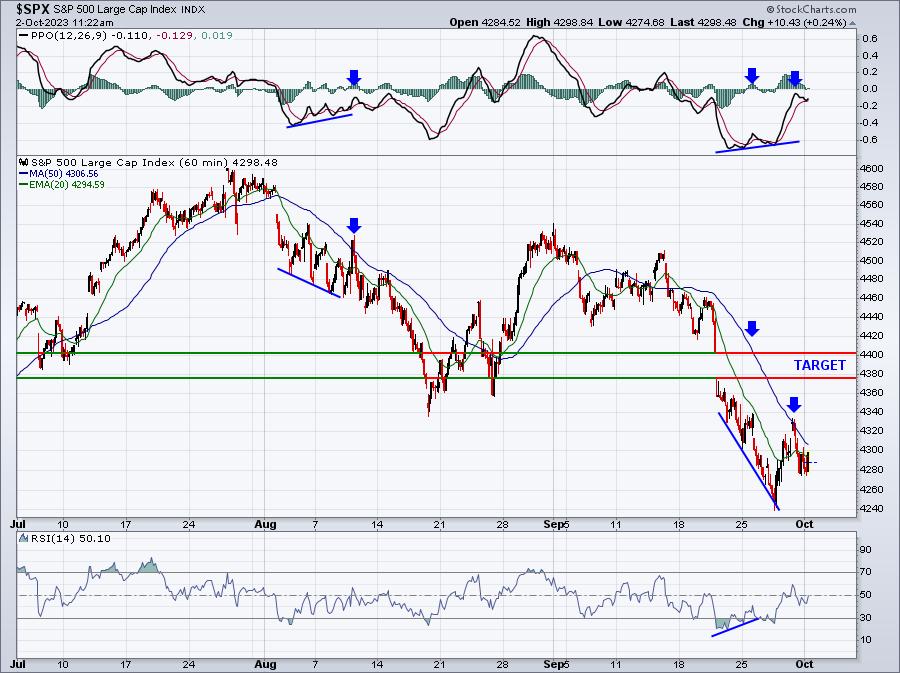
Short-term, the positive divergence resulted in exactly what we should expect - a 50-period SMA test and a PPO centerline test (last blue arrows to the right). I also highlighted a prior positive divergence in August, to show you that this divergence played out nearly the same way. After that PPO centerline test occurs, the market is free to move in whichever direction it desires. In August, it continued lower. Currently, it's giving us the indication that's what it's doing again. I'll keep watching.
Intermarket Relationships:
Many times I refer to these intermarket relationships as sustainability ratios. They provide us clues as to the likelihood that a current market trend will continue. If the S&P 500 is rising, I feel much more confident about it continuing if our sustainability ratios are rising as well. I believe some of these ratios are more important than others, so I'll provide the two that are most important to me:
Consumer discretionary vs. Consumer staples (XLY:XLP):
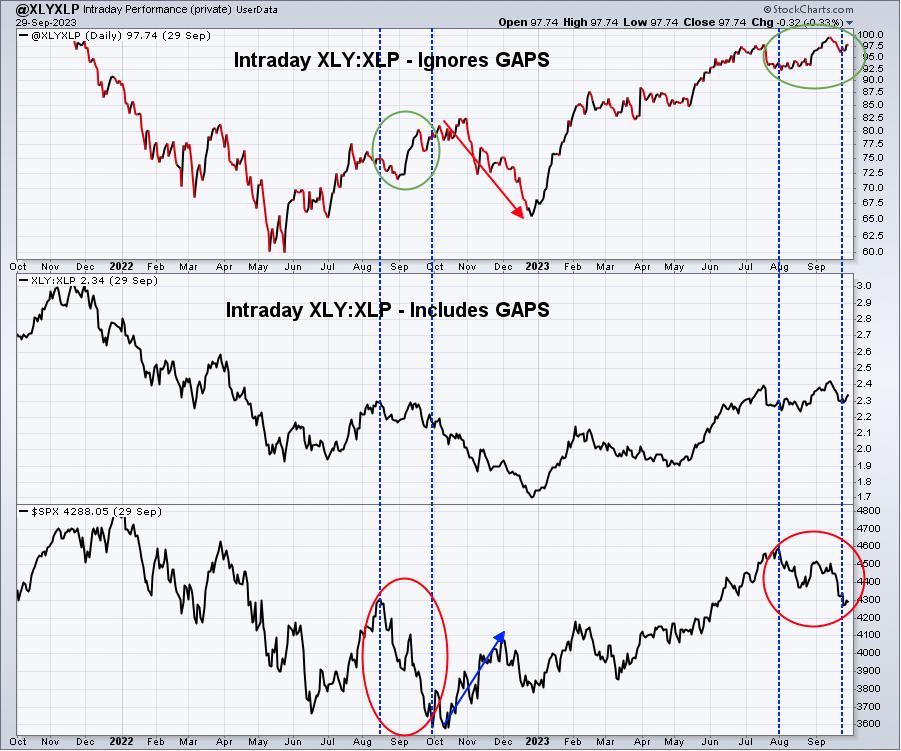
The S&P 500 remains in an A-B-C corrective pattern, but the XLY:XLP looks very strong, especially if we ignore gaps and simply look at the XLY:XLP rotation intraday. We're not far at all from this ratio moving to a fresh new high. Think about what's happening here. The S&P 500 keeps pushing lower and we keep hearing about a possible recession ahead. Yet during the trading day, more money is rotating from staples (XLP) to discretionary (XLY). You simply would NOT rotate into discretionary vs. staples if you were expecting a recession and further downside in the S&P 500. This is why I don't believe the selling lasts for much longer. I could be wrong, but I listen to my signals.
NASDAQ 100 vs. S&P 500 (QQQ:SPY)
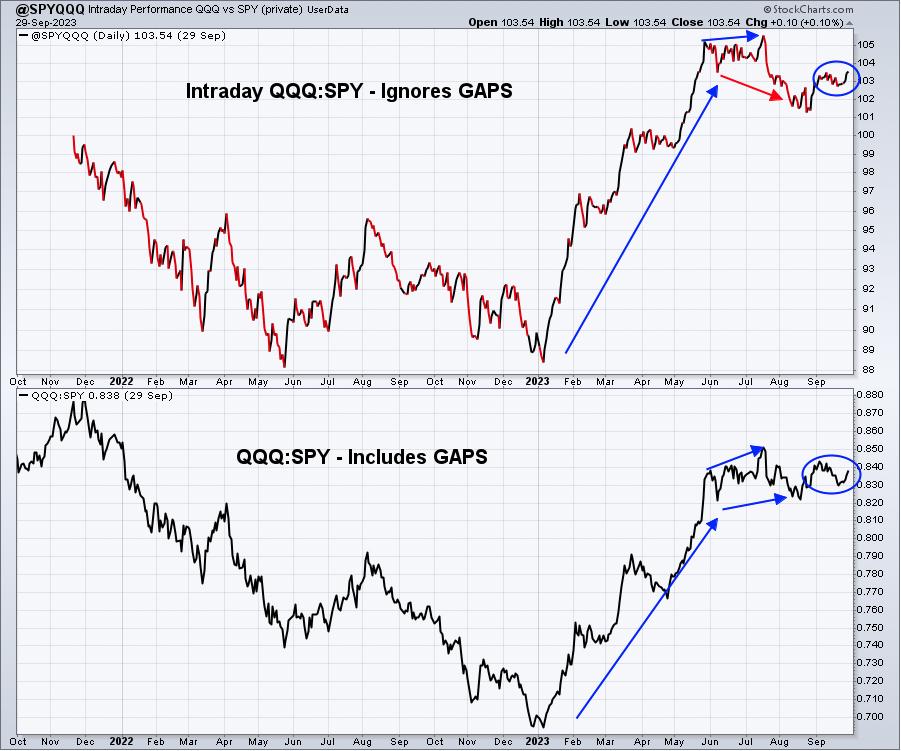
The QQQ was extremely overbought back in July and had every right to take a back seat to the SPY, and it did for a month. But as the S&P 500 falls further, we're actually seeing the QQQ outperform as this intraday rotation (ignoring gaps) has moved to a 2+ month high. Again, Wall Street is rotating INTO a more aggressive index that's loaded with high growth stocks. Does this smell like investing behavior you'd expect as a recession draws near? It doesn't smell like it to me either.
Finally, let's take a look at the IWM relative to the QQQ. I've been on record since the beginning of June, saying that I believed we'd see outperformance of small caps. We had an initial pop that saw IWM outperform, but otherwise it's been a choppy period of small cap relative performance. Today, we're actually seeing that IWM:QQQ ratio definitively break beneath the early-June low:
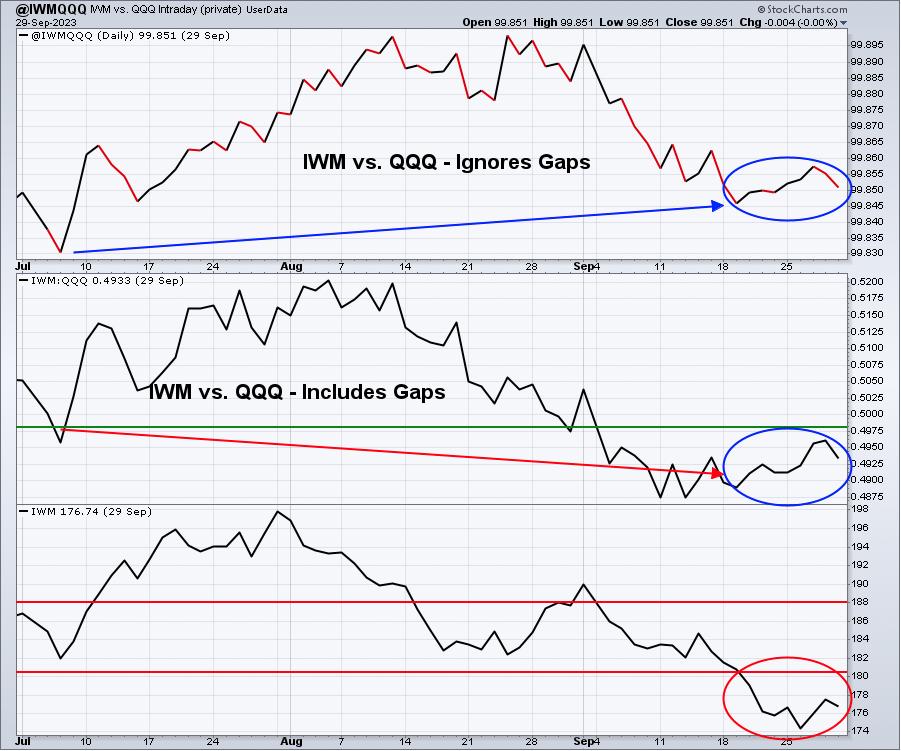
Please note that this chart doesn't get updated until we have the closing price. So it's a chart as of Friday, September 29th. You can see the bottom panel highlighting the IWM's weakness and move to a 3-month low. The IWM:QQQ ratio, however, has been holding up much better, especially that top panel where the INTRADAY ratio is still actually well above that July low. So we have a mixed bag. Still, I've been favoring the IWM in my trading and it's been costing me. Today is no exception. I'm still favoring the IWM in my portfolio allocation, but I'm watching all of these ratios, contemplating a change that would focus more on the QQQ. It could be that Wall Street is sticking with the largest of aggressive growth names heading into earnings season.
Sentiment
I think it's important to point out the equity only put call ratio ($CPCE), whose 5-day SMA remains quite elevated and above .80. I find it difficult to believe that we'll see significant downside action from here with still so much negativity among retail options traders. Check out this update:
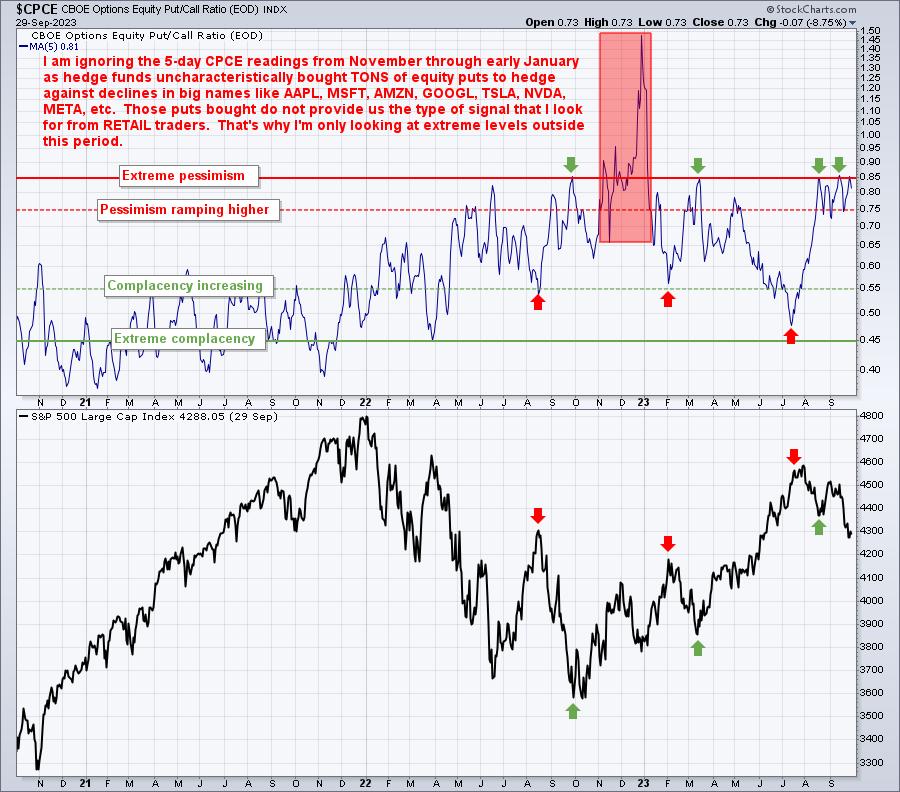
These elevated readings have historically coincided with major market lows. Sentiment remains VERY BULLISH right now.
Trade Setups
I want to continue focusing on stocks that could run higher into year end for various reasons. Thus far, I've pointed out 5 stocks in prior Weekly Market Reports - JPM, BA, FFIV, UPWK, and MA as stocks that I believe will outperform the S&P 500. UPWK was more of a short-term play, but I still like the stock as long as it holds the bottom of its gap support. The other 4 were discussed more as longer-term swing trades. I still like all four, but BA has been bludgeoned, falling right along with airlines stocks ($DJUSAR), despite the fact that it's part of the aerospace group ($DJUSAS). I still favor all 5 of these stocks, though I wouldn't blame anyone for selling BA and waiting for it to climb back above the 190-192 area.
This week, I have another stock to add. It's been a significant underachiever, but that's perhaps all the better from a long-term perspective:
Goldman Sachs (GS):
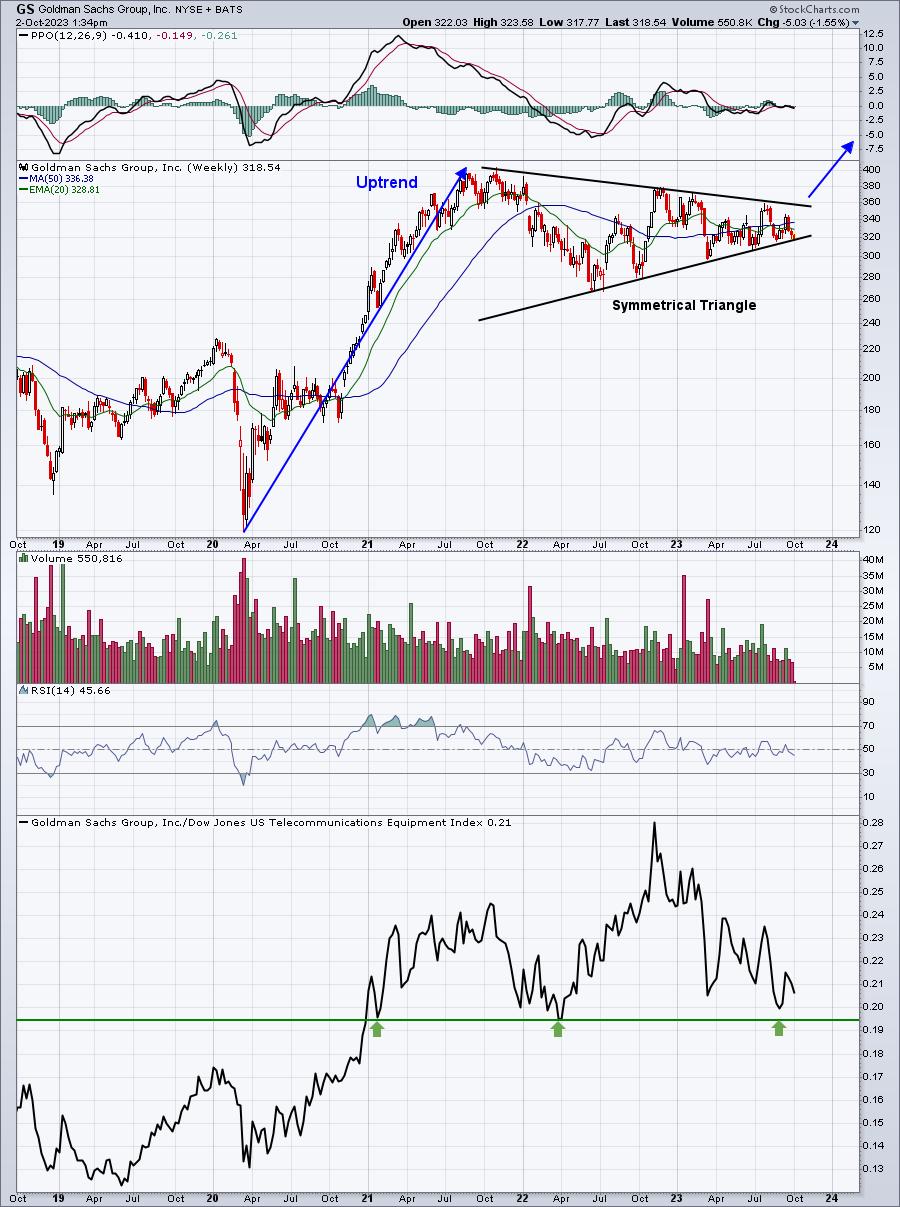
Relative to its investment services ($DJUSSB) peers, GS has been a train wreck in 2023. But key relative support is highlighted with green arrows above and this relative underperformance has coincided with a very bullish continuation pattern, a symmetrical triangle. It's not unusual at all for stocks to underperform while they're in continuation patterns. Keep a close eye on GS. If it can break back above the upper downtrend line in this pattern, let's say around 360, then I believe GS could explode to the upside. In the meantime, be cautious if GS loses recent price support around 210, and especially so if that recent relative support is lost too.
I want to ALWAYS remind everyone that I am NOT a Registered Investment Advisor (RIA) and am not recommending that anyone buy or sell any securities that I mention. EarningsBeats.com, nor any of its employees, are RIAs. Please consult your financial advisor before buying or selling any securities. The above analysis should be construed as education only. You are responsible for any securities that you buy or sell.
Looking Ahead
Upcoming Earnings
We won't see much in the form of market-moving earnings reports this week. Here are a few interesting companies reporting this week, however, by day and market cap:
Monday: None
Tuesday: MKC ($20 billion)
Wednesday: None
Thursday: STZ ($46 billion)
Friday: None
Key Economic Reports
The Fed meeting is out of the way, but there's still plenty for us to consider this week:
Monday: Sept PMI manufacturing (49.8 vs. 48.9), Sept ISM manufacturing (49.0 vs. 47.8)
Tuesday: None
Wednesday: ADP employment, factory orders
Thursday: Initial jobless claims
Friday: Employment report
Historical Data
Each week, I'll provide you the average annualized returns for each calendar day and by index. Here are the historical numbers for this week:
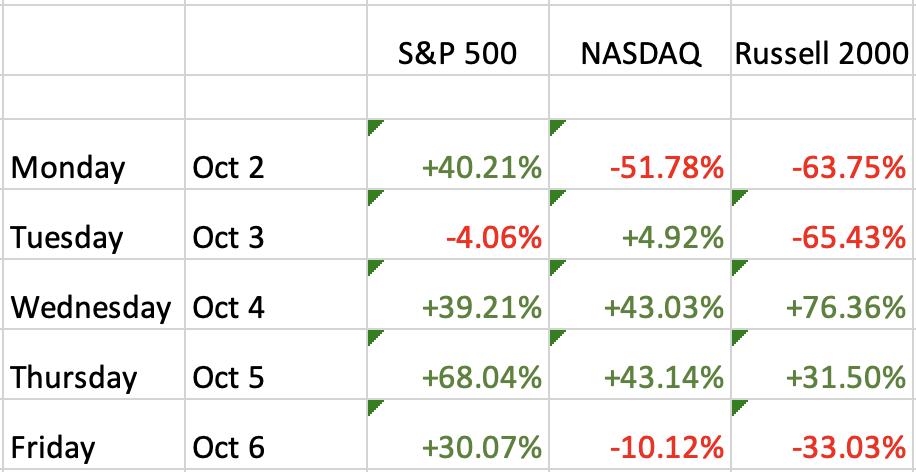
The S&P 500 data dates back to 1950, while the NASDAQ and Russell 2000 information date back to 1971 and 1987, respectively.
History now begins to favor the bulls. I did not notice a lot of earnings warnings and we would usually see most of those by the first trading day in October.
Final Thoughts
Here are my thoughts as we begin October:
- I'm encouraged by the lack of earnings warnings. I would again look for most companies reporting earnings that exceed Wall Street consensus estimates.
- Rotation remains fairly solid and on the side of the bulls. Knowing that, capitulation in early October would be something that I'd remain on the lookout for.
- Jobs will be out on Friday. The goldilocks scenario would include a solid jobs number on Friday that includes little in the way of wage inflation. Average hourly earnings is expected to be +0.3%. An actual reading at that level or lower would be well-received by the bulls.
- We have to continue to monitor interest rates. The TNX touched 4.70% today. The last time we saw the TNX at this level was on October 15, 2007 when the TNX hit 4.71%. At some point, interest rates will dictate significant rotation AWAY from aggressive growth names that have led the stock market higher for over a decade. We haven't seen it yet, but let's not lose sight of what's happening in the bond market.
- 60-minute (hourly) positive divergences are no longer creating tailwinds for the bulls. We had enough strength last week for these 60-minute divergences to play out to their 50-hour SMAs, while hourly PPOs "reset" after testing their centerlines (aka, zero lines).
- The S&P 500 is my favorite benchmark and we lost 4305 price support last week. The absolute very first thing I want to see is the S&P 500 closing back above 4305. We've threatened to do just that on an intraday basis recently, but any intraday strength has not been sustained into the close.
- I am watching what appears to be a false breakout on the semiconductors ($DJUSSC) at their 20-day EMA. If that's the case, we could see the QQQ's recent leadership vanish quickly later this week. Check out the chart:
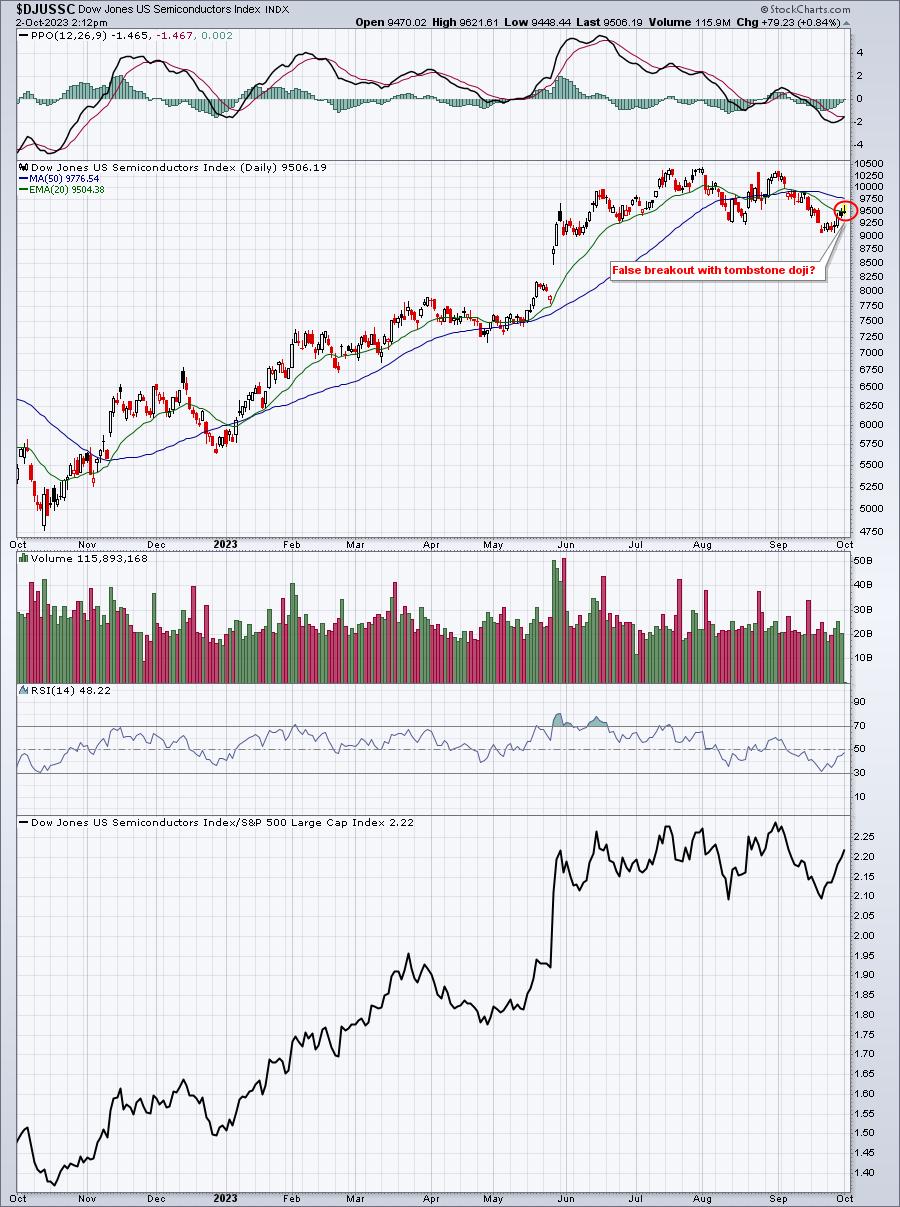
Maybe this candle changes in final two hours today, but right now it doesn't have a very good look.
Feedback
I hope you enjoyed our first month of our EB Weekly Market Report! We'd absolutely love your feedback, whether positive or negative. Let us know what you think by sending us your comments to "[email protected]". We are continuing to work to improve the layout and presentation and encourage you to share your thoughts with respect to this exciting new report!
Thanks and happy trading!
Tom