
EB Weekly Market Report - Monday, October 23, 2023
Q3 Earnings - Sneak Preview
At 4:30pm ET this afternoon, I'll be hosting our "Q3 Earnings - Sneak Preview" webinar, highlighting the best and worst earnings reports out this quarter so far, plus pointing out upcoming earnings reports where I expect blowout earnings or huge disappointments. It's always a fun lesson in using relative strength to our advantage. I hope you can join me.
Room instructions have been sent out separately. If you cannot attend today's live session, the event will be recorded and you may review it at your earliest convenience.
Weekly Market Recap
Major Indices
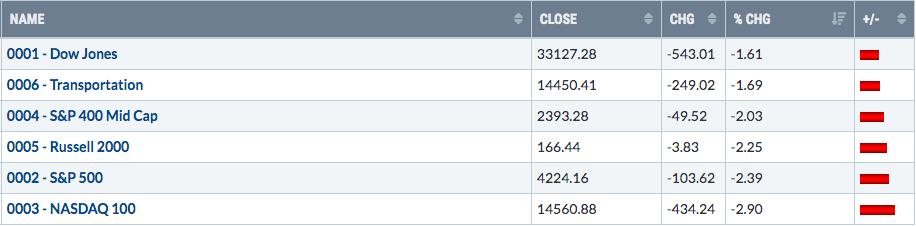
The Dow Jones showed leadership once again last week, though all of our major indices headed south. The Dow Jones was lifted by McDonalds (MCD, +3.95%) and two consumer staples stocks, Coca Cola (KO, +3.18%) and Proctor & Gamble (PG, +2.97%). Unfortunately, 24 of the Dow's 30 component stocks fell, taking the index lower. But here's the good news - nothing really changed technically on the chart. Here's the same chart I provided last week. You can see that both price support and price resistance remains unchanged:
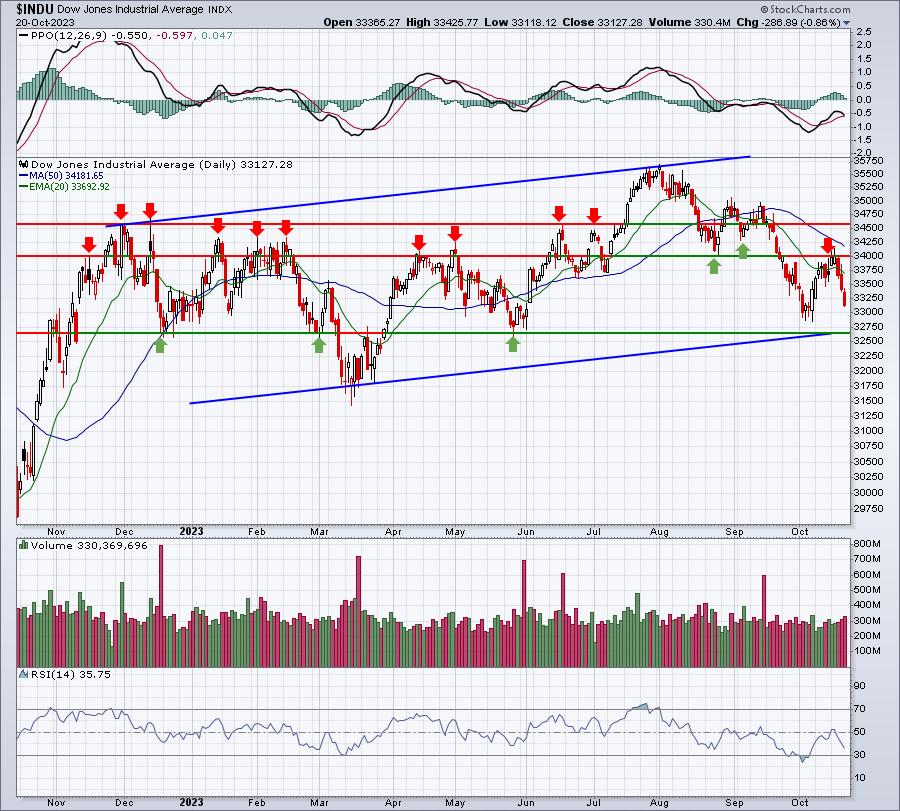
Early in the week, we once again tested 34000 without success. Then we rolled over hard and now appear headed to key support close to 32700.
Sectors
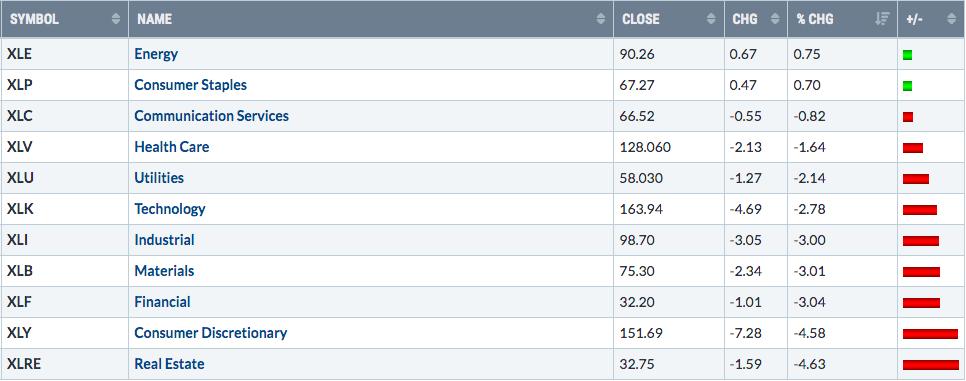
I've mentioned it plenty of times, but industrials (XLI) LOVE the month of November. It's finished November higher than it started 14 of the last 15 years. Check this out:
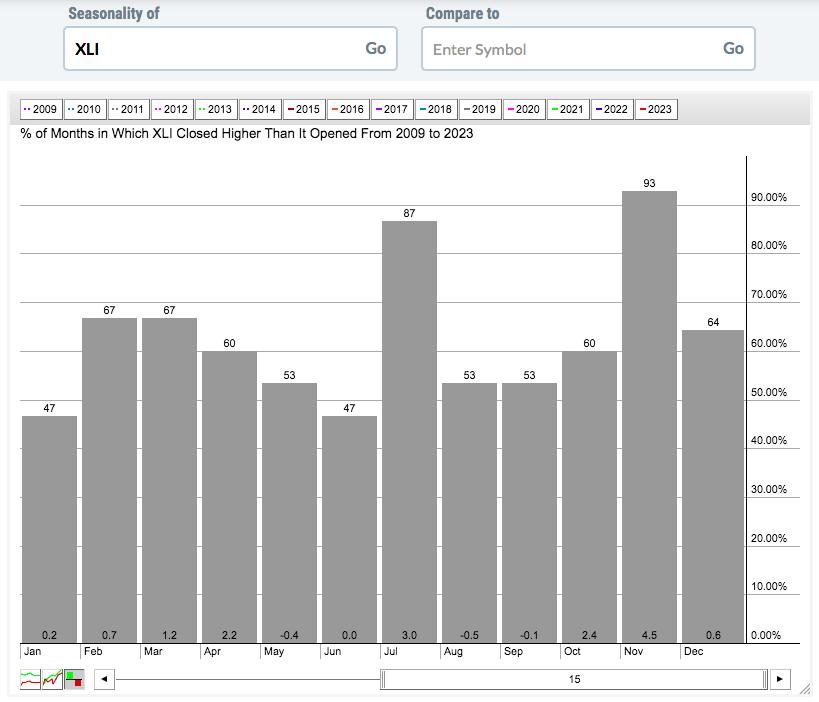 That's powerful history that's difficult to ignore. If bearish historical headwinds this week take the XLI down further and near significant price support, just remember this seasonal chart above. In the meantime, here's the XLI technical picture:
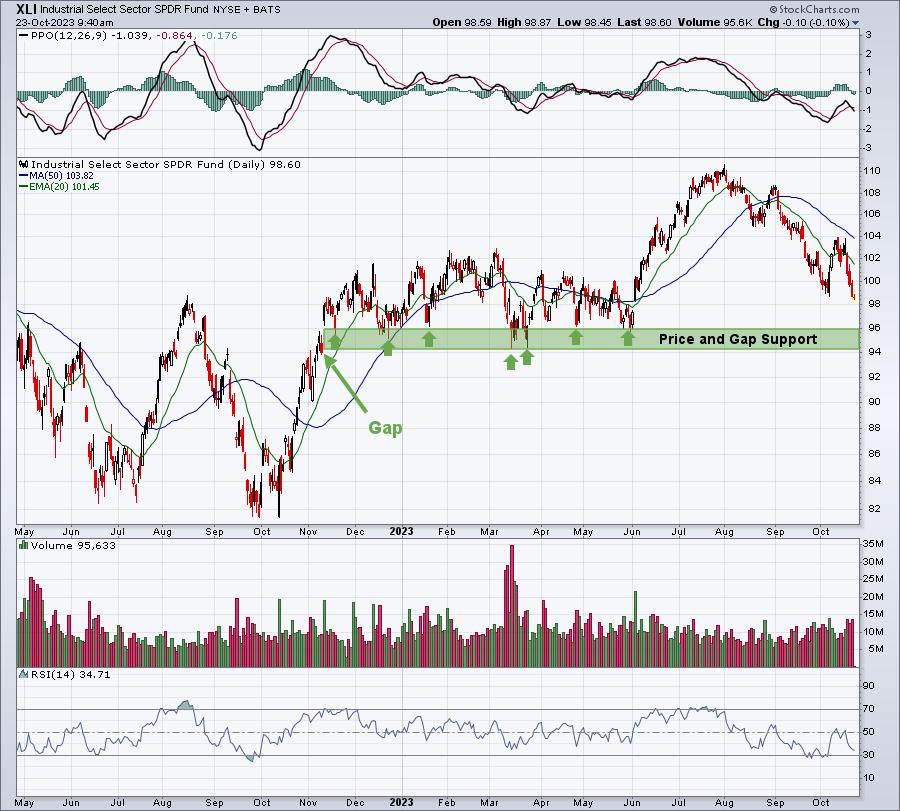
Should the stock market follow historical tendencies, we'll likely see lower prices this week. The closer that the XLI moves toward 94-96 gap and price support, the better the reward to risk would appear to be, especially given the very bullish historical tendencies in November.
Top 10 Industries Last Week
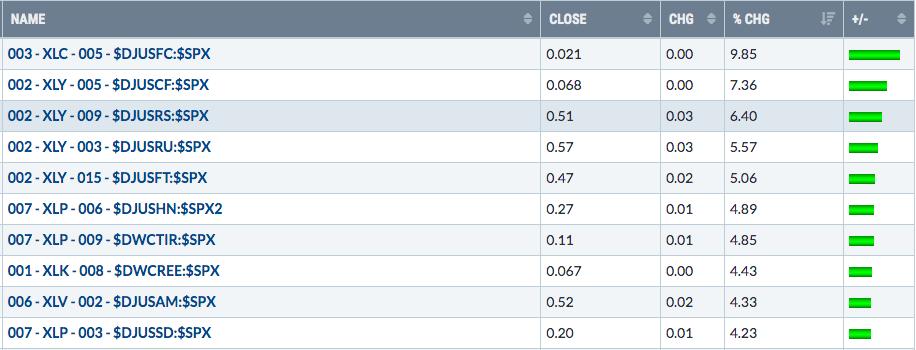
Specialty retail ($DJUSRS) was among the worst-performing industry groups last week, but I liked them due to the positive divergence that had formed. That likely helped last week as the group did advance more than 6% in an overall weak market environment.
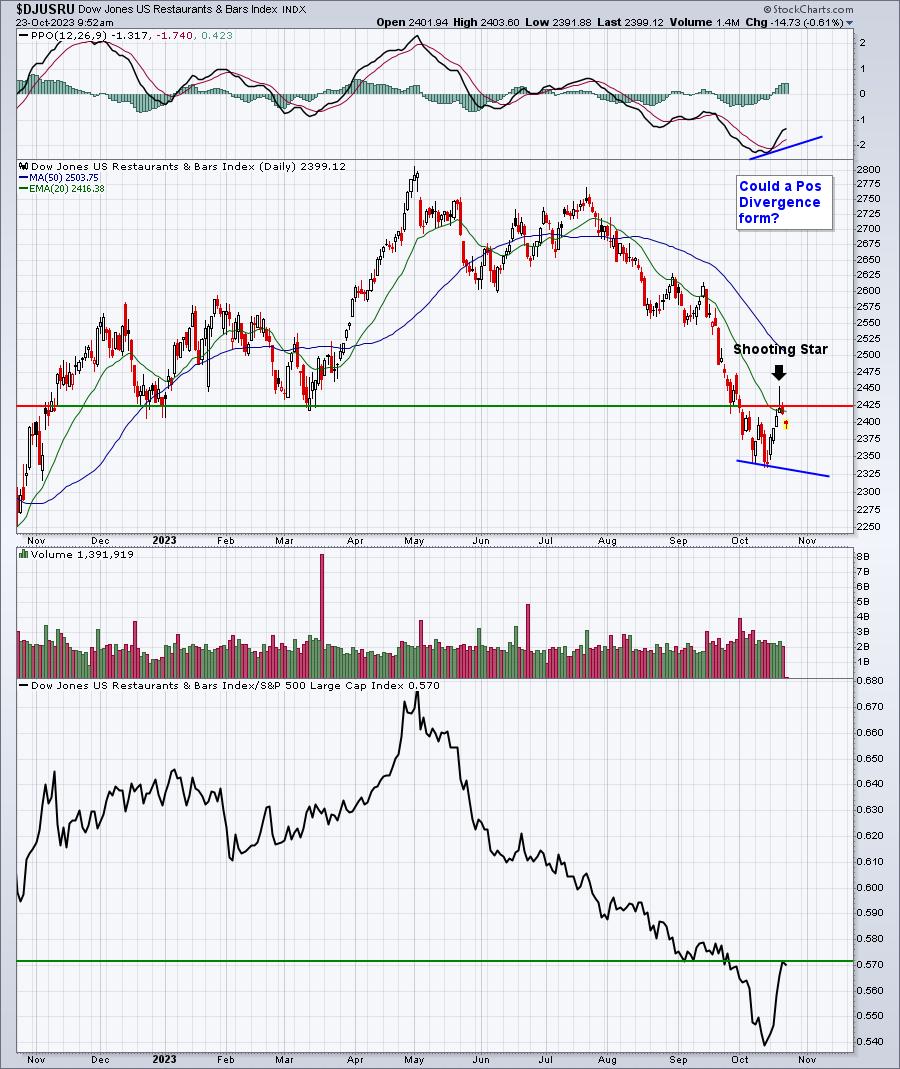
Restaurants & bars ($DJUSRU) had a very nice week, but I'd be concerned after the shooting star candle that printed on Thursday. That looks like a short-term topping candle that could result in news lows ahead. The silver lining, though, could be the emergence of a positive divergence on a new low. Check this out:
Bottom 10 Industries Last Week
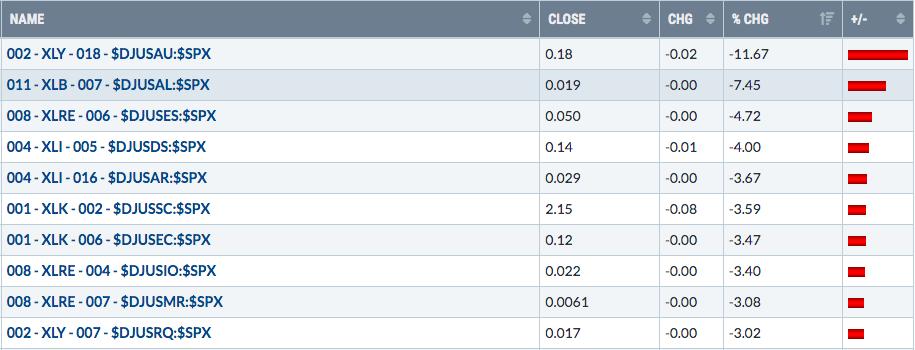
Industrial suppliers ($DJUSDS) had a rough week, but this group is literally sitting on a major support level. Can it hold?
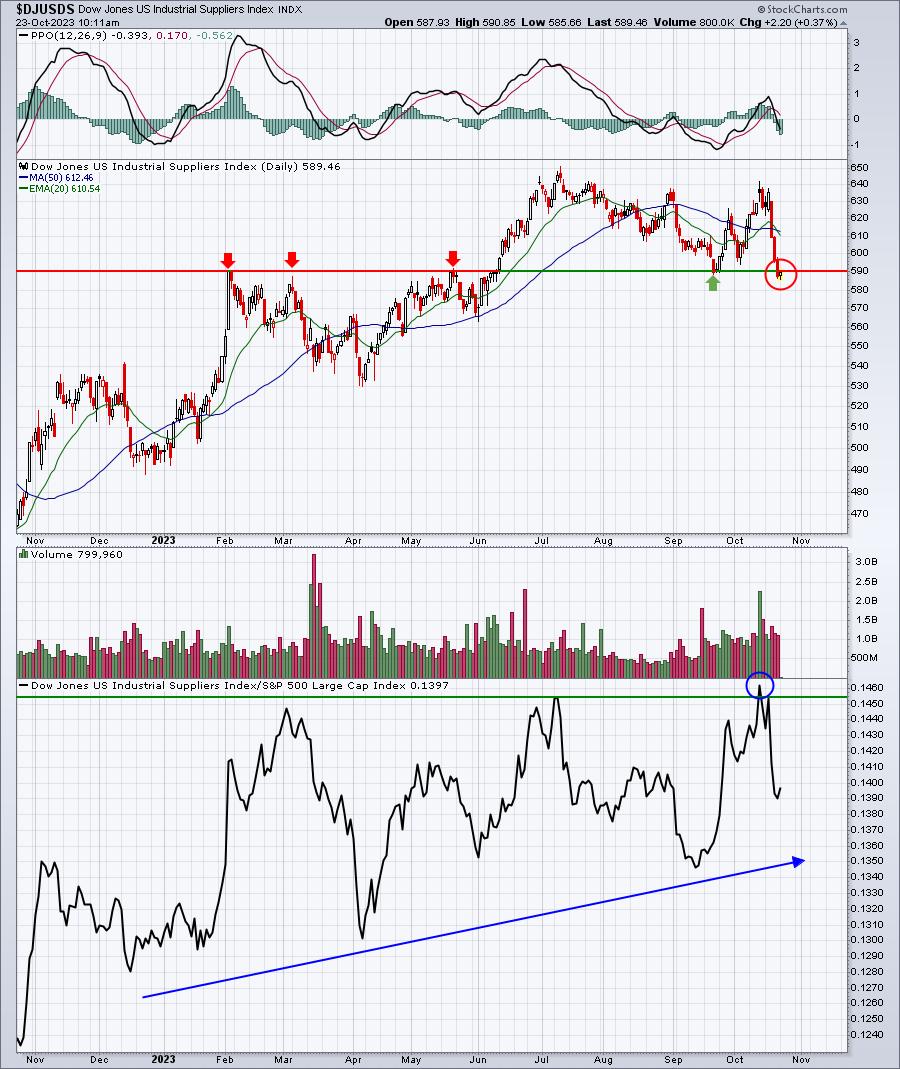
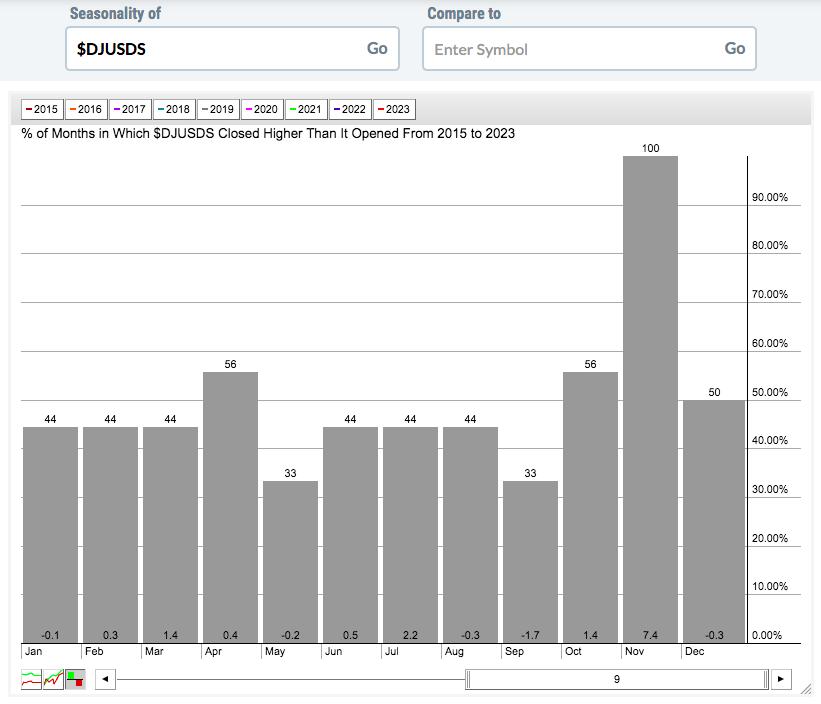
There was a very slight breach of support on Friday's close, but the DJUSDS has been a strong relative performer throughout much of 2023 and just recently set a new 52-week relative high. So I'm willing to give this group a little bit of downside here, but if things begin to escalate, be careful. The following seasonality chart, however, does highlight the 9-year winning streak that the DJUSDS has in the month of November:
Top 10 Stocks - S&P 500/NASDAQ 100
Bottom 10 Stocks - S&P 500/NASDAQ 100
Major Indices
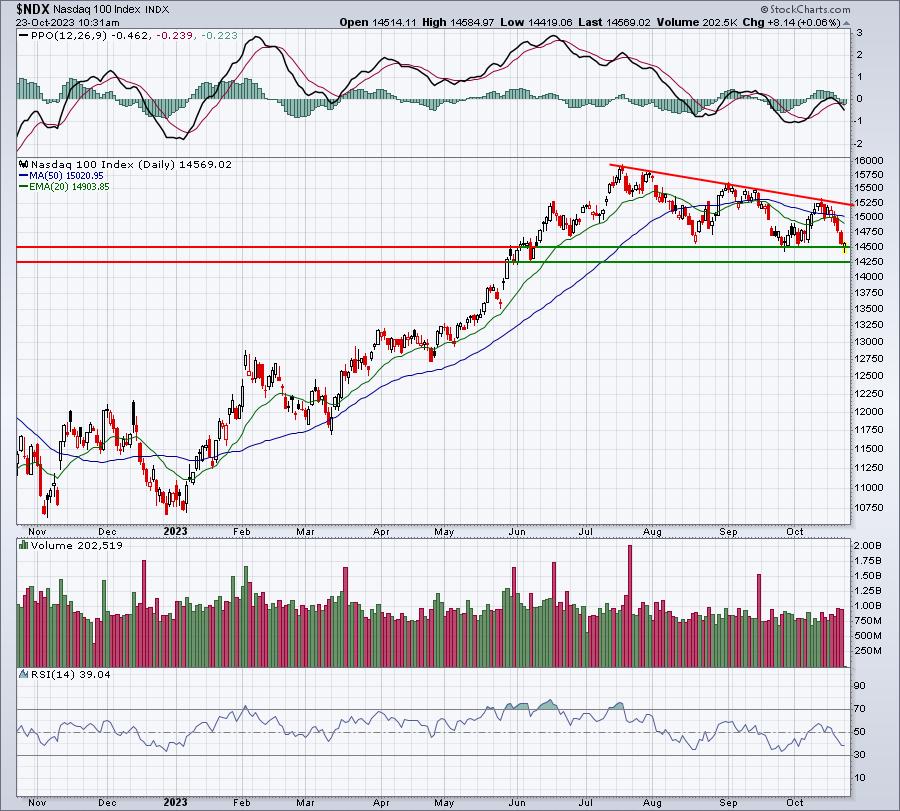
The NASDAQ 100 ($NDX) is now testing the low reached in September. I'd say this is probably the most important chart to watch, because the FAANG stocks have such a large role in the direction of this chart and many of them will begin reporting quarterly results this week. A very difficult end to last week's action sent the NDX down to test support:
The S&P 500 has been weaker on a relative basis and closed on Friday (4224) beneath the prior closing low (4229). As the Volatility Index ($VIX) rises into the 20s, we must be careful with that loss of price support. This morning, we're trying to rally back off of early morning weakness, but it's very early in the day. Things could change drastically by 4pm ET, given that higher VIX level. Here's a current look at the S&P 500:
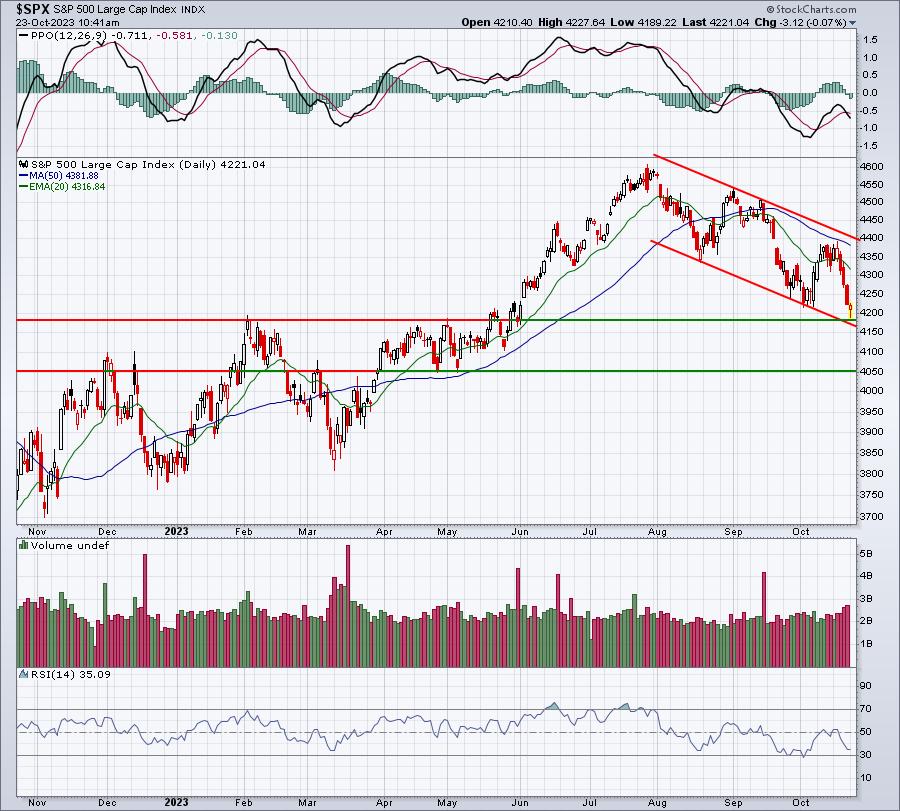
There's a more clearly defined channel on the $SPX for sure. We did move sub-4200 and have bounced thus far, but a further drop and a higher VIX would be far more convincing of a potential bottom - perhaps we see it later this week?
I wrote an article at StockCharts.com in my Trading Places blog yesterday that discussed what a VIX above 20 can mean for stocks. If you didn't get a chance to read it, I'd highly recommend it whenever you have the time. You can CLICK HERE for the article.
Bull Market vs. Bear Market
That's the big debate, right? I wish we knew for sure, but unfortunately there are no guarantees with the stock market. Don't let anyone try to convince you otherwise. I do believe, however, that we can improve our chances of getting the market direction right by listening to the charts instead of the media.
I love technical analysis and have studied it for decades. But I'll be perfectly honest. Most technical indicators are lagging signals. That's why most technicians react to price action, rather than predict it. Prices move lower and most technicians agree we're trending lower. Then when prices move up for awhile, everything is better and an uptrend is intact. I've always studied technical analysis with the belief that technical analysis can provide us more than the Monday Morning Quarterback. The market tells us a story and it's not necessarily based on what we're seeing on the S&P 500 chart. Many times you'll see me predict market bottoms when things look bleak and issue cautious comments during or at the end of secular bull market advances. These predictions, before the moves are made, are critical to outperforming the S&P 500 over a long period of time. The signals I use help me to assess risk, not predict the future. There is always risk in the stock market, whether you're buying stocks, selling stocks short, trading individual stocks or ETFs. But there are signals and strategies to help us manage risk and I believe that's where our strength lies at EarningsBeats.com and what sets us apart from other pure technical analysts.
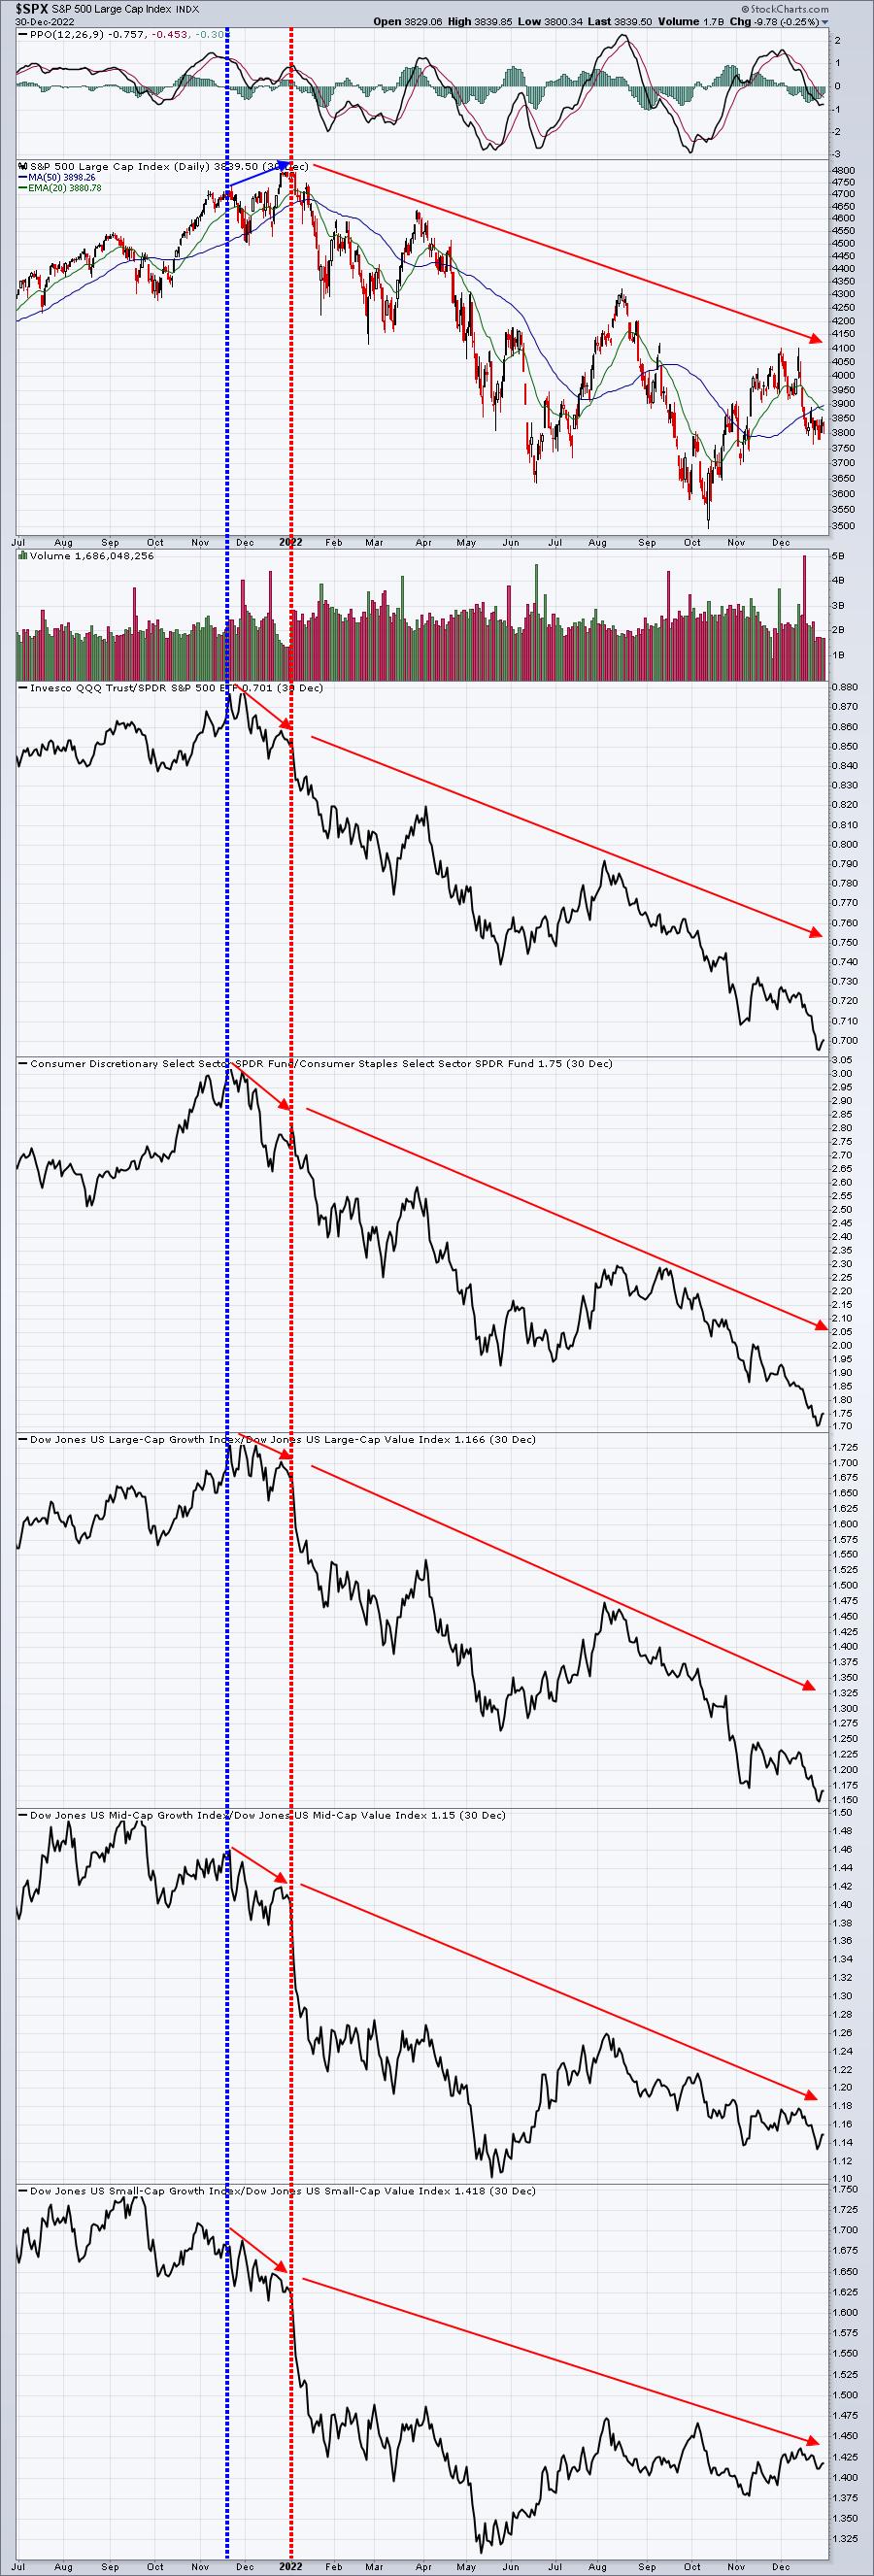
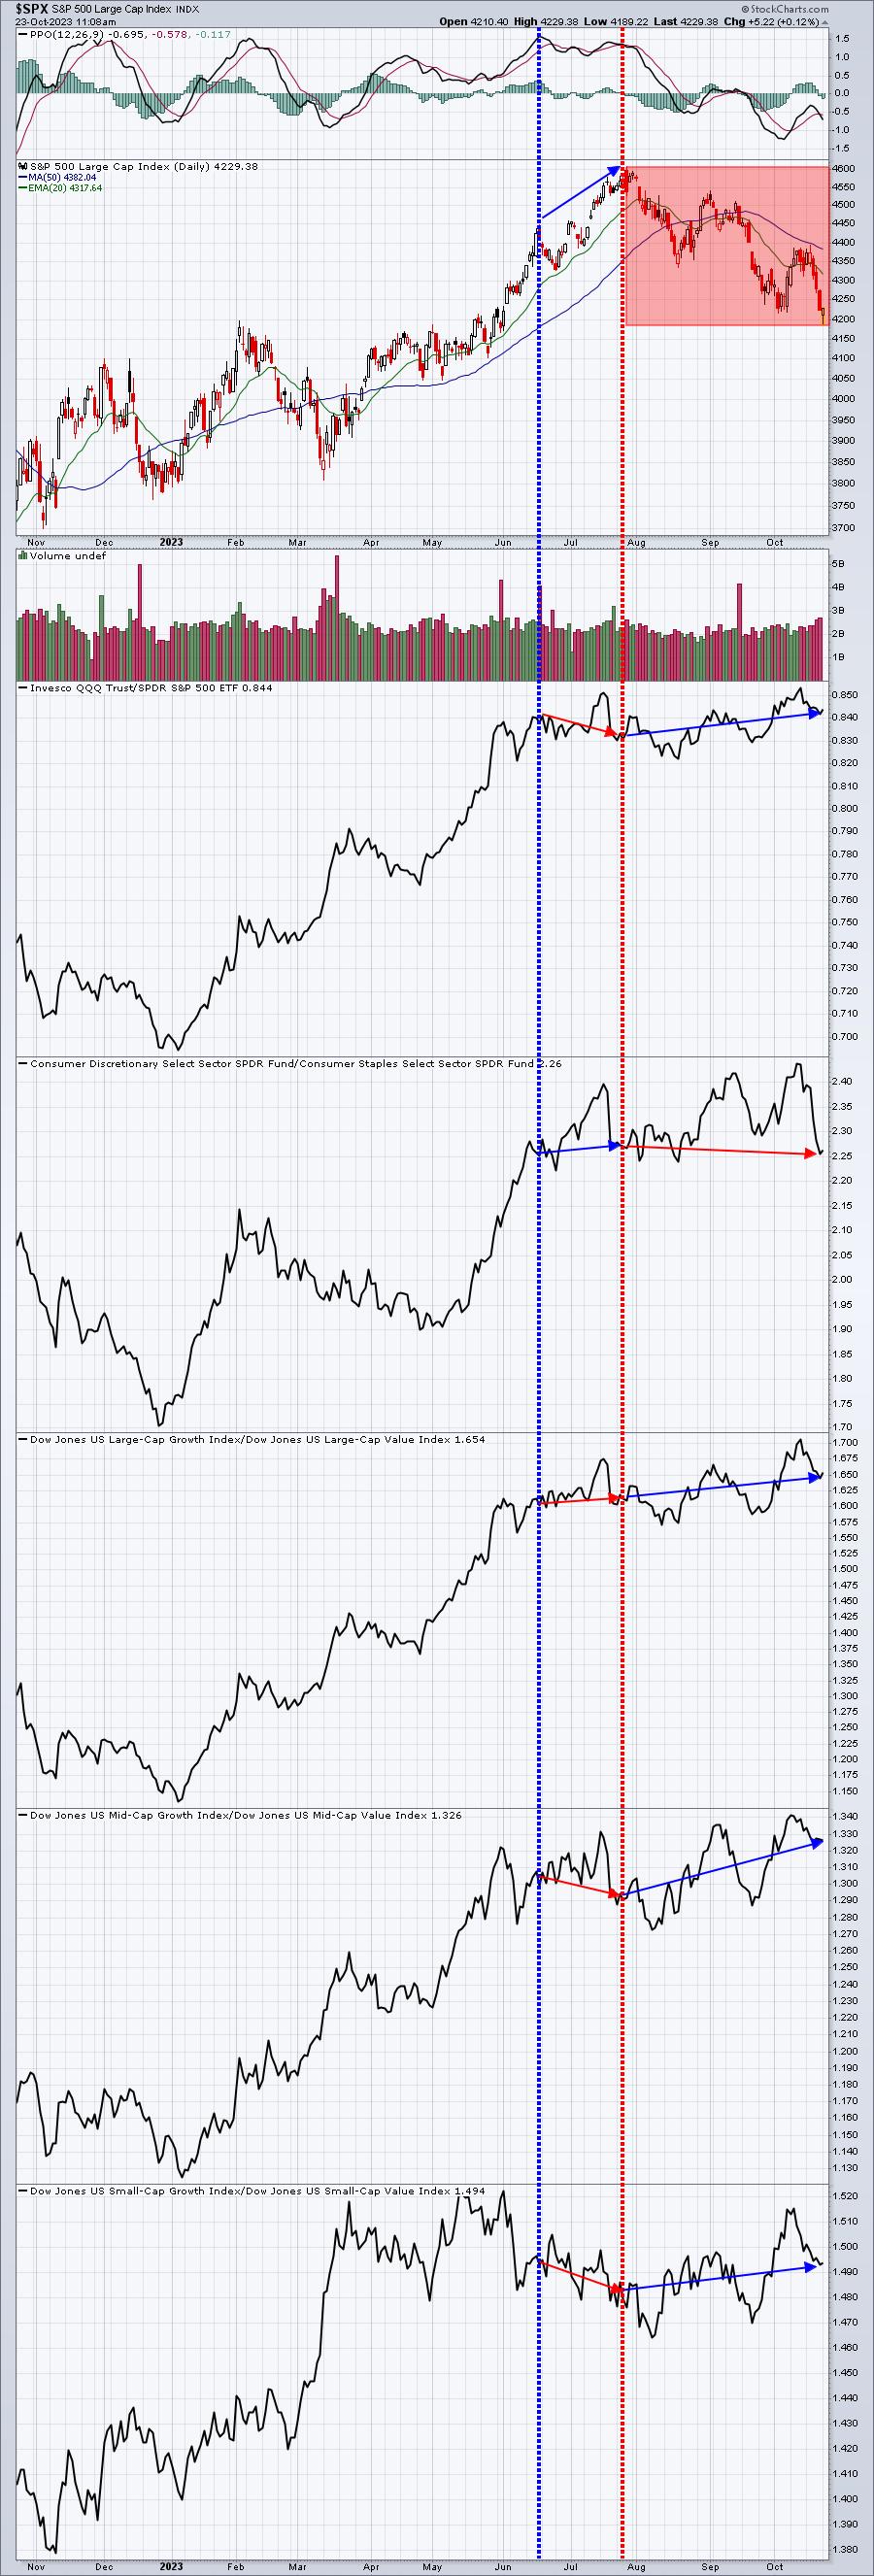
I want you to look at these two S&P 500 charts and see if you notice the difference(s):
S&P 500 before and during 2022 cyclical bear market:
S&P 500 currently:
Wall Street prepped for the 2022 cyclical bear market. During that final December 2021 rally, money rotated heavily away from all of my key growth vs. value ratios. That rotation occurred while the stock market was going UP! That rotation to value as the stock market rose was one big reason why I felt we were setting up for the POTENTIAL of a cyclical bear market. I didn't guarantee a bear market, I simply indicated the risks of a cyclical bear market were rising. The technical price action confirmed it rather than calling it. By late January or early February, some folks were beginning to see the technical damage. Then March, April, and May had EVERYONE calling for a bear market. Unfortunately, much of the damage had been done.
Compare that period to what we've seen over the past 3 months. The final high in July did not coincide with a mass exodus out of growth stocks. And the subsequent heavy selling in August and September actually saw growth stocks outperform! Listen, I don't make this stuff up. It's on the charts. For me, bear markets have to pass the "smell test". Recessions cause earnings to plummet and most growth stock valuations are based on growth. Their balance sheets do not support the valuations they have. It's all about earnings, earnings growth, and future earnings growth. I'm sorry, but I'm not buying into all the despair and horrific news that the media is selling.
I believe a bottom is at hand or is rapidly approaching.
Sentiment
Sentiment also played a key role in my assessment that being long heading into 2022 wasn't worth the risk. There was record bullishness in equity options that can be very problematic as it's an indication that everyone who wants to buy has already bought. When you run out of buyers, rotation is bearish, and key support levels are lost as the VIX spikes above 20, conditions are ripe for a lot more weakness. That's what we saw in 2022. Currently, I see a much different picture. Rotation is bullish and the equity only put call ratio ($CPCE) has remained elevated for weeks, suggesting that retail traders believe this market can only go in one direction - DOWN. That's typically when I want to be long.
Here's my adjusted CPCE (eliminating professional hedging) using a User-Defined Index at StockCharts:
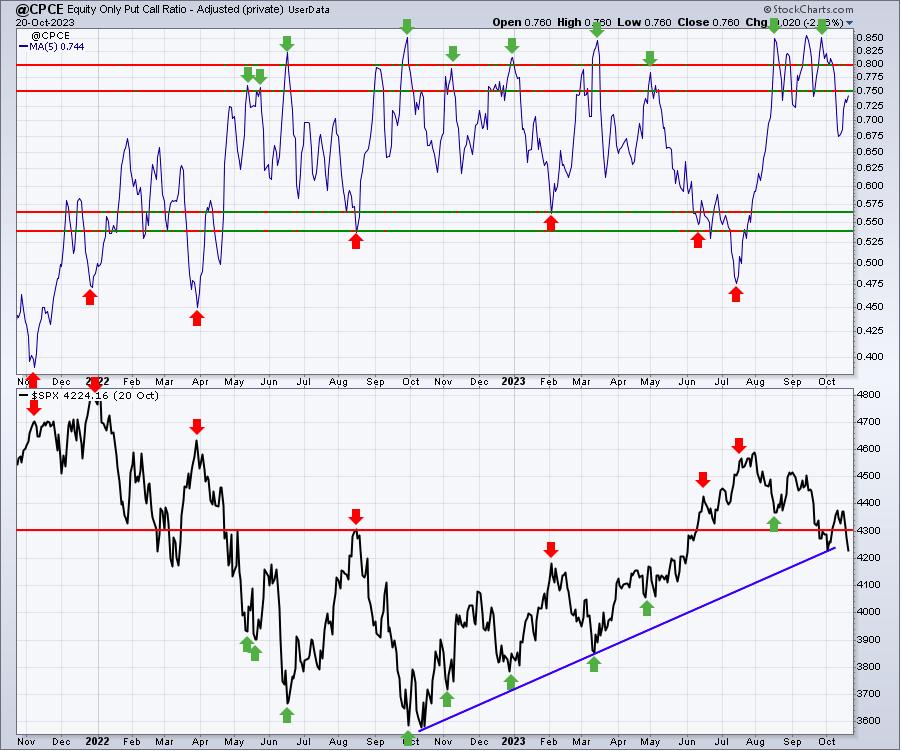
The 5-day readings of the CPCE above .75 typically mark bottoms in the S&P 500, though many of them can be short-term bottoms.
The Dollar
Over the years, I've developed what I think is the best barometer for the U.S. Dollar Index ($USD). The dollar should strengthen when our economy strengthens relative to foreign economies. Or we could see the dollar strengthen when our economy is expected to be stronger than foreign economies. In comparing economies or expectations, stock markets are one of the best leading indicators. So I began searching for the one foreign stock market that seemed to be positively correlated to the S&P 500. The best I found was the German DAX ($DAX). Check out the near-perfect positive correlation between these two stock markets over the years:
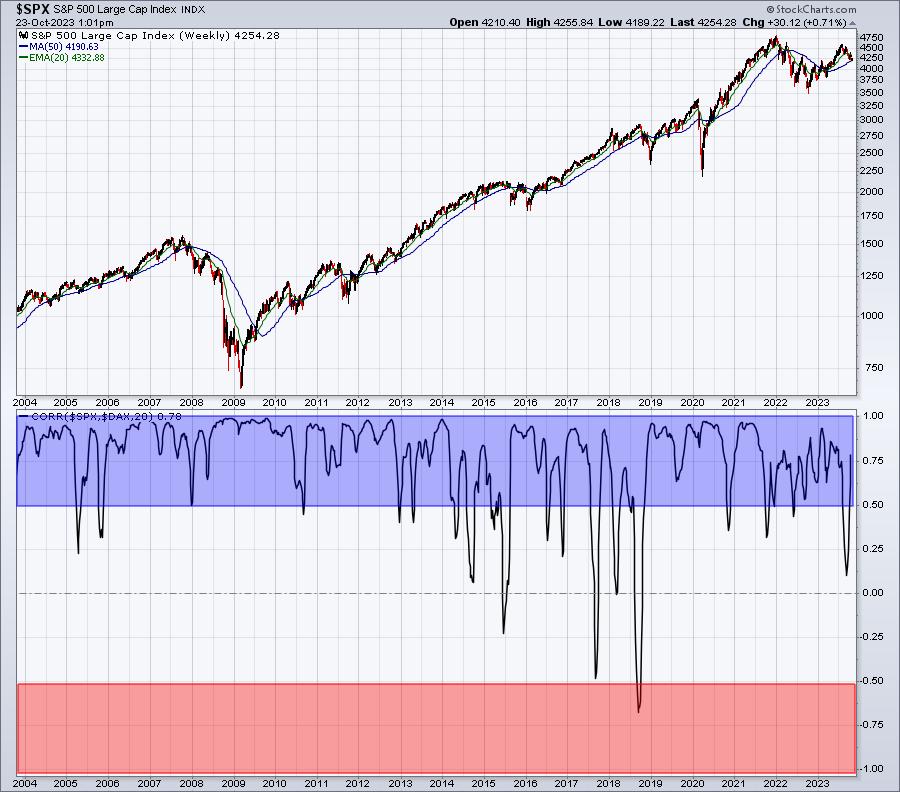
The blue-shaded area highlights when the SPX and DAX move in similar fashion. This is a 20-year weekly chart and shows a fairly solid positive correlation throughout bull and bear markets alike.
I then took it one step further to compare the yields on the two countries' 10-year bonds. Yields typically rise on economic strength. So I figured that comparing the US 10-year yield to Germany's ($UST10Y-$DET10Y) would provide us a nice clue as to which way the dollar would likely go. Check this out:
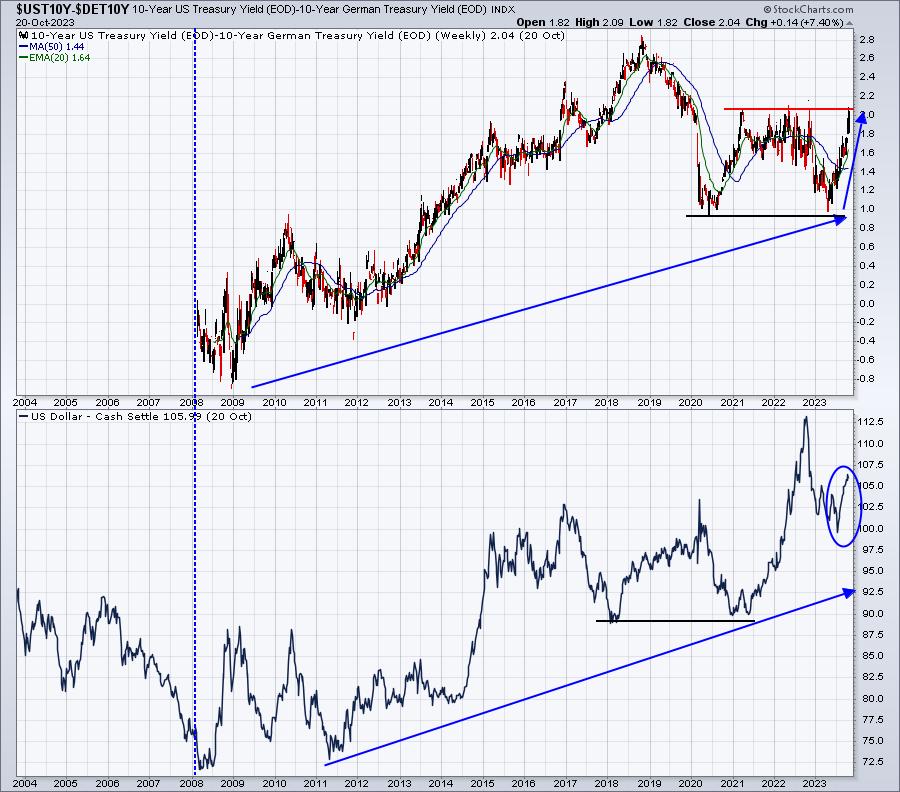
I know many analysts are expecting the U.S. economy to weaken, but this chart doesn't really support that notion at all. We're seeing a very strong rally in the dollar in this 2nd half of 2023. Key "net" yield resistance currently sits between 2.00 and 2.10. If that level breaks, I believe it bodes for a very bullish dollar to close out the year. Again, this tells me our economy is likely to strengthen, supporting the rotation to growth that I discussed earlier.
Trade Setups
I'm going to add one very familiar name to the list of stocks that I like in the long-term. Apple, Inc. (AAPL) was down roughly 15% from its July high earlier this morning when it broke just below 170. I realize there's downside potential here, especially if this historically-weak period kicks in. But we're talking about prospects over the long-term and I really like AAPL. The 170-180 area was resistance on the way up, and now I expect that it's holding as support during this correction:
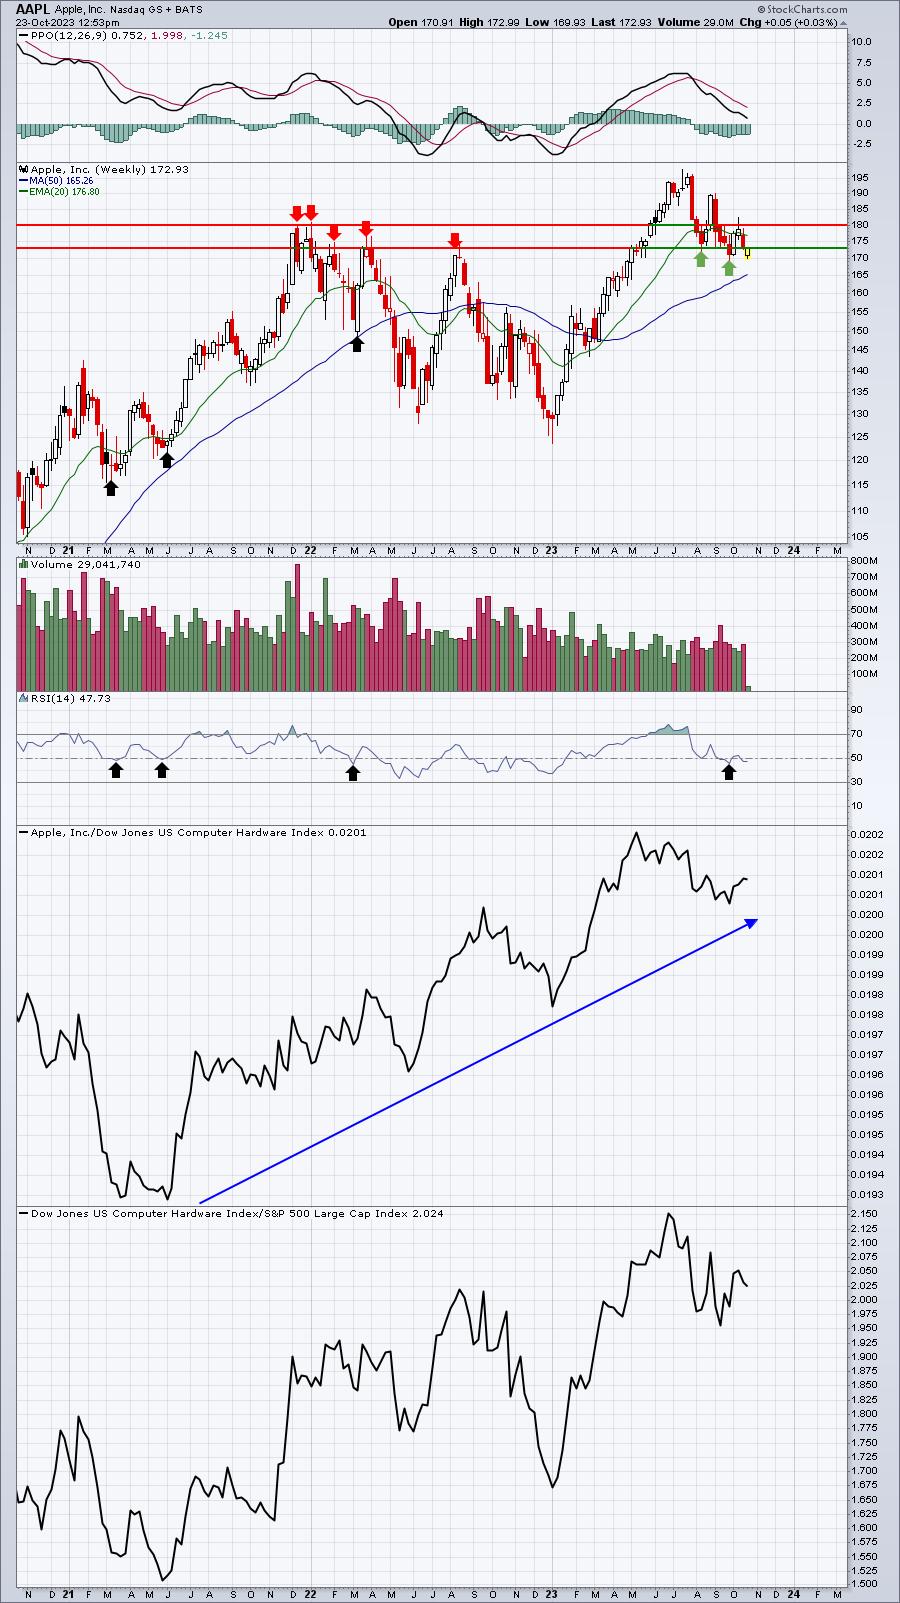
AAPL remains very strong relative to its computer hardware ($DJUSCR) peers. Also, if this is nothing more than a secular bull market correction, we've seen these in the past result in AAPL seeing its RSI dip just below 50. Those have been tremendous buying opportunities. So while I think it's possible that AAPL falls a bit further, I also believe the risk vs. reward favors long entry here - all in my opinion, of course.
I want to ALWAYS remind everyone that I am NOT a Registered Investment Advisor (RIA) and am not recommending that anyone buy or sell any securities that I mention. EarningsBeats.com, nor any of its employees, are RIAs. Please consult your financial advisor before buying or selling any securities. The above analysis is for educational purposes only. You are fully responsible for any securities that you buy or sell.
Looking Ahead
Upcoming Earnings
Earnings season began last week and we'll see the number of earnings reports increase consistently over the next few weeks. Here are the biggest earnings reports (in my opinion) by day and with market cap in parenthesis (this list is not meant to provide ALL the companies reporting earnings this week, just a few that I'll be watching closely):
Monday: CDNS ($67 billion)
Tuesday: MSFT ($2.46 trillion), GOOGL ($1.75 trillion), V ($435 billion)
Wednesday: META ($805 billion), NOW ($114 billion), BA ($110 billion)
Thursday: AMZN ($1.32 trillion), MA ($365 billion), INTC ($149 billion)
Friday: XOM ($452 billion), CVX ($316 billion)
Key Economic Reports
Economic reports will be light to start the week, but the latter part of the week is loaded. I'm particularly interested to see that 1st GDP estimate of Q3. There is a very wide range of estimates (2.8% to 6.0%). Here's the list of all key reports:
Monday: None
Tuesday: None
Wednesday: New home sales
Thursday: Durable goods, GDP, initial jobless claims, pending home sales
Friday: Personal income and spending, consumer sentiment
Historical Data
Each week, I'll provide you the average annualized returns for each calendar day and by index. Here are the historical numbers for this week (We will be providing more visual images of seasonality in future reports, but for now I'm trying to avoid some of the scrolling issues that Excel images were causing):
S&P 500
- October 23: -5.14%
- October 24: -32.64%
- October 25: -36.65%
- October 26: -56.01%
- October 27: -24.27%
NASDAQ
- October 23: -46.02%
- October 24: -64.64%
- October 25: -25.00%
- October 26: -106.39%
- October 27: -78.14%
Russell 2000
- October 23: -33.75%
- October 24: -73.45%
- October 25: +22.94%
- October 26: -17.64%
- October 27: -125.67%
The S&P 500 data dates back to 1950, while the NASDAQ and Russell 2000 information date back to 1971 and 1987, respectively.
This week has had very bearish tendencies. If we can get through this week with minimal technical damage, the seasonal picture changes dramatically starting next week. The close on October 27th through the close on January 18th is THE ABSOLUTE BEST TIME OF THE YEAR FOR U.S. EQUITIES - HISTORICALLY SPEAKING.
Final Thoughts
Earnings season is accelerating and there are several things on my mind this week:
- Earnings obviously. Several really notable names will be reporting quarterly results this week, including MSFT, GOOGL, META, AMZN, and INTC, among others. These have tremendous influence on the direction of the S&P 500 and NASDAQ, so I'll be watching Wall Street's earnings reactions closely.
- The 10-year treasury yield ($TNX). Earlier today it hit 5.00% and that's a level that could spook a number of traders this Halloween season. I'm still okay with where it is, but the further it moves above 5.00%, the worse it is for stocks. We could be printing a bearish engulfing candle today, however, which could send the TNX much lower in the near-term. Therefore, we want to keep the bond market and corresponding yields in close view as well.
- Volatility ($VIX). I wrote an article on Sunday in my Trading Places blog at StockCharts.com, analyzing the impact of the VIX on stock prices, especially when the VIX moves above 20. This is a dangerous week, but I'm fully expecting a major low to print soon.
- Capitulation. Any time fear builds, I begin searching for a capitulatory bottom. Was the gap down this morning and subsequent buying what we needed? Possibly, but remember the day isn't over yet. A lot can change in the next two hours.
- Many banks will continue to report earnings over the next couple weeks. The large banks have performed better than the small and mid-size banks in 2023, but will that change? How bad will it be for smaller banks? Has all the bad news been built into current price?
- Q3 GDP. Nirvana is when the economy is strengthening and inflation is weakening. If GDP comes out stronger and we continue to see inflation spiraling lower, I believe we will soon see a BIG pop to the upside in stock prices. Of course, that's a BIG "if" that bears watching.
- Discretionary vs. staples (XLY:XLP). This is my favorite intermarket relationship to follow and it's currently trying to rebound off major multi-month support after breaching it temporarily this morning:
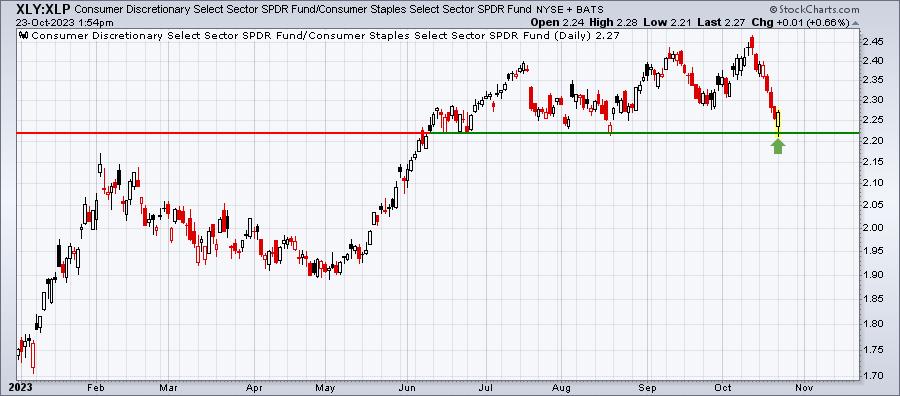
Losing this support level would certainly add some bearish vibes in the short-term. If it holds here, however, perhaps the worst is behind us.
Feedback
If you'd like to share your thoughts on our Weekly Market Report, positive or negative, you can reach us at "[email protected]".
Happy trading!
Tom