
EB Weekly Market Report - Monday, November 6, 2023
Weekly Market Recap
Major Indices
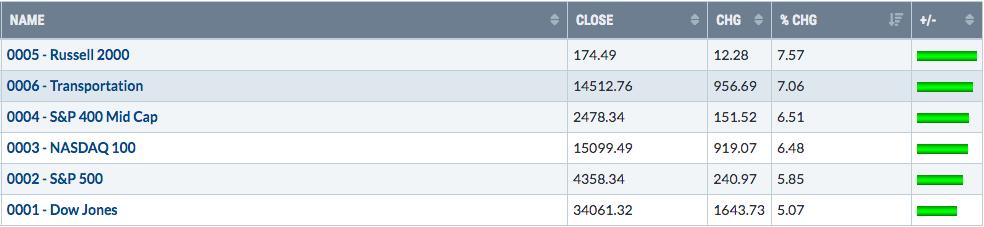
Last week was our best week of the year and it coincided with the most bullish week of the year historically. All of our major indices posted weekly returns that wouldn't be considered a bad year. Not only did it stop the correction and the bears in their tracks, but the rebound cleared key price and moving average hurdles in the process. The Russell 2000 (IWM) had been beaten up rather badly during the correction, dropping far more than the S&P 500 and NASDAQ 100, so let's look at the chart to see where this small cap index now stands:
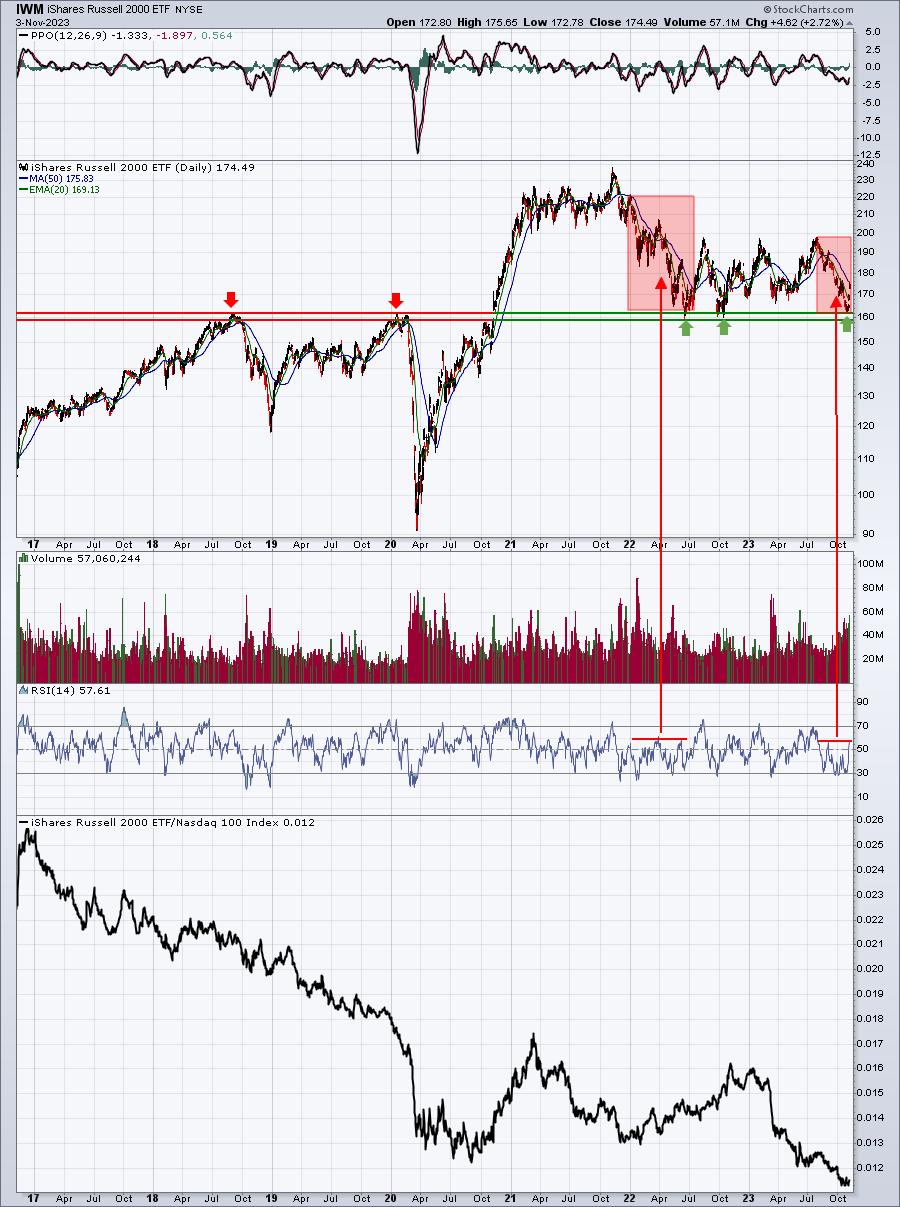
It was nice to see such strength in small cap shares, but we've seen bounces before. The real key is.....is this rally sustainable? Strictly from looking at price action, last week's move up to clear its 20-day EMA and test its 50-day SMA is a nice start. But one technical clue to watch will be what happens to RSI. I've highlighted with red-shaded areas what's happened to the IWM in the past when RSI fails to clear 60. The downtrend lives on. But when we begin to see RSI top out at 70 or higher, it's a solid indication that an uptrend is in place. So I'll be watching any further strength to see if RSI can clear 60 with conviction.
Also, last week's rebound was very timely from a longer-term perspective as it's quite easy to see how important 160 price support is. The IWM reached just below 162, but buyers stepped in big time. That was critical to the future performance of the IWM. One problem does still remain, however. Check out that bottom relative strength panel. While IWM is beginning to look much better on an absolute basis, there's still plenty of work left on a relative strength basis. The IWM barely budged to the upside relative to the NASDAQ 100 ($NDX), which suggests to me that the QQQ remains the better bet vs. the IWM - at least for now.
Personally, I'm maintaining my investments in both the QQQ and IWM, because I do know that November and December have historically been the best months for IWM relative performance. Check out this seasonality chart:
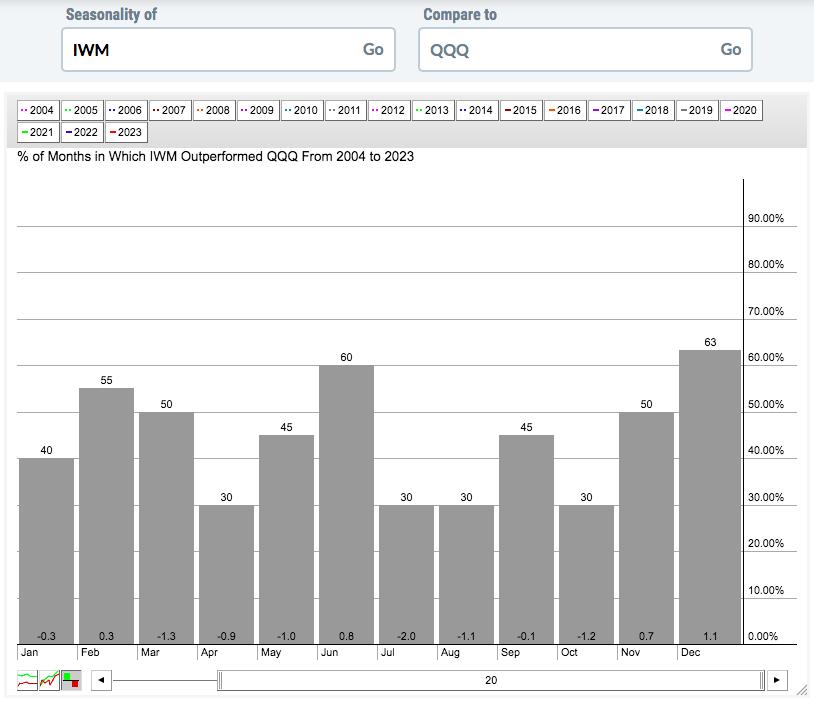
Over the past 20 years, the IWM has outperformed the QQQ by an average of 1.8% (0.7% + 1.1%). It's down in 8 of the other 10 months. If the small caps are going to shine, this could be the time. Perhaps last week's relative strength is just the start. We'll soon find out.
Sectors
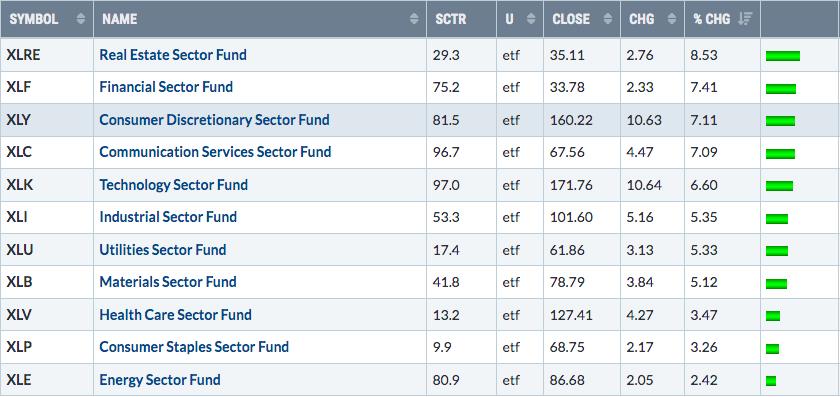
The beaten-down real estate sector (XLRE) saw a major rebound from very oversold territory and it was technically impressive to boot:
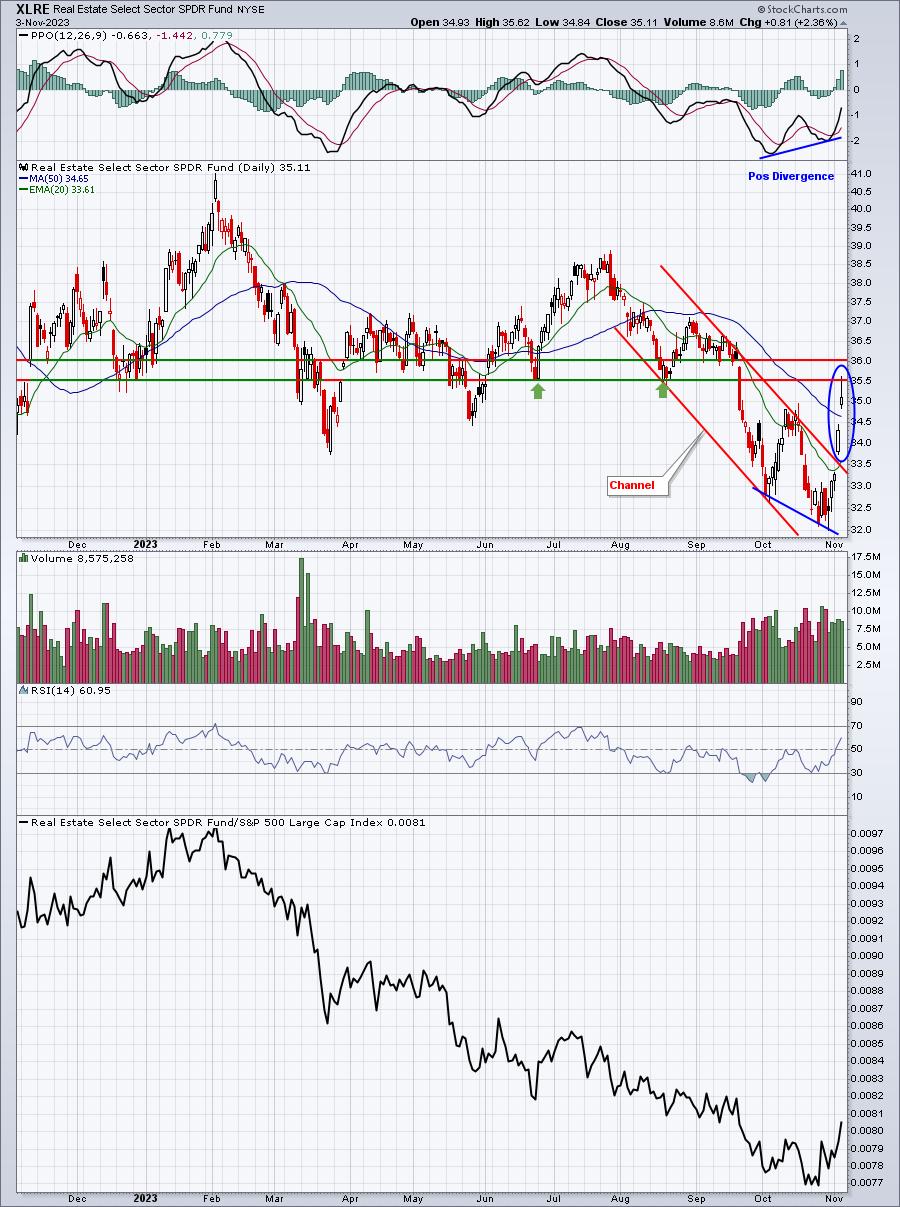
There's a lot going on on this chart, but one key takeaway is that the XLRE had slowing downside momentum, evidenced by the positive divergence at the low. It was ready to bounce and it did. From here, the fight becomes more difficult, because XLRE's RSI is now just above 60, a key level. Also, I see a double bottom at 35.50 and gap resistance just above 36.00. The XLRE rally stopped at 35.62 on Friday. Gains this week could be much harder to come by.
As I look at the overall sector behavior last week, though, one thing definitely stood out and keeps me very bullish. Look at sectors 2 through 6 on this list. They are the 5 aggressive sectors. So not only did aggressive sectors hold up relatively well during the correction, but they've now also shown leadership on last week's huge rally. This reeks of a stock market that's likely to push higher during the balance of Q4. And that's exactly what I've been discussing throughout the correction - have patience and await a HUGE Q4. It's underway.
Top 10 Industries Last Week
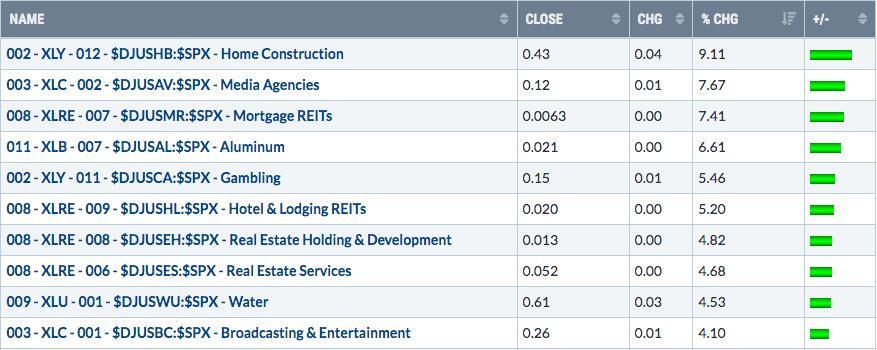
We saw a big drop in the 10-year treasury yield ($TNX) last week and that was seen as a big tailwind for home construction ($DJUSHB), last week's best-performing industry group.
As I looked at these 10 industry groups, I have to admit I'm a bit intrigued by the broadcasting & entertainment area ($DJUSBC). This group has continued pushing lower and lower on an absolute basis, but notice that it's relative support from July has held:
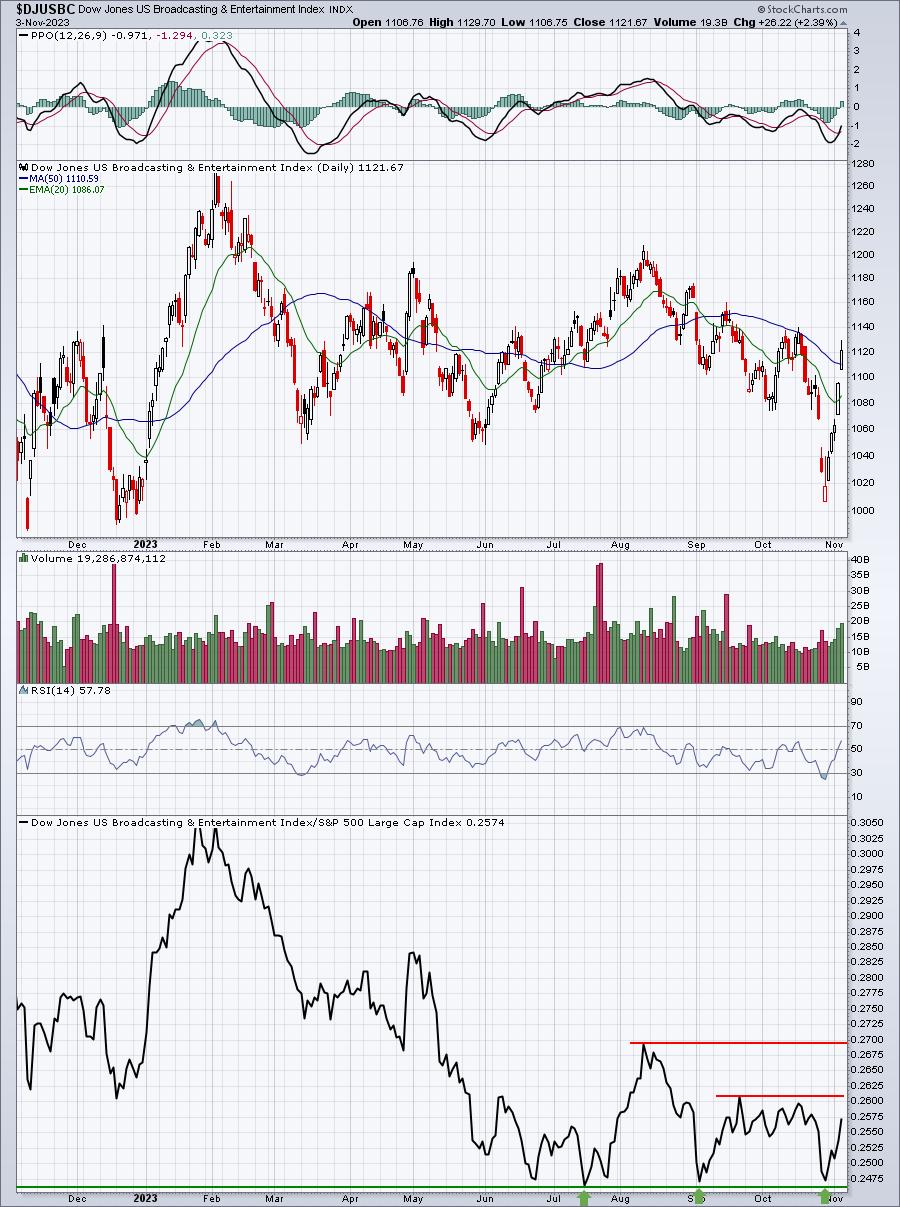
A stock like Walt Disney (DIS) should at least be monitored for positive technical developments, especially if we see breakouts on the above relative strength panel. The RSI on the DJUSBC is approaching 60 and we know that's an important technical level to watch as well. If we do see some profit taking after last week's surge, is the selling contained? Do we continue to close above the now-rising 20-day EMA. That will answer our question as to whether we can trust the current strength.
Bottom 10 Industries Last Week
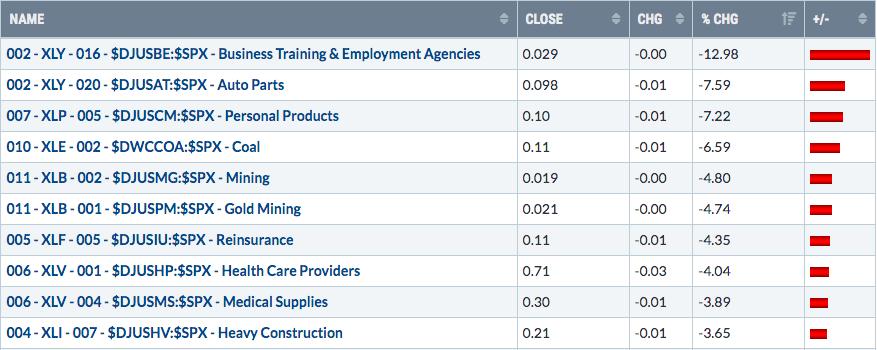
Here I want to focus on gold miners ($DJUSPM). Many investors look at the absolute uptrend in gold ($GOLD) and think it's a great investment. Unfortunately, if you're trying to beat the benchmark S&P 500, it's proven to be a not-so-good investment. In fact, it's been horrible over the years as the following chart illustrates:
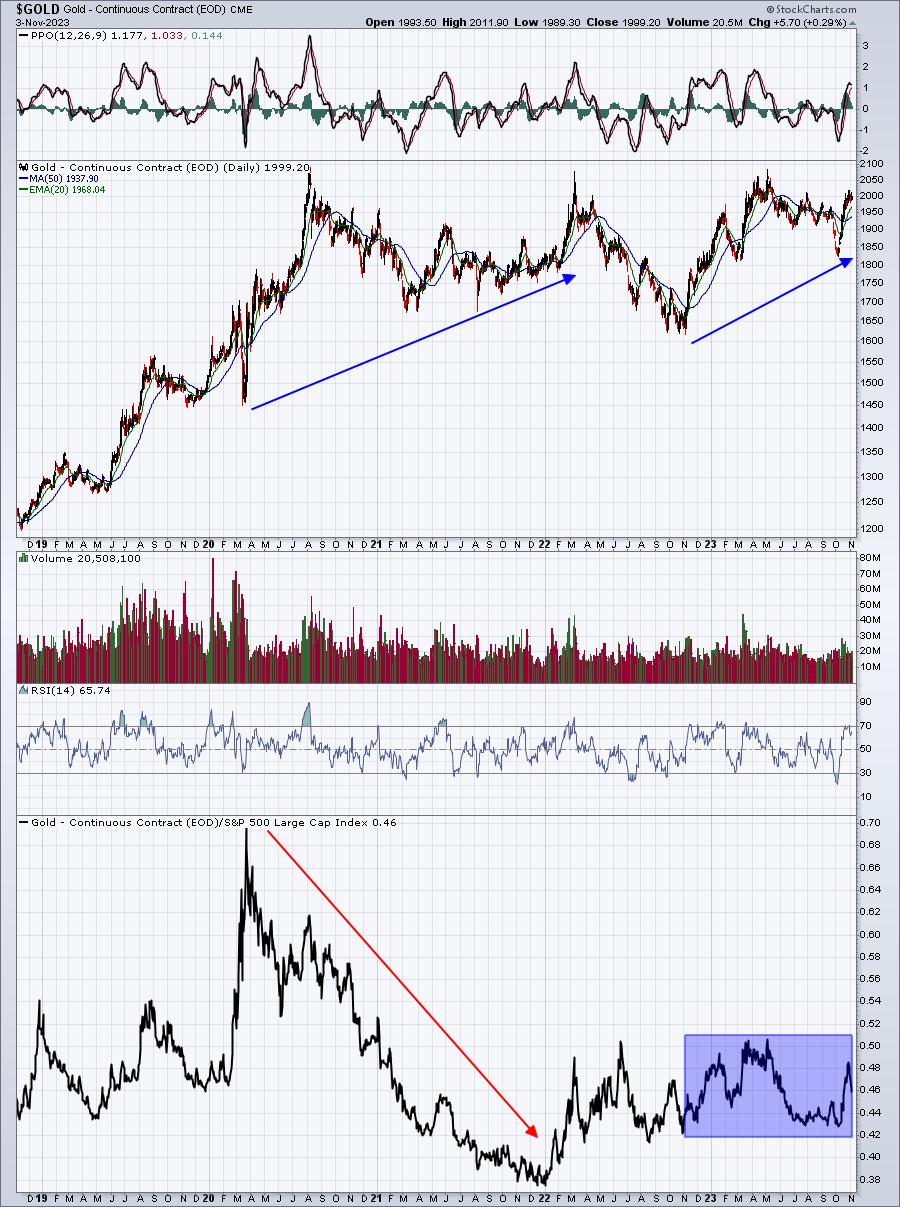
The top part of this chart shows that gold has made a couple of solid moves to the upside, right? Well, the first of those two moves was in 2020 and 2021. Yes, you'd have made money in gold, but the bottom panel shows you that you'd have wildly underperformed the S&P 500 during this period. And more recently, since the end of the 2022 cyclical bear market, gold has advanced nicely, but so too has the S&P 500. While gold hasn't been a train wreck on a relative basis, it's not exactly been a relative superstar either.
Remember, the best time to be invested in gold is when the Volatility Index ($VIX) is screaming to the upside. When the VIX is low or rapidly declining, gold is not where you want your money.
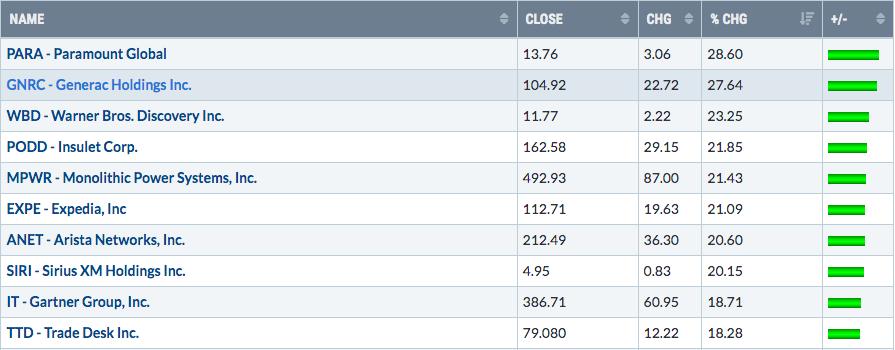
Top 10 Stocks - S&P 500/NASDAQ 100
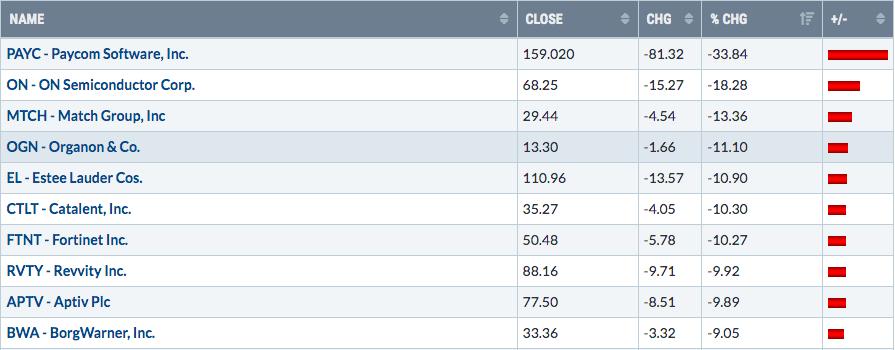
Bottom 10 Stocks - S&P 500/NASDAQ 100
Big Picture
The daily chart, just one week later, shows a surging U.S. stock market. The weekly chart came roaring back last week to reclaim both its 50-week SMA and 20-week EMA, and now looks much more bullish. But I love to step back and look at the long-term 100-year chart of the S&P 500, because it ignores all that short-term whipsaw and provides me a calming chart to remind me that this secular bull market is very much alive and kicking:
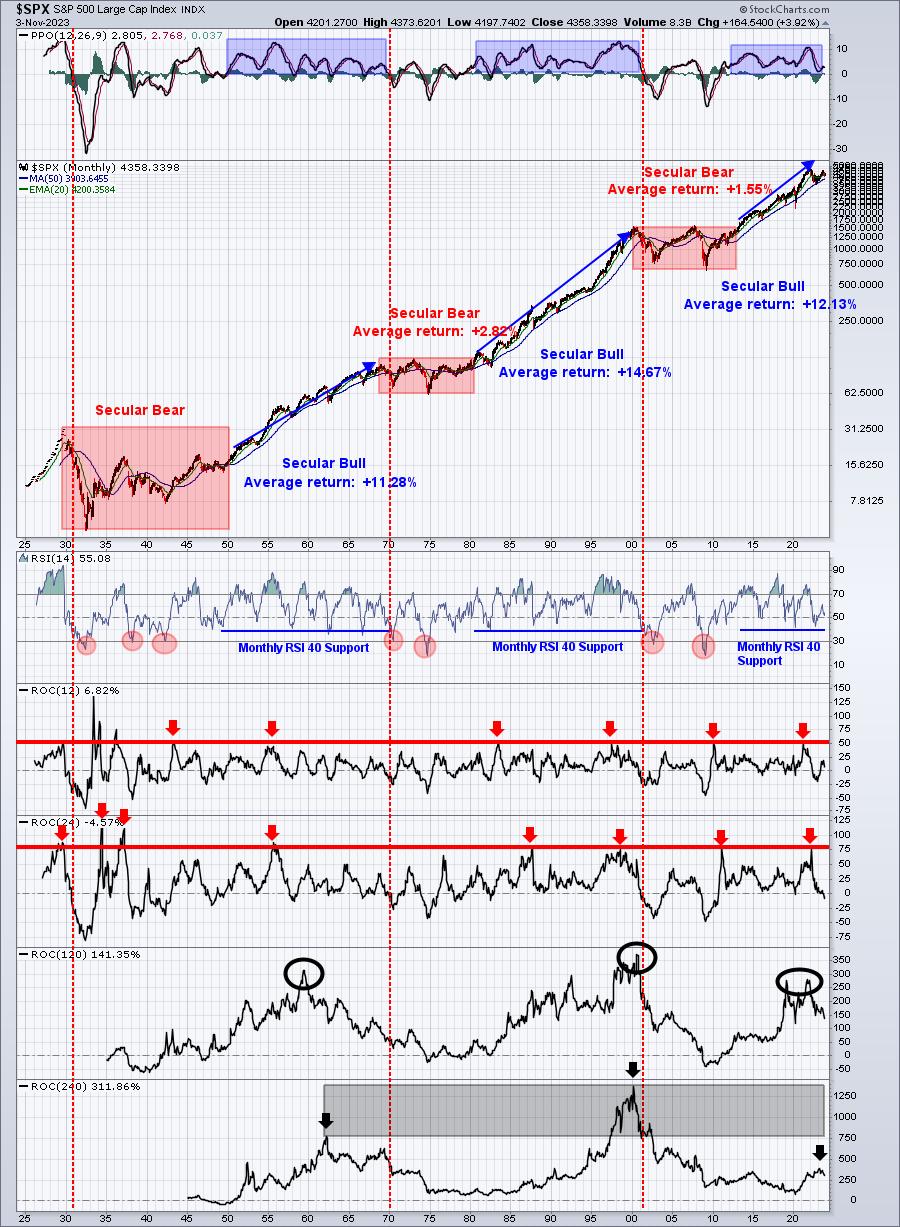
As I pointed out last week, I was confident that we were getting closer and closer to a major market bottom. Now here we are just one week later and our major indices seem much different and certainly much more bullish. I see a strong finish to Q4, minimally retesting the peak in July. I still wouldn't be shocked if we see an all-time before year end, though odds point to that more likely happening in Q1 2024.
Intermarket Relationships
Because we had such a big week last week, let's revisit a few key intermarket relationships. Remember, the top panel on these charts IGNORES gaps. I believe gaps provide market makers the ability to manipulate price action. By stripping out gaps, it provides us a much clearer picture of the rotation taking place throughout the trading session. The following shows us the intraday relationship without gaps and then the intraday relationship including gaps:
QQQ:SPY
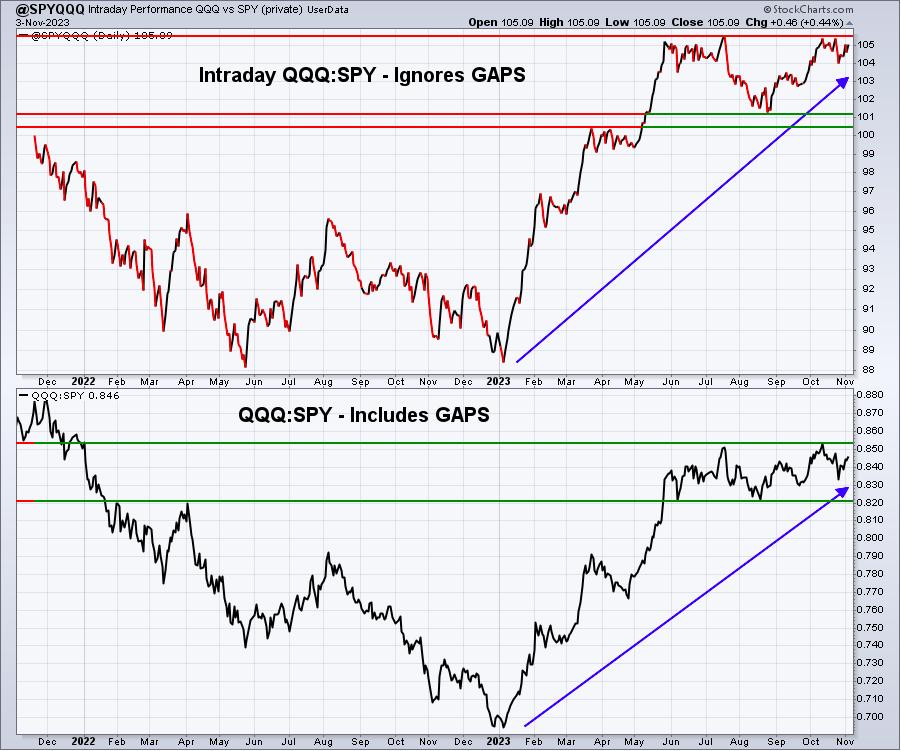
As I was working on this ratio last week, I discovered an error in my formula, which had only a minor impact on the chart. It has been corrected, however. Looking at this chart, I see significant rotation towards the more growth-oriented NASDAQ 100. It started in January and, while the relative strength slowed over the summer, it remains clearly on an upward trajectory, which is very bullish indeed.
XLY:XLP
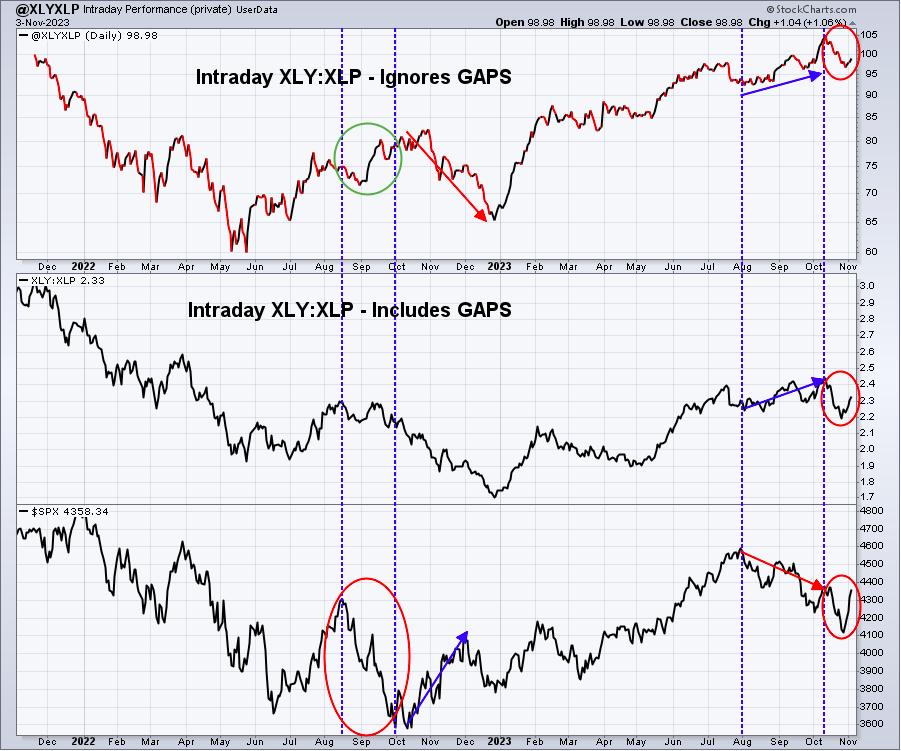
This chart shows the S&P 500 trending lower since July in the bottom panel. However, I see much more bullish rotation from staples (XLP) to discretionary (XLY) throughout 2023 and that strength has remained - even during the recent correction.
IWM:QQQ
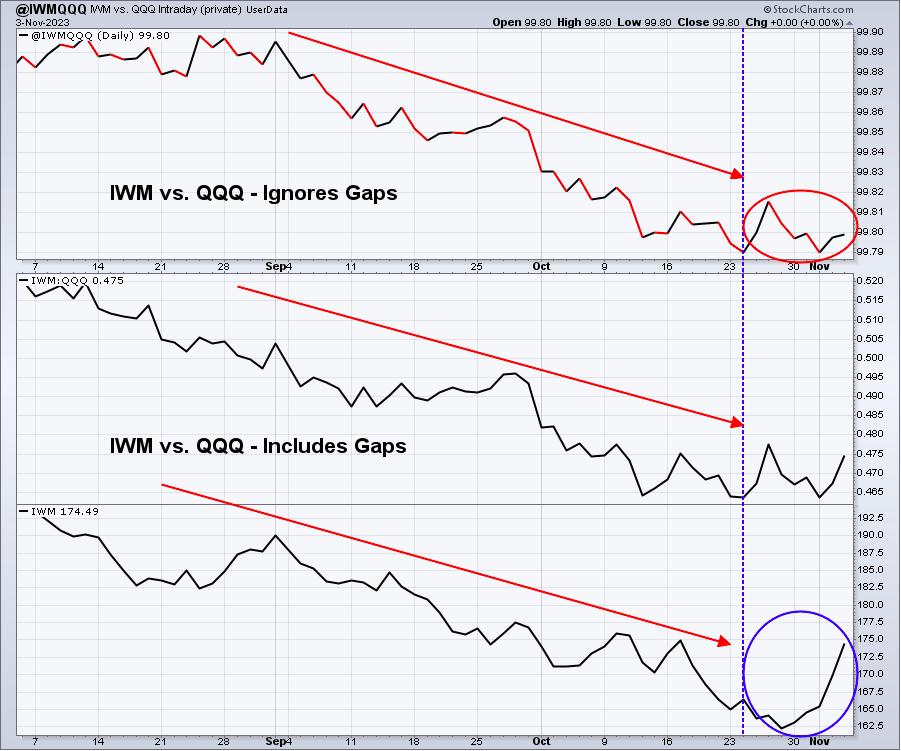
The IWM had a strong week last week, but if I strip out gaps, the IWM:QQQ ratio really didn't budge much. In other words, there isn't a lot of rotation towards small caps after the market opens and through its close. That could change and I'll definitely be watching this, especially given the seasonality chart on the IWM:QQQ that I provided earlier. Small caps do tend to have their best relative performance months in November and December. That makes sense, because industrials and financials also love these months and they tend to drive small cap performance.
Sentiment
Sentiment definitely remains in the bullish camp. Last week, I suggested that we could see the 5-day moving average of the equity only put call ratio ($CPCE) rise again into the range where bottoms form and that's what we saw.
Here's my adjusted CPCE (eliminating professional hedging) using a User-Defined Index at StockCharts:
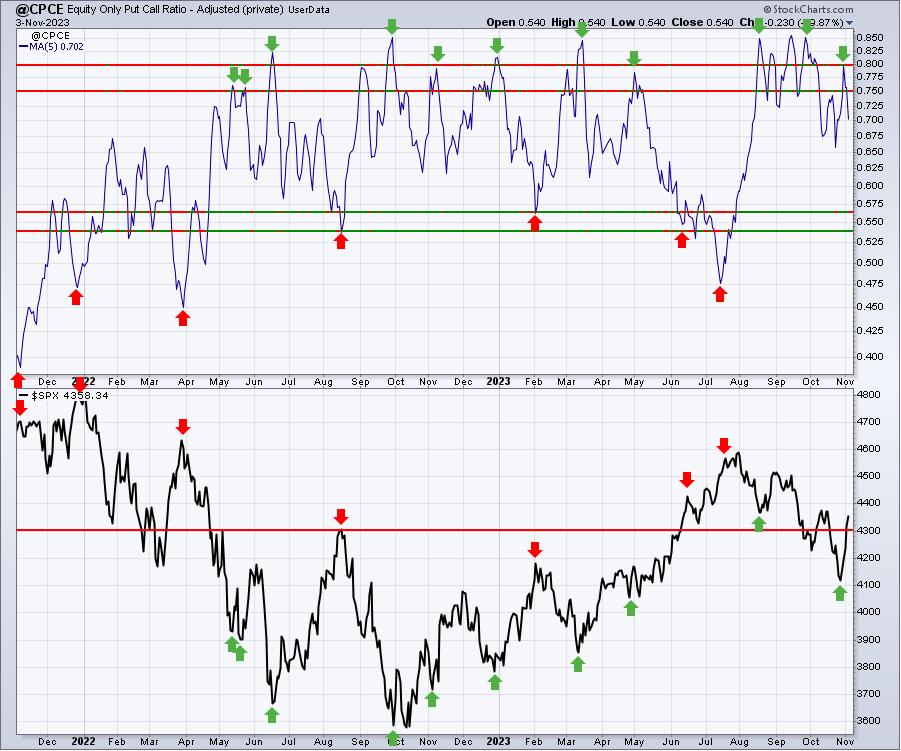
That 5-day reading of the CPCE jumped one last time to .80, which typically marks bottoms in the S&P 500, though many of them can be short-term bottoms. I wanted to see one more trip into the .75-.80 "danger zone" for the bears and that's exactly what we saw early last week. After that, U.S. equities have soared.
Also, the Volatility Index ($VIX) moved up into the low-20s and readings above 20 typically mark major market bottoms. I like to see a big drop in the VIX after these tops to confirm that fear is declining significantly. That also happened last week:
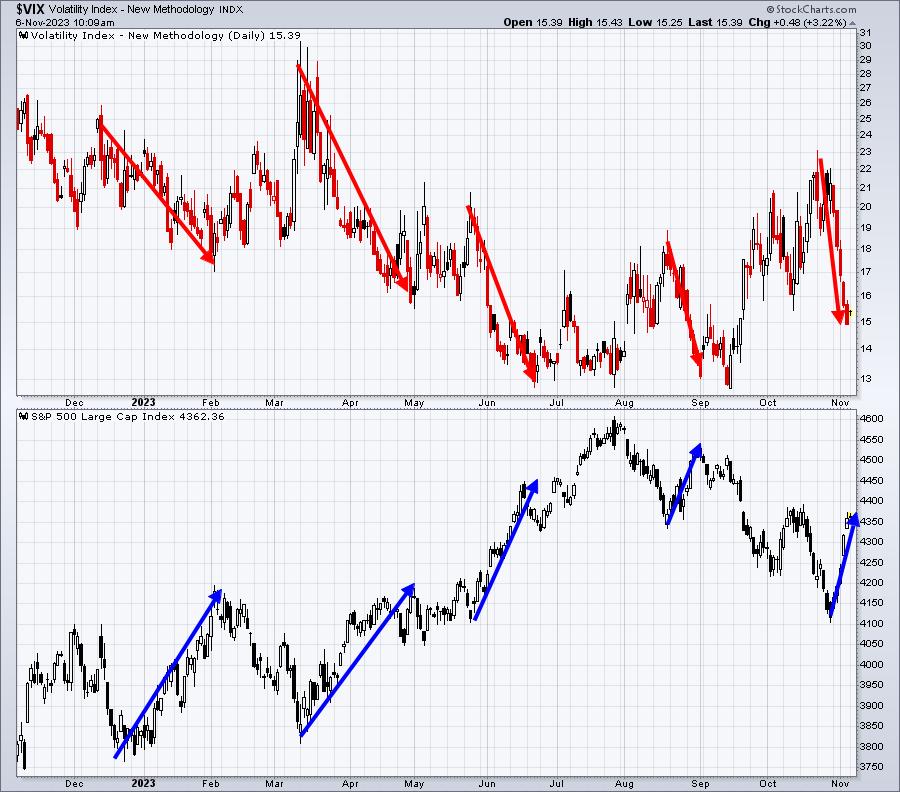
I think this relationship is quite clear. Now you might say, "Well, can't the VIX simply move back up, taking the market down?" The answer is yes, it could happen. But I like to deal in probabilities. We're now in the most bullish period of the year historically. During November, the S&P 500 has gained ground in 50 of the last 73 years. In December, the number jumps to 54 years out of the last 73. The odds favor the bulls right now.
Trade Setups
From a long-term
I want to ALWAYS remind everyone that I am NOT a Registered Investment Advisor (RIA) and am not recommending that anyone buy or sell any securities that I mention. EarningsBeats.com, nor any of its employees, are RIAs. Please consult your financial advisor before buying or selling any securities. The above analysis is for educational purposes only. You are fully responsible for any securities that you buy or sell.
Looking Ahead
Upcoming Earnings
Earnings season is still hot, though we'll see the number companies reporting quarterly results to drop this week. Here are the biggest earnings reports (in my opinion) by day and with market cap in parenthesis (this list is not meant to provide ALL the companies reporting earnings this week, just a few that I'll be watching closely):
Monday: NXPI ($46 billion), O ($35 billion)
Tuesday: UBER ($95 billion), DHI ($39 billion), DDOG ($26 billion)
Wednesday: DIS ($152 billion), BIIB ($35 billion), RBLX ($19 billion)
Thursday: AZN ($199 billion), BDX ($74 billion), TTD ($37 billion)
Friday: None
Key Economic Reports
Economic reports will be extremely light this week. I keep an eye on initial jobless claims every Thursday and consumer sentiment will be worth watching, but that's about it. Here's the list of all key reports:
Monday: None
Tuesday: None
Wednesday: Wholesale inventories
Thursday: Initial jobless claims
Friday: Consumer sentiment
Historical Data
Each week, I'll provide you the average annualized returns for each calendar day and by index. Here are the historical numbers for this week (We will be providing more visual images of seasonality in future reports, but for now I'm trying to avoid some of the scrolling issues that Excel images were causing):
S&P 500
- November 6: -25.89%
- November 7: +13.20%
- November 8: +20.60%
- November 9: -7.12%
- November 10: +28.83%
NASDAQ
- November 6: +23.02%
- November 7: -49.81%
- November 8: -6.19%
- November 9: -57.97%
- November 10: -3.71%
Russell 2000
- November 6: +37.05%
- November 7: -67.36%
- November 8: +31.81%
- November 9: -41.77%
- November 10: +64.04%
The S&P 500 data dates back to 1950, while the NASDAQ and Russell 2000 information date back to 1971 and 1987, respectively.
We've now begun the most bullish period of the calendar year. The close on October 27th through the close on January 18th is THE ABSOLUTE BEST TIME OF THE YEAR FOR U.S. EQUITIES - HISTORICALLY SPEAKING. The next two weeks are a bit more neutral and then historical bullishness returns for the last week to 10 days of November, up to and through the Thanksgiving Day holiday.
Final Thoughts
We had a very strong week last week and so these are a few things I'll be watching in the week ahead:
- Earnings remain quite heavy, including a big report from Walt Disney (DIS) on Wednesday after the close.
- The 10-year treasury yield ($TNX). The negative divergence that I kept speaking of morphed into a ton of bond buying, which sent the TNX down below 4.50% early Friday morning before we rebounded late. Today, the TNX has climbed back to 4.65%. The 20-day EMA is at 4.75% and falling. If we've begun a downtrend in the TNX, I would expect to see it remain below its 20-day EMA.
- Volatility ($VIX). The VIX plunged last week, down roughly 30%. It's significant, because a VIX that's above 20 and the falls back beneath 17 is usually a VIX that continues to fall. Currently, the VIX is up 1.7% today, but down from the open, despite a bit of selling in the market. If fear is done, so are the bears.
- XLY vs. XLP. This is my favorite sustainability ratio and it moved higher all last week to support the overall market move. Do the discretionary stocks continue to show relative strength? If so, it's another feather in the bulls' cap.
- S&P 500. There was a ton of damage inflicted on the bears' story of a further decline in U.S. equities. The S&P 500 quickly moved back through its 20-day and 50-day moving averages. But the bigger story might be that the S&P 500 also moved above its 20-week and 50-week moving averages. That rarely happens during a bear market. This is further supporting my bullish argument.
- Strength into the close. Just last week, I suggested that weakness into the close had to be reversed. We had seen like 8 of 9 days with weak finishes. That changed last week, however, as the S&P 500 closed above its midpoint of the day all 5 days.
- The Fed meeting is now behind us. Also, there are few economic reports out this week. That leaves the U.S. market to trade off current technical conditions. Given that those conditions turned heavily bullish, I'd say the bulls are now back in control of the action.
Feedback
If you'd like to share your thoughts on our Weekly Market Report, positive or negative, you can reach us at "[email protected]".
Happy trading!
Tom