
EB Weekly Market Report - Monday, December 4, 2023
Website
First, I want to apologize for our website being down most of Sunday. We were told by our hosting provider that routine maintenance would take place and be brief. Unfortunately, they continued sending us apologies throughout the day for the huge delay. It was completely out of our control, and because our website was down, we had no way to reach out to everyone. Again, we apologize. But there is a silver lining....
Fall Special Extended
Due to popular request AND the unfortunate website issues yesterday, we've decided to extend the Fall Special to allow everyone the chance to take advantage of our BEST DEAL of the year! CLICK HERE and choose the plan that makes the most sense for you.
Special Event - The Bowley Trend
We launched a CRAZY popular 2-part series on the historical tendencies of the S&P 500 around one month ago and the response has been awesome. Today, at 4:30pm ET, I plan to walk everyone through the key tendencies that we should ALL be aware of as they've proven that history really does repeat itself!
I'll also add a few little tidbits of history that I believe you'll all LOVE. Be sure to join me today. Room instructions will be sent out separately this afternoon. If you're unable to make it today, no worries. We'll make sure everyone has access to the recording. Feel free to watch it at your earliest convenience.
Now on to this week's report.....
Weekly Market Recap
Major Indices
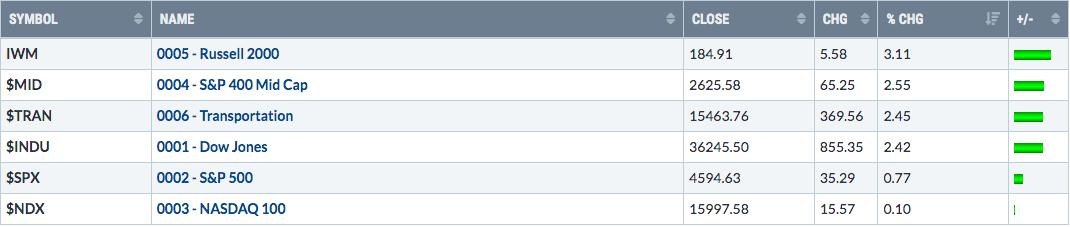
It certainly appears as though typical December rotation from growth to value has already begun. The growth-oriented NASDAQ 100 was mostly ignored by buyers last week. The S&P 500, which is a bit more value-oriented, performed better, but also lagged. The leadership came from where? Small and mid caps. The Russell 2000 (IWM) saw most of its strength on Friday, soaring through key price resist at 181.76:
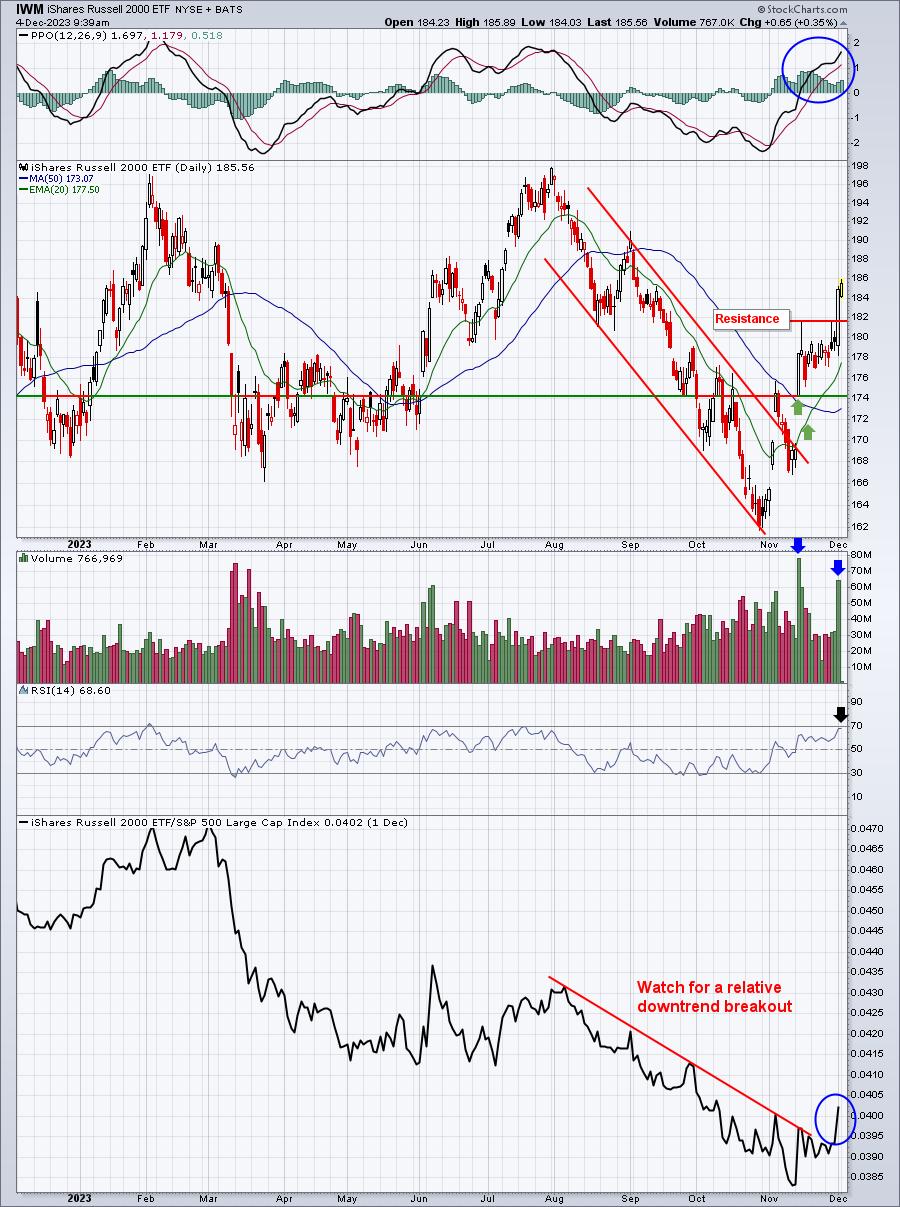
I wanted to see the relative downtrend line to break and we saw that late last week. Also, the strength this time saw the IWM's RSI easily push through 60, which is generally critical to ending a downtrend. Finally, check out the PPO, which is now soaring. If we miss the other signs, this one is beating us over the head that momentum has turned quite bullish. This would suggest that any 20-day EMA test would be buyable.
A lot of technical analysts LOVE the use of breadth indicators. Personally, I find most of them to be lagging, or confirming, indicators. In my studies, I can't find enough consistency in their signals, so I choose to ignore them. It's a personal thing. I don't blame you if you use them, because common sense tells us that the larger number of stocks supporting a trend, the better. But just keep in mind that if you're using breadth on a market-cap weighted index, that index will perform better or worse based on how the largest cap-weighted stocks in that index are doing. I would consider following more closely those breadth indicators that follow a very diversified index, not a concentrated one.
As an example, the NASDAQ 100 is market-cap weighted. The 10 most largest-weighted market cap stocks will heavily influence the direction of this index. In other words, if those 10 stocks are trading above a key moving average like the 20-day or 50-day, will it matter much if two-thirds of the other 90 are below that moving average? I'd be much more concerned if the top 10 began to fail to hold key support.
Sectors
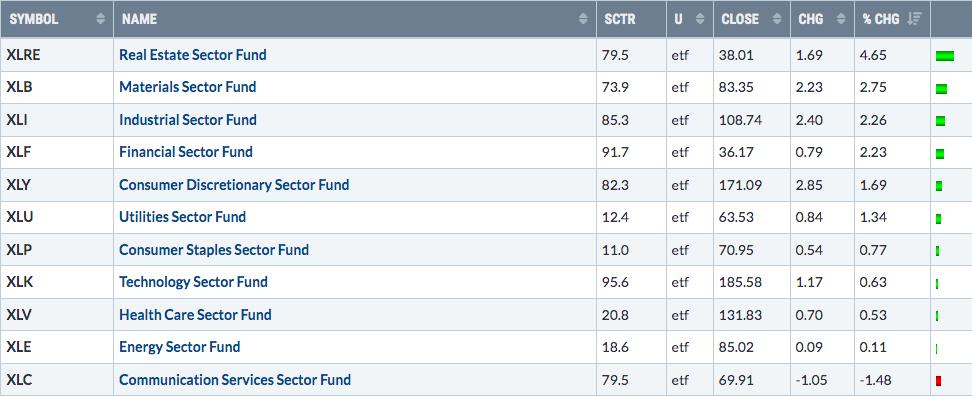
Industrials (XLI) have come roaring back and a big part of that comeback is due to a suddenly-strengthening transportation group ($TRAN). Check this out:
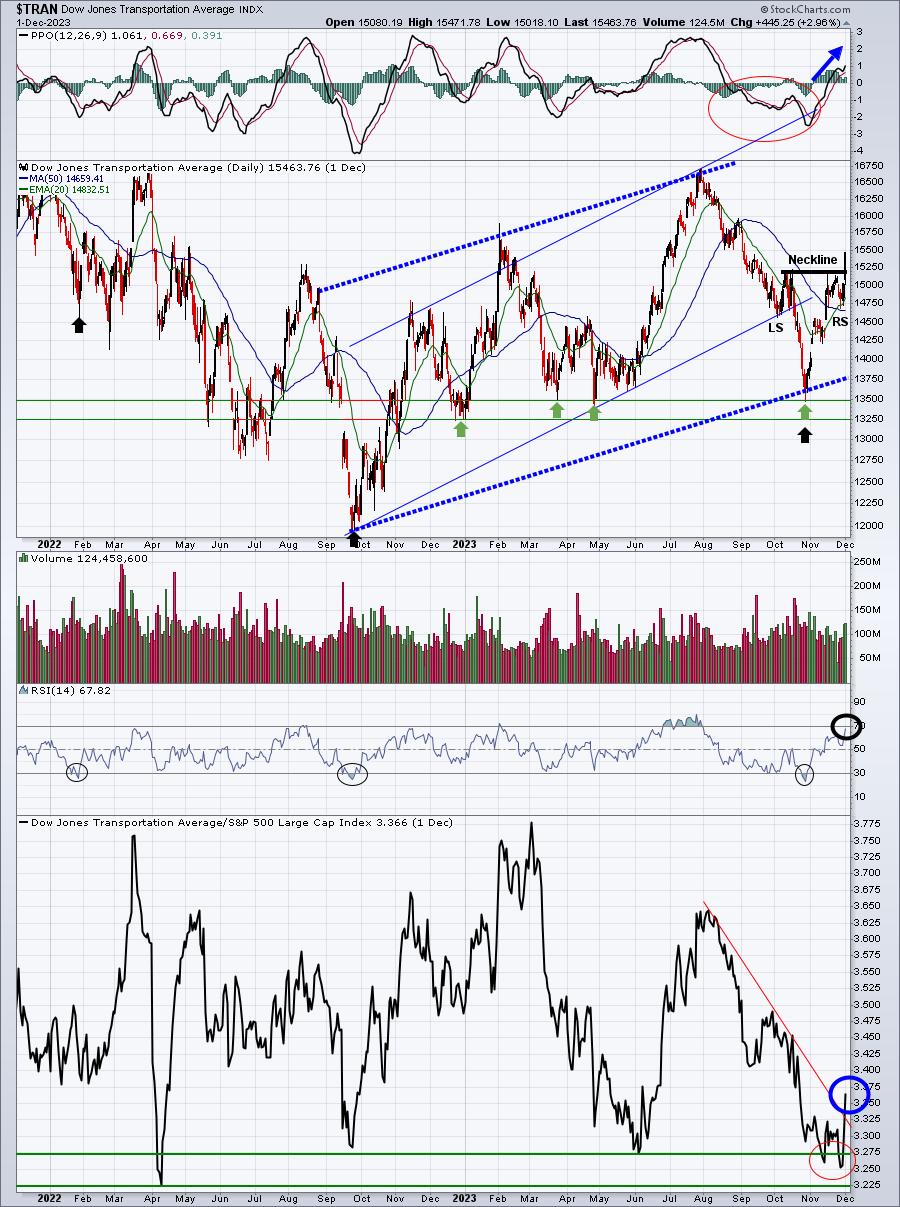
This is an absolutely PERFECT chart to illustrate how technical conditions change and how we need to be prepared to change with them. The "thin" lines above represented my analysis of the TRAN chart about 6-7 weeks ago. The "thick" lines are my annotations and what I see on this chart as of this weekend. It's a total reversal. Back then, we had a complete channel breakdown, momentum (PPO) was accelerating lower, RSI below 30 confirmed we were in a downtrend, and relative strength was in the tank, approaching a 20-month low from April 2022. What was there to like?
Let's fast forward to today. We've seen a reversing, bottoming head & shoulders pattern form AND execute. Relative strength has broken its downtrend line. The RSI is approaching 70, rarely seen during downtrends. We now have a new channel that's formed. The October low now looks like a test of price support from March/April 2023 and a key low in the current up channel. Finally, the PPO is now above the centerline, showing bullish momentum, and strengthening.
This is a big reason why so many traders fail. They don't accept the fact that their initial technical read is no longer valid. They stick with it way too long "to be proven right", sometimes even doubling down on the wrong side of the trade. Market makers have no sympathy. They just willingly take our money, unfortunately.
Top 10 Industries Last Week
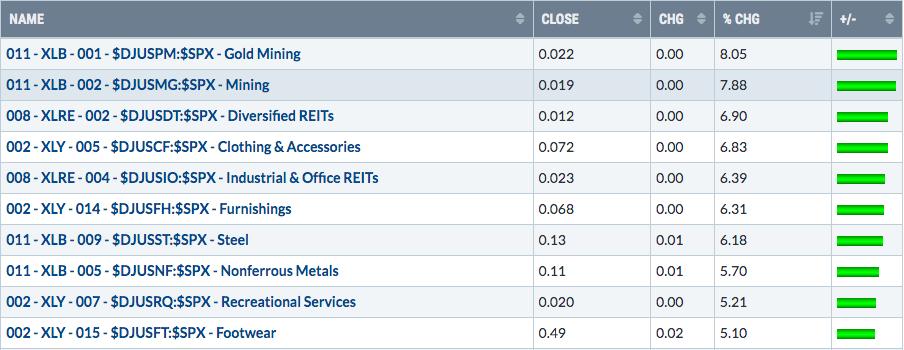
I've written about gold recently. Yes, it's breaking out on an absolute basis and can be traded. Just keep in mind that it's been an awful relative performer throughout this secular bull market. So I'd have a very tight leash on any gold trade.
Bottom 10 Industries Last Week
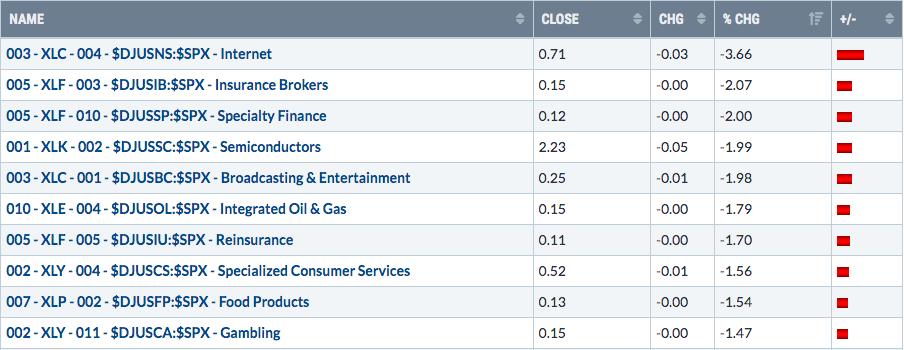
As I look at this Bottom 10 list, I can't help but notice internet and semiconductors both falling in the Bottom 4. These two groups had been on fire, but our expectations should always be lowered during the month of December. Check out the two decade seasonality chart for both:
Internet
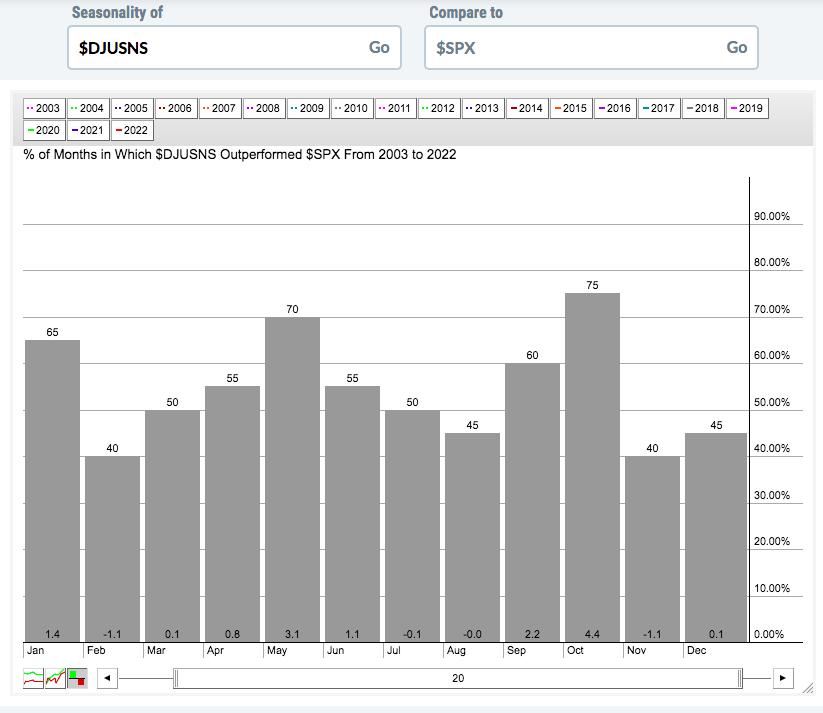
This group doesn't typically finish the year well. But using this seasonal weakness as an opportunity to build a position makes sense as January is typically a month of strong outperformance. And if I break down the DJUSNS into the 3 calendar months of every quarter, this is how it would look:
- Month 1 of quarters (Jan, Apr, Jul, Oct): +6.5%
- Month 2 of quarters (Feb, May, Aug, Nov): +0.9%
- Month 3 of quarters (Mar, Jun, Sep, Dec): +3.5%
The first month of each calendar quarter is where we see the most relative strength in internet stocks.
Semiconductors
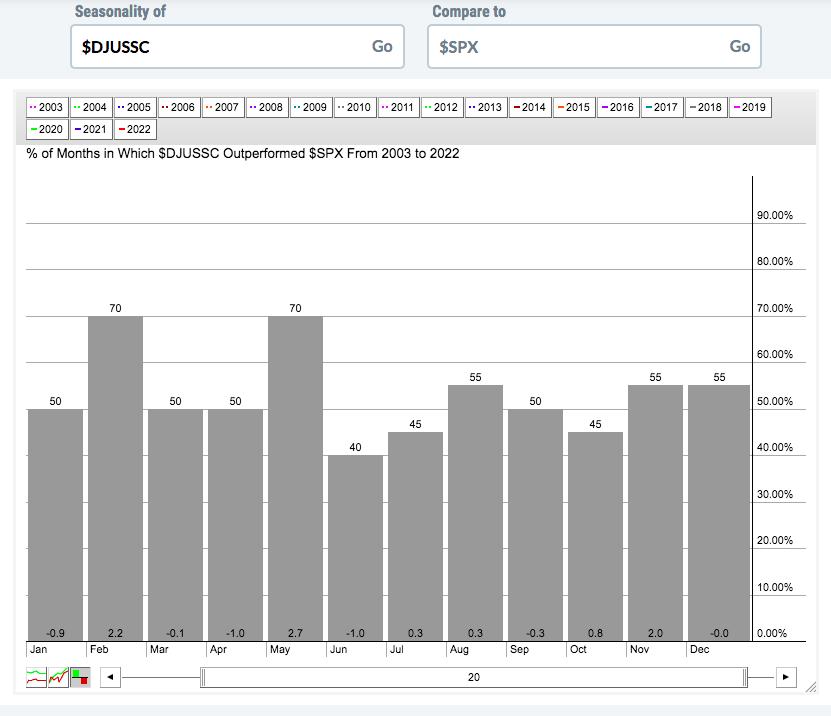
Again, we shouldn't expect much from this group heading into year end. And January doesn't get much better either. The DJUSSC had a huge run higher in November and likely needs some time to digest its enormous 2023 gains. Doing the same monthly exercise as we did on the DJUSNS, we see that the DJUSSC really loves the 2nd calendar month of each quarter:
- Month 1 of quarters (Jan, Apr, Jul, Oct): -0.8%
- Month 2 of quarters (Feb, May, Aug, Nov): +7.2%
- Month 3 of quarters (Mar, Jun, Sep, Dec): -1.4%
That 2nd month of the calendar quarter really jumps out, doesn't it? I plan to talk about this more at today's 4:30pm ET webinar and how we might take advantage of it. I hope you can make it, but if you can't, be sure to check out the recording.
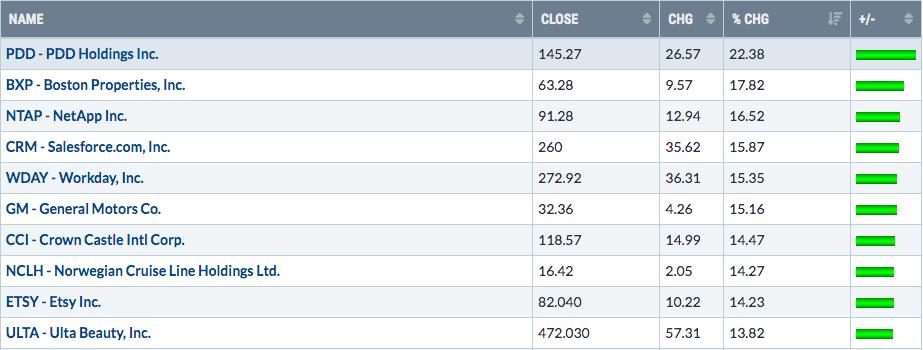
Top 10 Stocks - S&P 500/NASDAQ 100
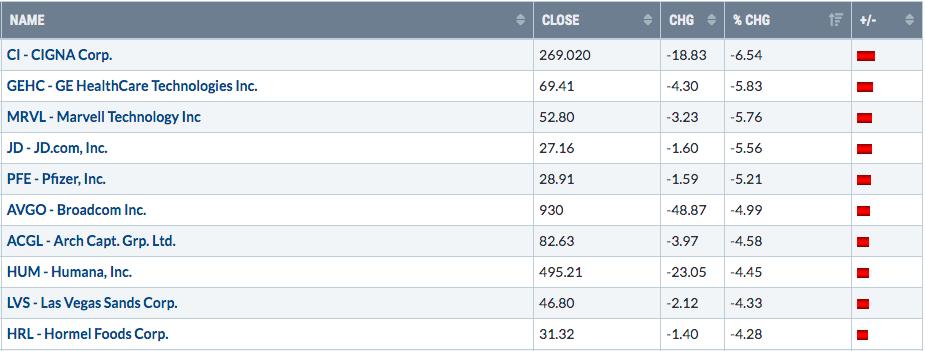
Bottom 10 Stocks - S&P 500/NASDAQ 100
Big Picture
We're pausing at the 4600 level on the S&P 500, which is a big deal to short-term traders and most of the media. But as we step back with perspective, 4600 isn't even noticeable. Long-term investors honestly should be yawning at all the short-term noise. This long-term BIG PICTURE chart emphasizes that all is good:
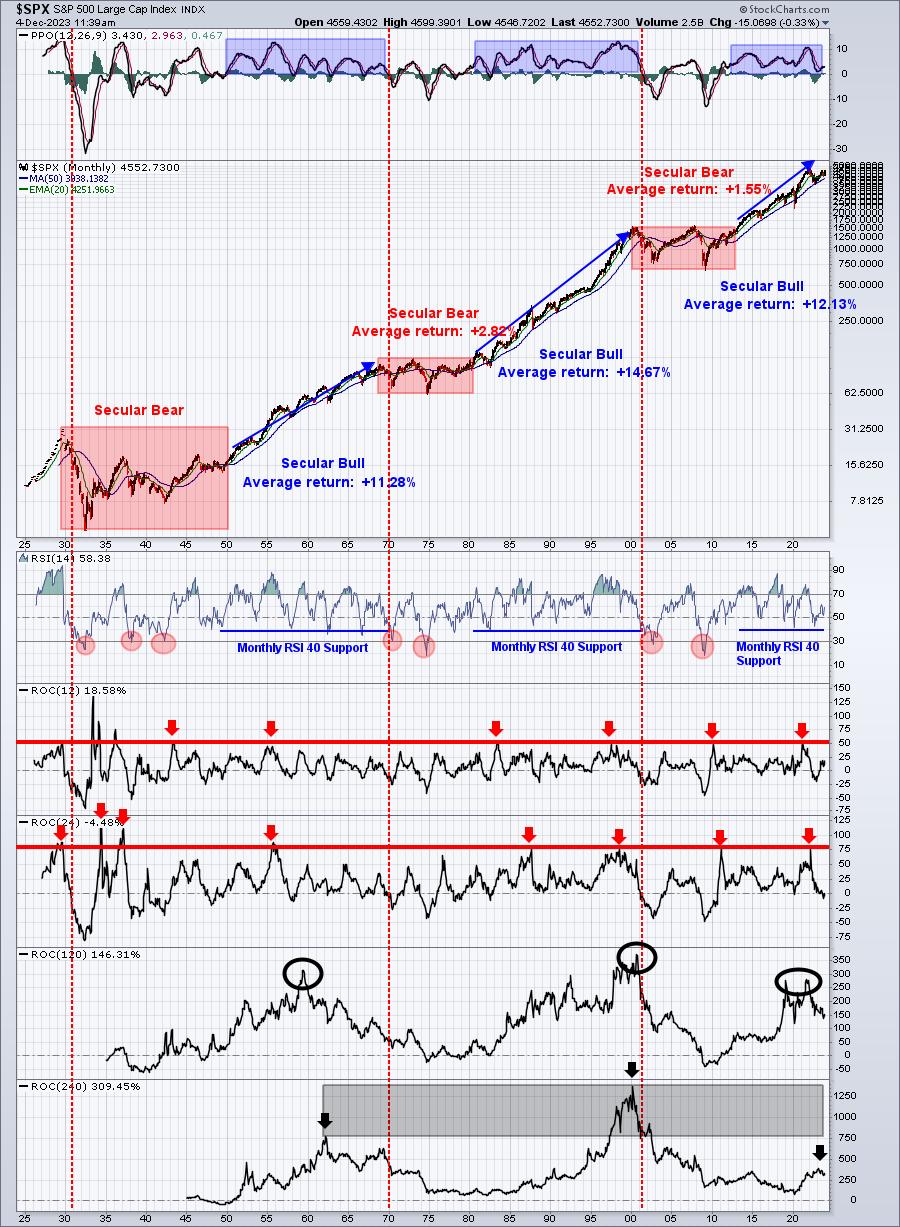
I'm periodically checking this chart, because a monthly RSI move back above 60 would be yet another confirmation that the long-term uptrend remains perfectly intact. Most monthly RSI readings above 60 are synonymous with SECULAR bull market.
Commodities
Just a quick update on copper as I failed to complete my thoughts on it in last week's report. I've provided the rest of my thoughts and CAPITALIZED THEM:
Copper
Copper is tied to global economies, much more so than either gold or silver. Copper is used in so many applications that its price is driven mostly by global economic strength. When the price of copper turns lower, it could be telling us something about the global economic environment. While copper is well off its early-2022 high, IT'S UPTREND REMAINS INTACT AND IS CURRENTLY MOVING IN CONCERT WITH THE S&P 500 TO THE UPSIDE:
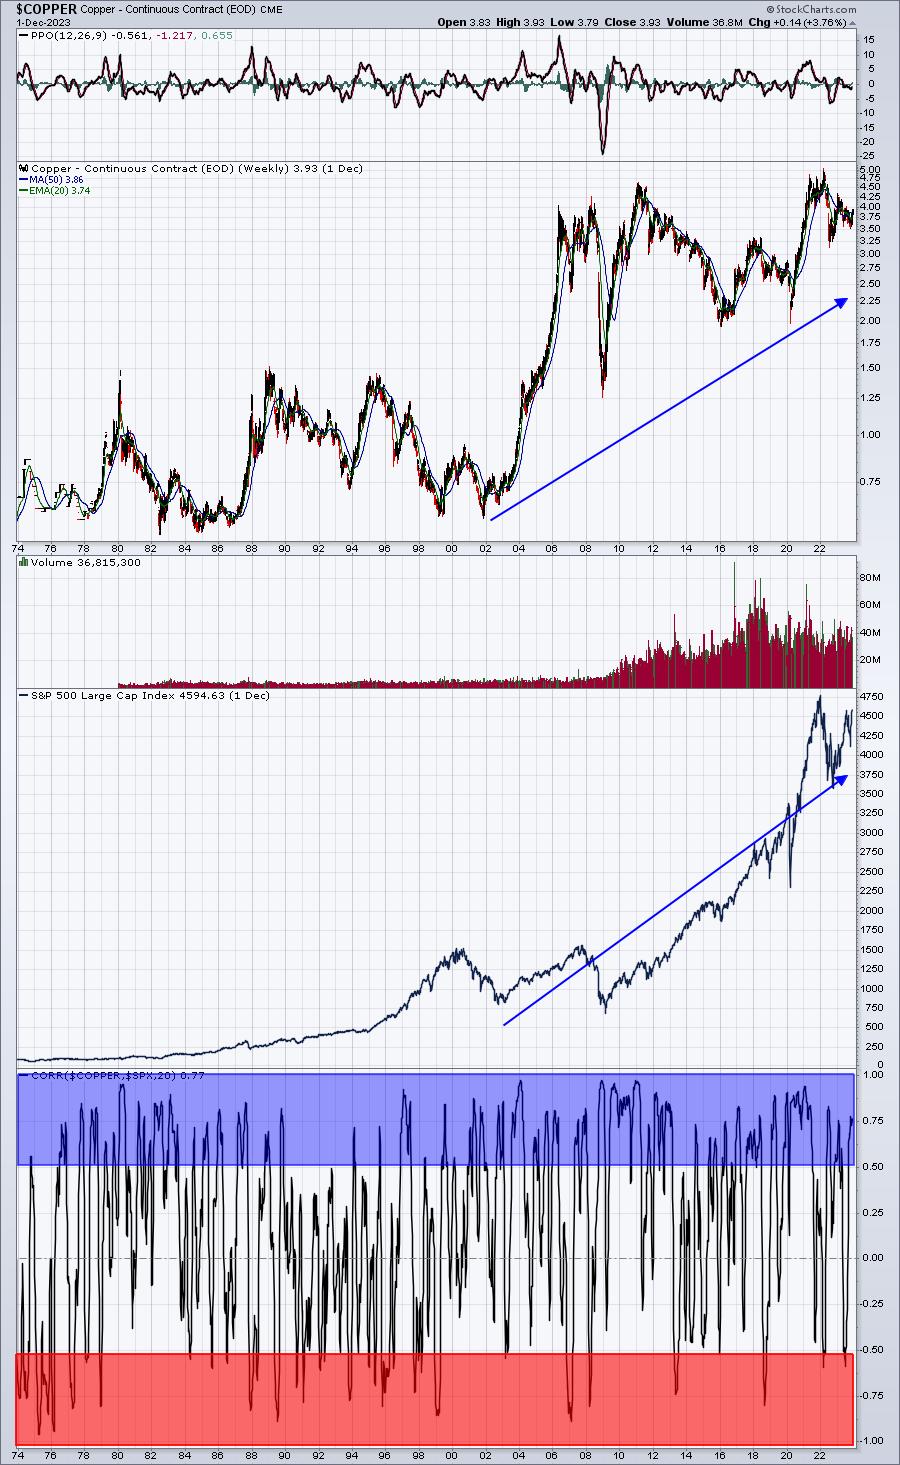
(NOTE THAT COPPER MOVED UP ANOTHER 4% SINCE LAST WEEK, CONTINUING TO SUPPORT THE S&P 500 ADVANCE)
Listen, I wouldn't be trying to call the S&P 500 direction based solely on the daily fluctuations of copper prices. But the blue-shaded area above shows us the very strong positive correlation between copper prices and the S&P 500. We also see these two inversely correlated plenty of times, but this 50-year chart gives me a sense that these two travel hand in hand much more than opposite one another. So I typically construe rising copper prices as a bullish signal for U.S. (and global) equities.
Intermarket Relationships
QQQ vs. SPY
We've been witnessing a bit of rotation from growth-oriented stocks to value-oriented stocks, which is typical for the month of December and also tends to occur in the third month of calendar quarters - after earnings reports are mostly complete and we switch into a "sell on the news" mentality. The following QQQ:SPY "intraday" chart (which ignores opening gaps) reflects this potential transition:
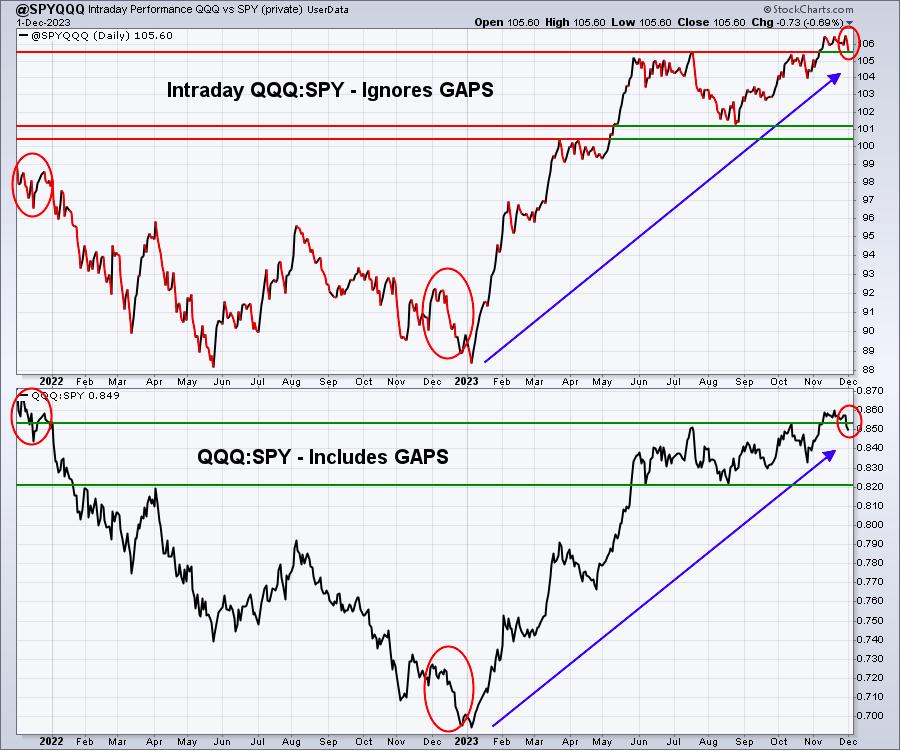
You can see what happened to this ratio the past 2 years in December. I don't know if we'll see a 3-peat, but we should at least acknowledge the possibility that value leads us into year end.
XLY:XLP
We need to also realize that December has produced similar results for the aggressive consumer discretionary (XLY) sector vs. its defensive consumer staples (XLP) counterpart. If money continues to rotate towards value, the XLP will be a likely beneficiary.
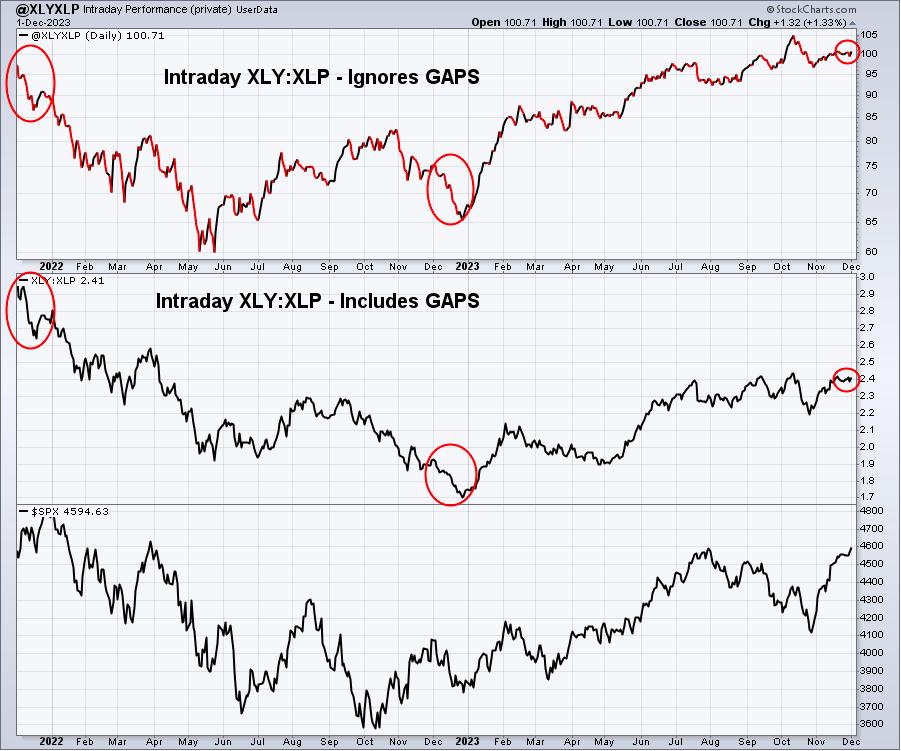
Temporary rotation into value is actually healthy for the stock market as it allows stocks that had been ignored during the big market thrusts higher to play "catch up" for a brief period of time. December may, in fact, be that time once again.
Sentiment
As a matter of routine, I follow the 5-day SMA of the equity only put call ratio ($CPCE) for short-term directional moves and reversals. However, for the long-term, I use an "ocean-liner" type of put call signal. I step back and view the 253-day SMA of the CPCE. MAJOR long-term tops and bottoms occur when sentiment ultimately moves too far in one direction or the other. Check out this current "ocean-liner" signal:
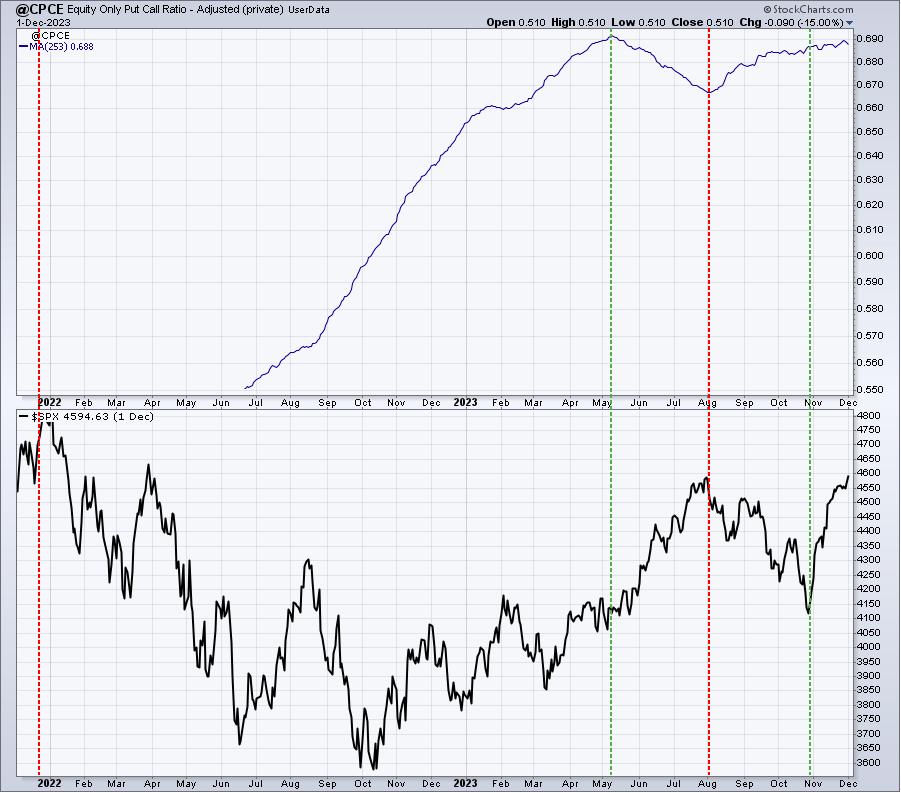
When this long-term signal rolls over, it can provide us a significant clue that long-term sentiment has reached a turning point. And when that occurs, we typically see a very important reversal in the S&P 500. The fact that this 253-day SMA is now turning back down again, I fully expect to see the CPCE to continue to print lower readings in the days, weeks, and months ahead as overall market conditions turn much more bullish.
I find it interesting that the November rally occurred with this long-term CPCE still rising slightly. As a bull, I'm very encouraged by the current rally continuing, possibly even accelerating as the substantial number of bears are forced to finally join the party.
Trade Setup
Since beginning this Weekly Market Report in early September, I've discussed the long-term trade candidates below that I really like. Generally, these stocks have excellent long-term track records. Only in very specific cases (exceptions) would I consider a long-term entry into a stock that has a poor or limited long-term track record. Check these out:
- JPM
- BA
- FFIV
- UPWK (exception, limited history) - a heavy volume push through 16 would be very bullish here
- MA
- GS - breaking trendline resistance near 350-355 would be very bullish
- FDX
- AAPL
- CHRW
- JBHT
- STX
When you look at their charts, be sure to look at a 20-year chart, or even longer, to get a better idea of what you might expect as we look years into the future. Many of these stocks also pay a dividend, which obviously adds to total return and should be considered - especially for income investors.
If investing from a longer-term perspective, buying long-term winners at short-term beaten down prices make a lot of sense to me. That's NOT my short-term trading style as I try to capture gains from momentum in the short-term. But here's a stock that has an excellent long-term track record, but has lost one-third of its market cap over the past 6-7 months, now reaching 50-month SMA support. It also offers a nice 2.50% dividend yield. Check out The Hershey Company (HSY):
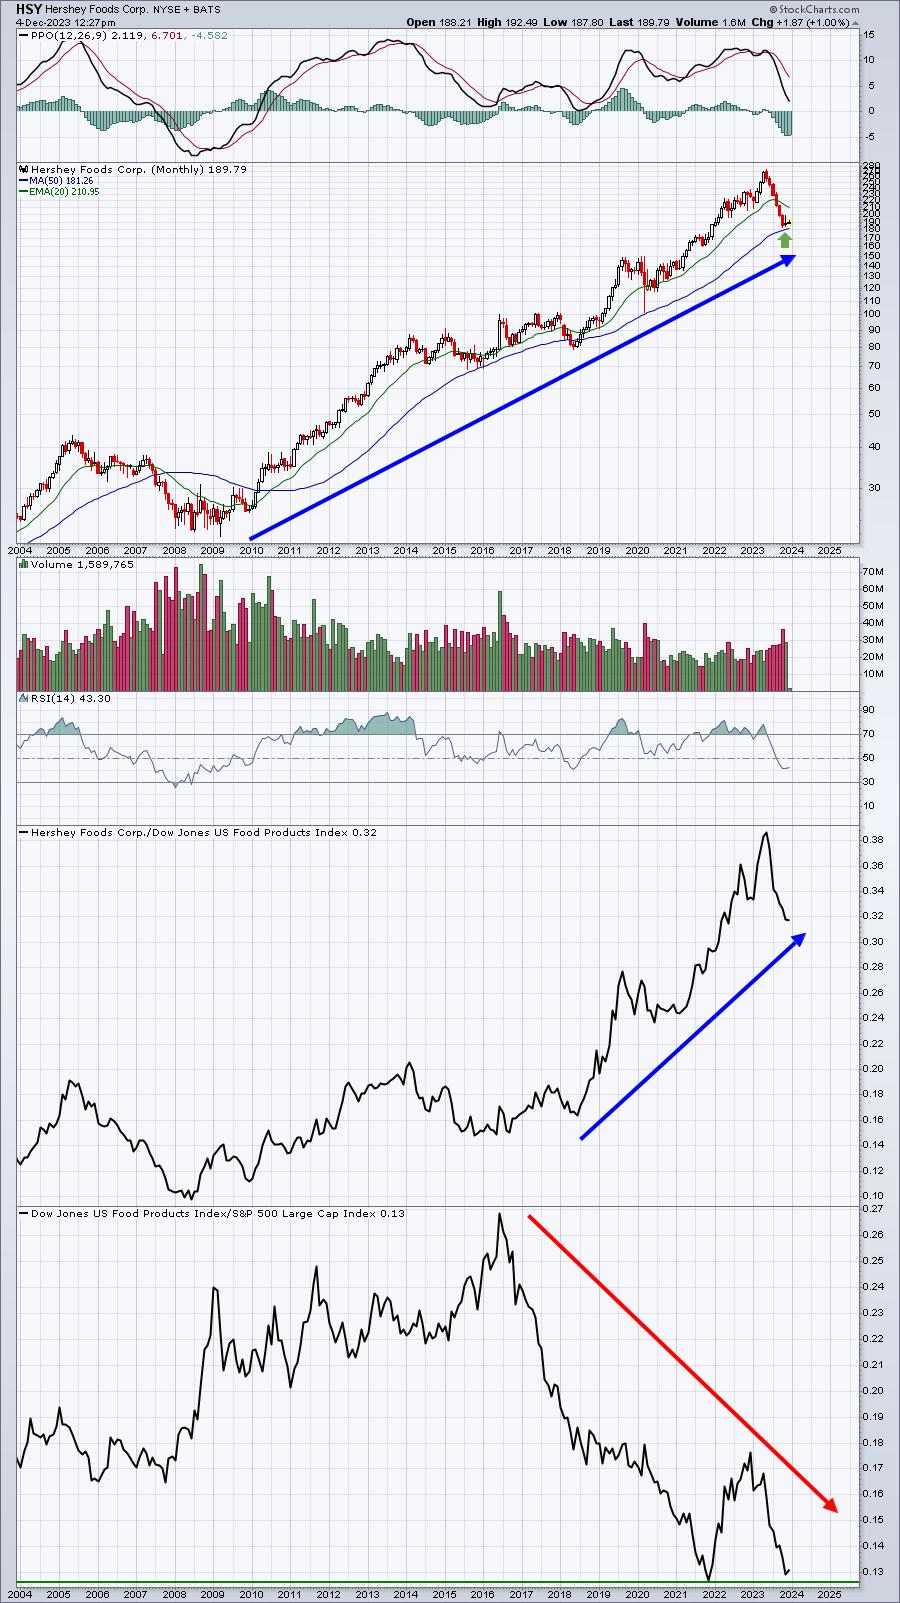
HSY remains very attractive relative to its food products peers ($DJUSFP). It's simply the group's weakness that has provided a much better entry price into HSY.
Looking Ahead
Upcoming Earnings:
The following earnings reports (market cap in parenthesis) are, in my opinion, at least relatively significant and worth watching. This is NOT a list of ALL companies reporting this week, so please be sure to check for earnings of any companies that you own or add:
- Monday: None
- Tuesday: AZO ($46 billion), MDB ($30 billion)
- Wednesday: VEEV ($28 billion)
- Thursday: AVGO ($382 billion), LULU ($57 billion), DG ($29 billion)
- Friday: None
Key Economic Reports:
- Monday: Factory orders
- Tuesday: ISM services
- Wednesday: ADP employment, productivity and costs
- Thursday: Initial jobless claims, wholesale inventories
- Friday: Nonfarm payrolls, consumer sentiment
Historical Data
I'm a true stock market historian. I am absolutely PASSIONATE about studying stock market history to provide us more clues about likely stock market direction and potential sectors/industries/stocks to trade. While I don't use history as a primary indicator, I'm always very aware of it as a secondary indicator. I love it when history lines up with my technical signals, providing me much more confidence to make particular trades.
Each week, I'll provide you the average annualized returns for each calendar day and by index. Here are the historical numbers for this week:
S&P 500
- December 4: +37.81%
- December 5: +37.61%
- December 6: +47.72%
- December 7: +19.45%
- December 8: +14.63%
NASDAQ
- December 4: +28.84%
- December 5: +100.18%
- December 6: +17.26%
- December 7: -7.70%
- December 8: +51.90%
Russell 2000
- December 4: +22.88%
- December 5: +157.14%
- December 6: +52.01%
- December 7: -34.93%
- December 8: +90.60%
The S&P 500 data dates back to 1950, while the NASDAQ and Russell 2000 information date back to 1971 and 1987, respectively.
We are now in the most bullish period of the calendar year. The close on October 27th through the close on January 18th is THE ABSOLUTE BEST TIME OF THE YEAR FOR U.S. EQUITIES - HISTORICALLY SPEAKING. Generally, this week is bullish. We do begin to see more historical selling as this week ends. So I'm providing you an early warning about next week. When I provide the numbers for next week, you'll understand why I'm telling you now. Lots of red. If the current strength continues into the latter part of the week, I'll be taking some profits and will likely be out of ALL leveraged ETFs.
Final Thoughts
December usually gets off to a nice start and we've certainly seen that - especially in the small cap arena. Don't forget, however, that December seasonality does have one very weak period and its next week. With that in mind, here's what I'm currently watching:
- All relative ratios dealing with aggressive areas vs. defensive areas or growth areas vs. value areas. I won't be surprised to see further deterioration in these ratios before they turn higher again later this month or in January 2024.
- The two key jobs reports this week - ADP employment on Wednesday and the nonfarm payrolls on Friday. Both of these are capable of being market-moving reports, especially the Friday nonfarm payrolls.
- The 10-year treasury yield ($TNX). How will it react to the jobs reports? It reached a low of 4.21% on Friday and the topping H&S breakdown initially measures t0 4.10%. Do we see a weaker-than-expected jobs environment? If so, that 4.10% TNX may not be too far away.
- The Volatility Index ($VIX). It spiked at the open this morning, but it's been in a clear downtrend and has been moving opposite the S&P 500, which is normal. I'm always on watch for periods when the VIX and the SPX move in the same direction. I'm not seeing any of that currently.
- Financials (XLF) and industrials (XLI). These two groups LOVE the fourth quarter, but that historical strength hadn't really shown up until last week. Now they both face overhead resistance (XLF at 36.50 and XLI at 108.75). Breakouts would suggest further strength in value stocks. Failures and we'll have to watch and evaluate.
Feedback
If you'd like to share your thoughts on our Weekly Market Report, positive or negative, you can reach us at "[email protected]".
Happy trading!
Tom