
EB Weekly Market Report - Sunday, December 17, 2023
Weekly Market Recap
Major Indices
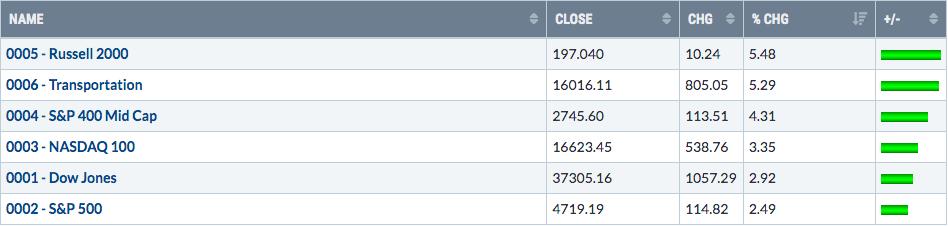
It was all about the small caps last week. They had one of their best relative performance weeks of the year and it occurred when it typically does - in December. Ever since the big gap up in November, the IWM has been in a heart-pumping uptrend:
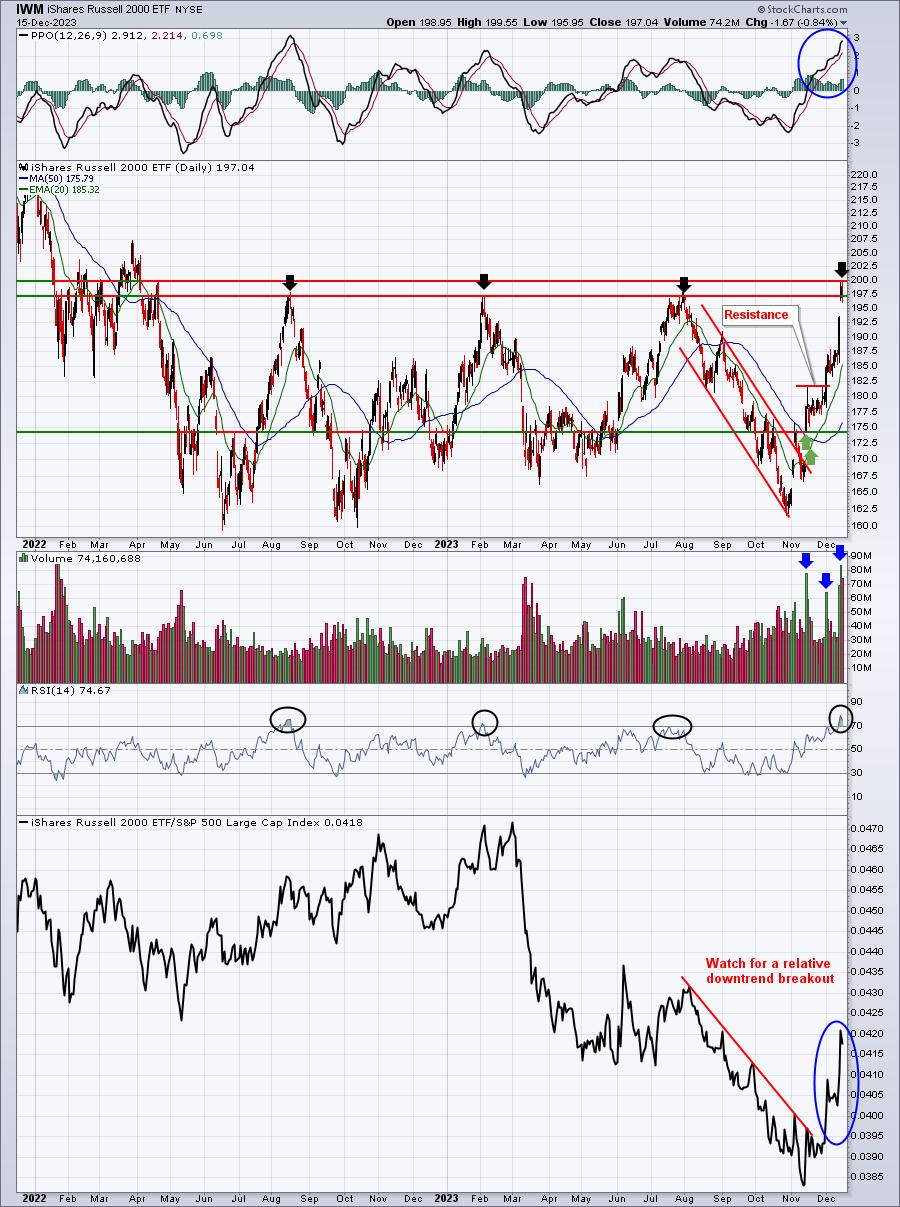
This was the chart I posted in the WMR on November 20, 2023. At that time, if you recall, I wanted to see the IWM break above 181.76 AND I wanted to see a breakout of the relative downtrend. Well, we've since seen both and the IWM subsequently soared to major resistance from 197.50-200.00. So now the IWM faces a major test of resistance and it's overbought. We MUST respect this resistance, but I absolutely believe we're going through it this time. To me, it's just a matter of whether we go through on Monday/Tuesday or wait until the very bullish December period that runs from December 21 through December 31.
Sectors
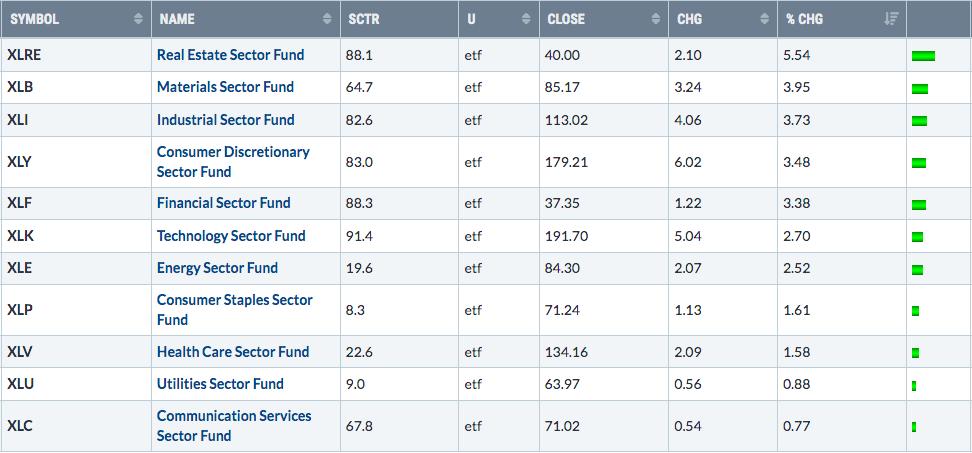
Real estate had the biggest weak of all and it is a defensive, or value-oriented, sector. Many of its component stocks pay nice dividends, but they're not considered growth stocks where their earnings explode and grow exponentially. Usually, their forward earnings and earnings growth can be fairly easily calculated or estimated and, using current interest rates, their valuations are fairly simple to determine as well. Therefore, aggressive traders don't typically look at real estate stocks, because they're not sexy enough. Furthermore, the XLRE is extremely overbought. Check this out:
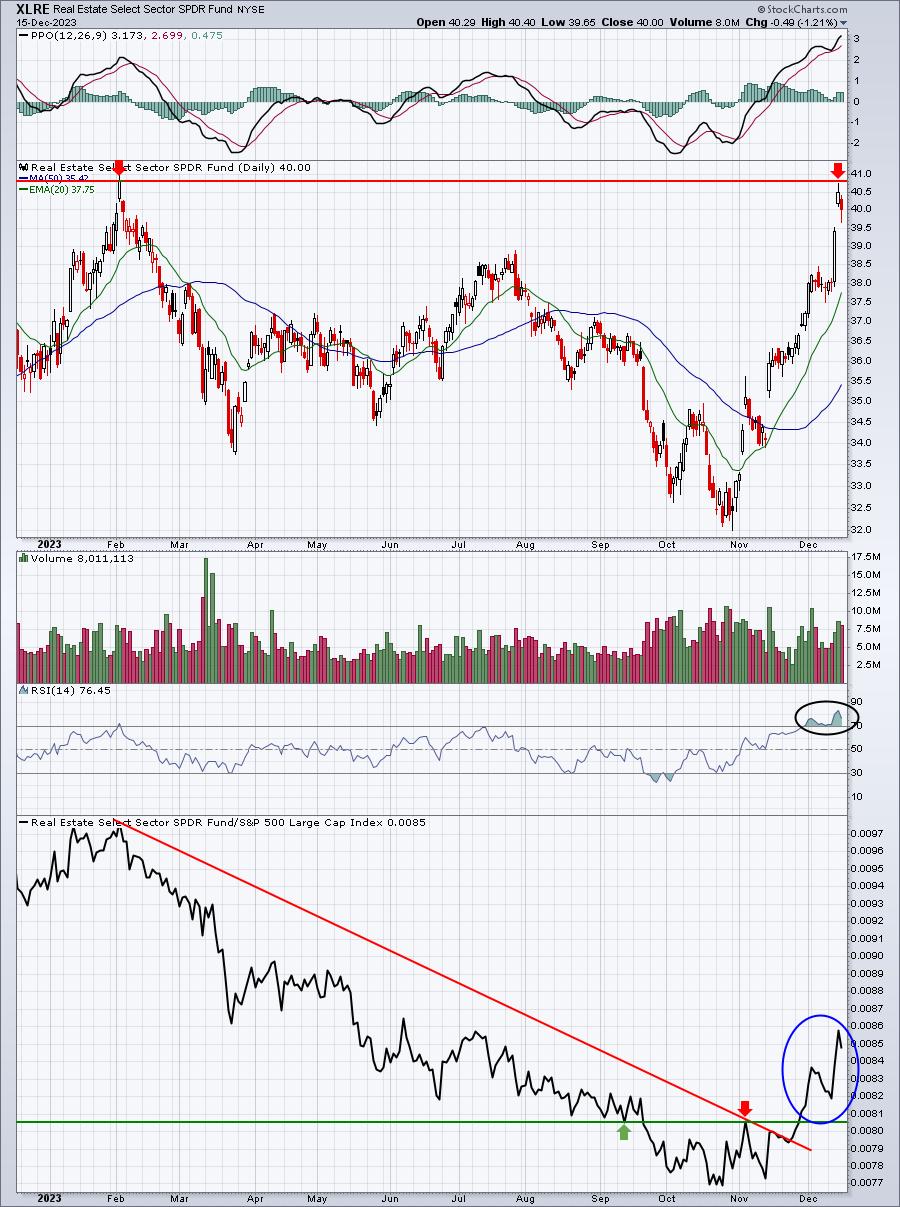
Here's my initial thought on the XLRE after one glance at this 1-year chart. Violently overbought and trading at resistance, but showing renewed relative strength. As a trader, would I buy it here? Probably not. I'd much rather see a pullback and buy closer to say the 20-day EMA.
But let's step back and look a long-term 20-year weekly chart and use PERSPECTIVE. This is essential, especially for long-term investors. Here's what the long-term chart looks like:
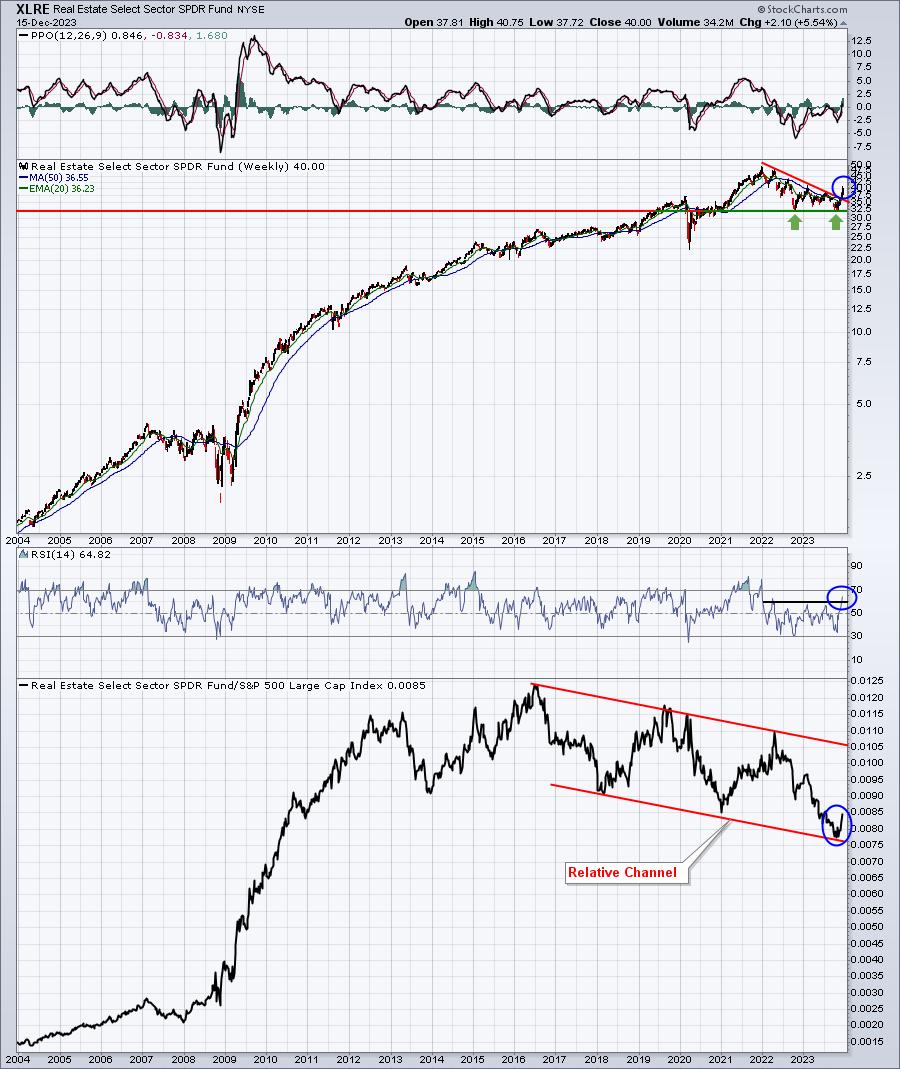
As I look at this LONG-TERM chart of the XLRE, I don't think "violently overbought" at all. I'm actually thinking the exact opposite. We're just turning up off a relative downtrend support line and the weekly RSI has finally moved back above 60, which suggests that we've moved from a downtrending sector to an uptrending one. While real estate may not be sexy enough for traders, I actually really like real estate for longer-term investors seeking income, because they now carry the added bonus of possibly significant capital appreciation as well.
Picking individual stocks might seem scary to some, so maybe think about just buying the XLRE. It yields 3.56% right now, not far from a 10-year treasury yield ($TNX), which is close to 3.90%, but the XLRE looks to me like it could be poised for a significant advance ahead. The XLRE is somewhat concentrated, however, with about 30% of it invested in 3 companies - PLD, AMT, and EQIX. I like all 3 long-term charts and EQIX is actually close to breaking to an all-time high.
Top 10 Industries Last Week
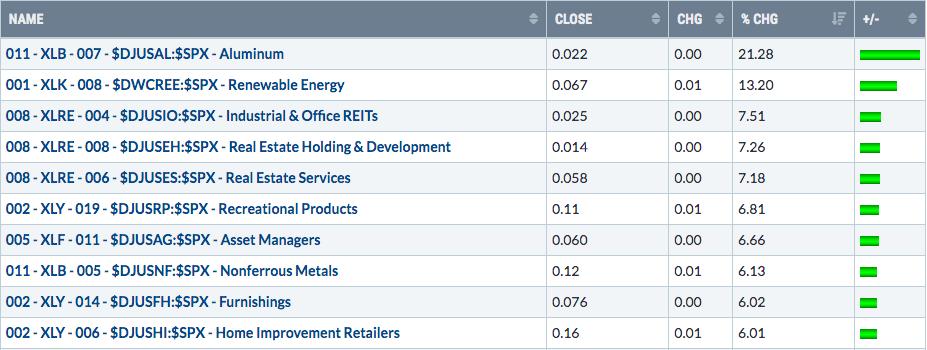
There may not be a more interesting industry group than renewable energy ($DWCREE). If you get involved with any of its component stocks, make sure you've fastened your seat belt and grabbed your crash helmet. It's likely going to be a roller coaster ride. But, if you're willing to take on LOTS of risk, this group see outstanding returns in the form of capital appreciation. This is another group where, if you use perspective, you might see tremendous value in entering NOW. Here's a 5-year weekly chart on the group, check this out:
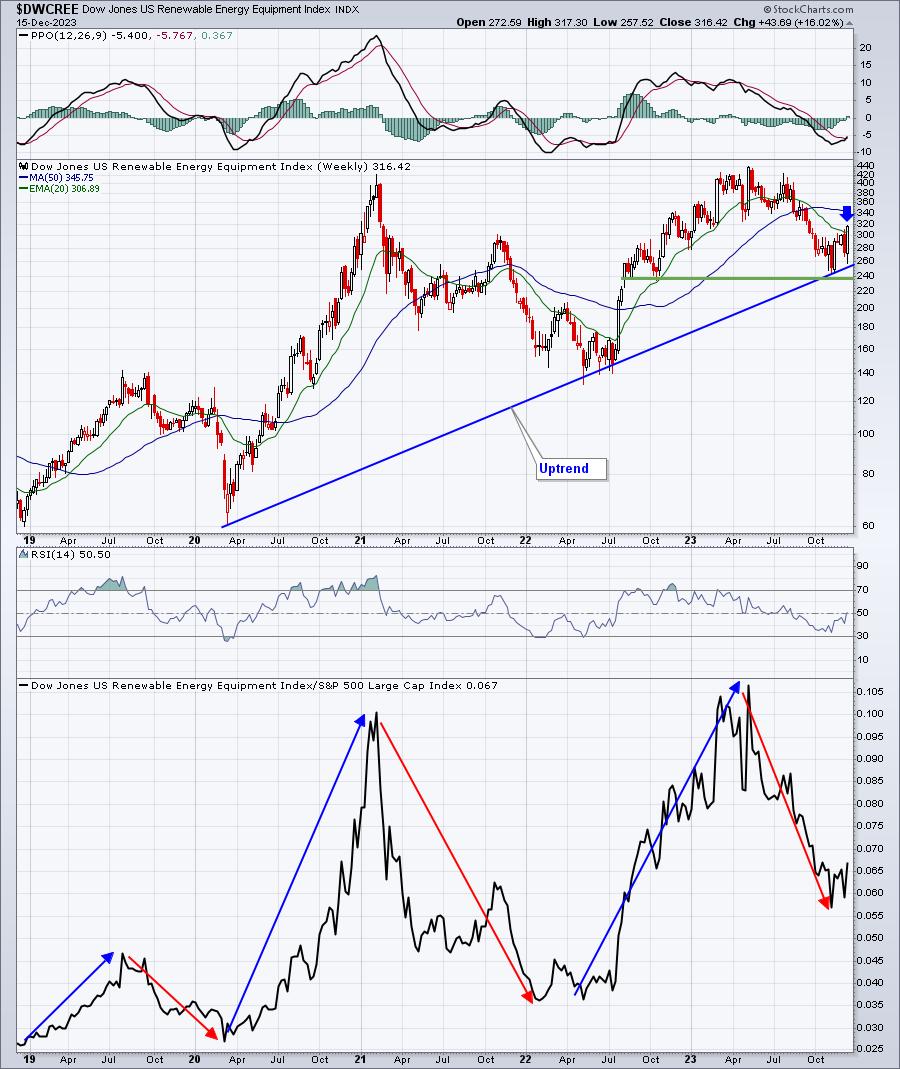
Look at that roller-coaster ride! Those with weak stomachs and risk intolerance need not apply. But being invested in renewable energy at the right time can absolute carry a portfolio to stardom. TAN is an ETF that tracks renewable energy stocks, but just keep in mind that more than 20% of TAN is invested in two stocks - FSLR and ENPH. Also, many names in this ETF are traded on foreign stock exchanges. I'm much more familiar with stocks on U.S. exchanges. I don't know if that's a concern for some of you, but I simply wanted to point it out. Diversifying into an ETF like TAN helps to eliminate, to some degree, specific stock risk. My luck would be to invest in the one loser in the group, while the somewhat-diversified ETF screams higher. I'm sure many of you can relate.
Bottom 10 Industries Last Week
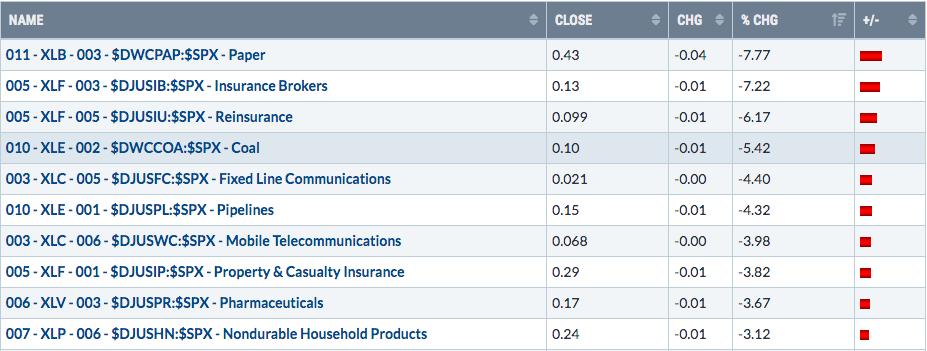
Of all the groups that struggled last week on a relative basis, I'm only a fan of one of them from a long-term perspective. It's insurance brokers ($DJUSIB). For me to be a fan, I need to see fairly consistent long-term relative strength. To illustrate, let me show you the DJUSIB as one I like and pharmas ($DJUSPR) as one I don't:
Insurance brokers:
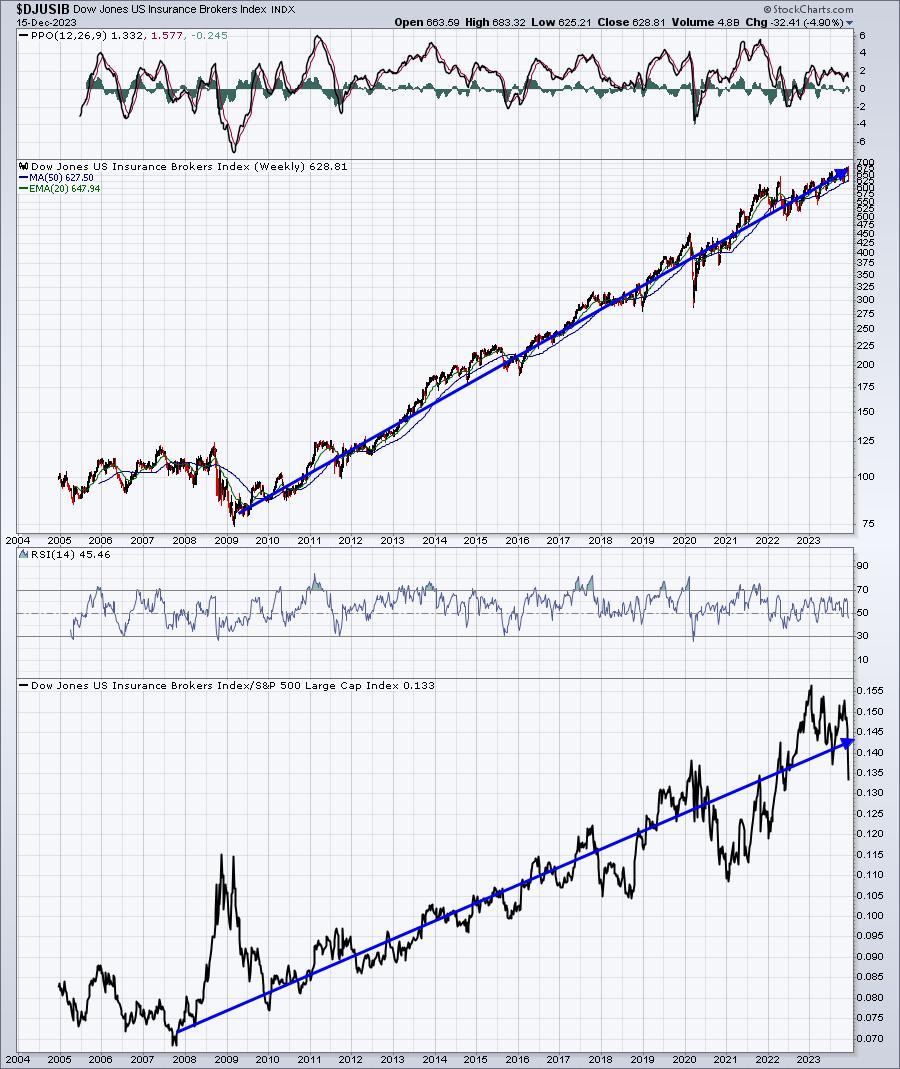
Insurance brokers ($DJUSIB) have a long history of trending higher not only on an absolute basis, but also on a relative basis. If you look closely, you'll see that the DJUSIB occasionally will see its weekly RSI dip into the 40s and even the 30s. Those typically represent GREAT entries into stocks within this group. We've seen a recent pullback in the DJUSIB and its weekly RSI has dipped into the 40s. It's probably time to at least take a look at the group and begin rummaging through the stocks, looking for solid long-term trades.
Pharmaceuticals:
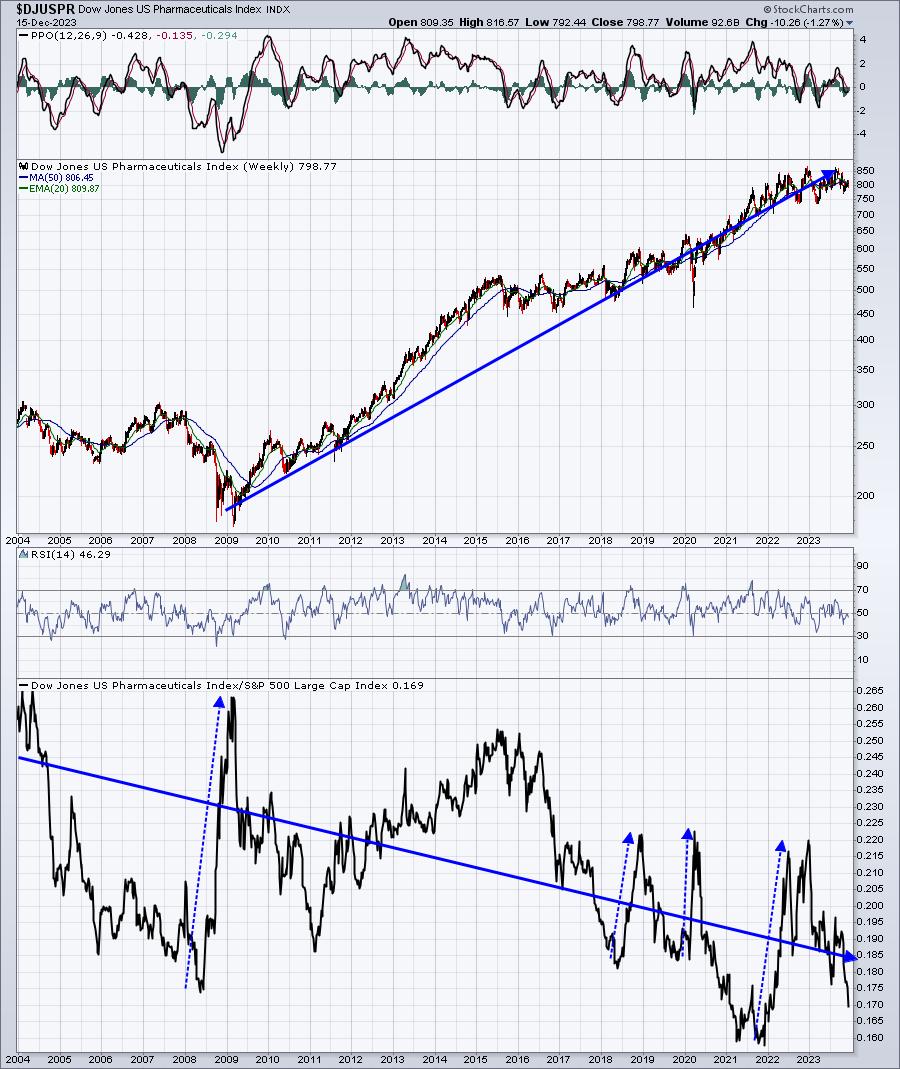
While the absolute price action here may appear to be strong like the DJUSIB, it's that bottom panel highlighting relative strength that tells me to stay away. The blue-dotted directional lines illustrate periods when pharmas outperformed during bear markets. I don't view this industry as much more than a safe place to hunker down during bearish market periods. Beyond that, I'd look mostly elsewhere. I do see the 2011-2015 period as one exception, but that's only 4 years out of 20 shown. Not enough for me.
Top 10 Stocks - S&P 500/NASDAQ 100
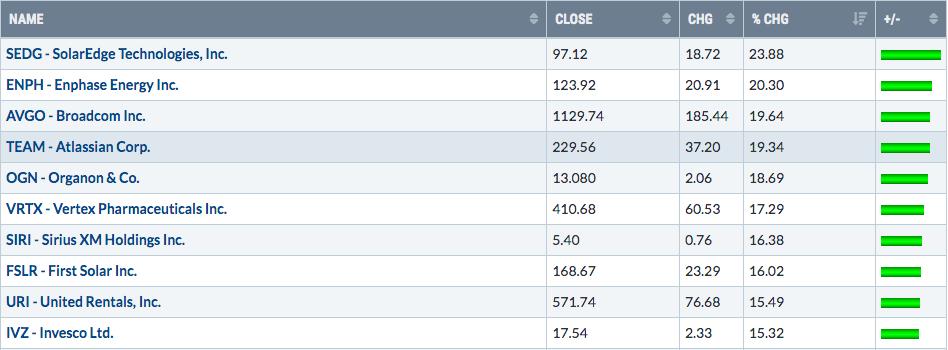
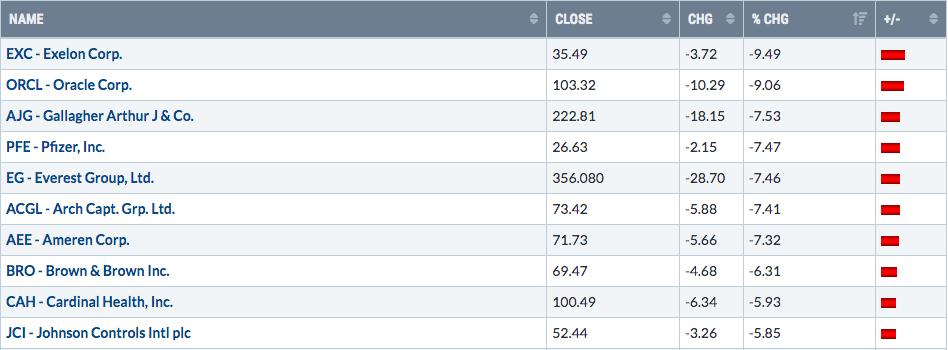
Bottom 10 Stocks - S&P 500/NASDAQ 100
Big Picture
Last week was another solid week and the S&P 500 jumped again, this time above 4700. It's rapidly approaching its all-time, a high that would finally confirm all the bullishness that I've discussed since my mid-June bullish market call. But waiting until now to invest would obviously have been a significant opportunity cost. Here's where we now stand in the current secular bull market advance:
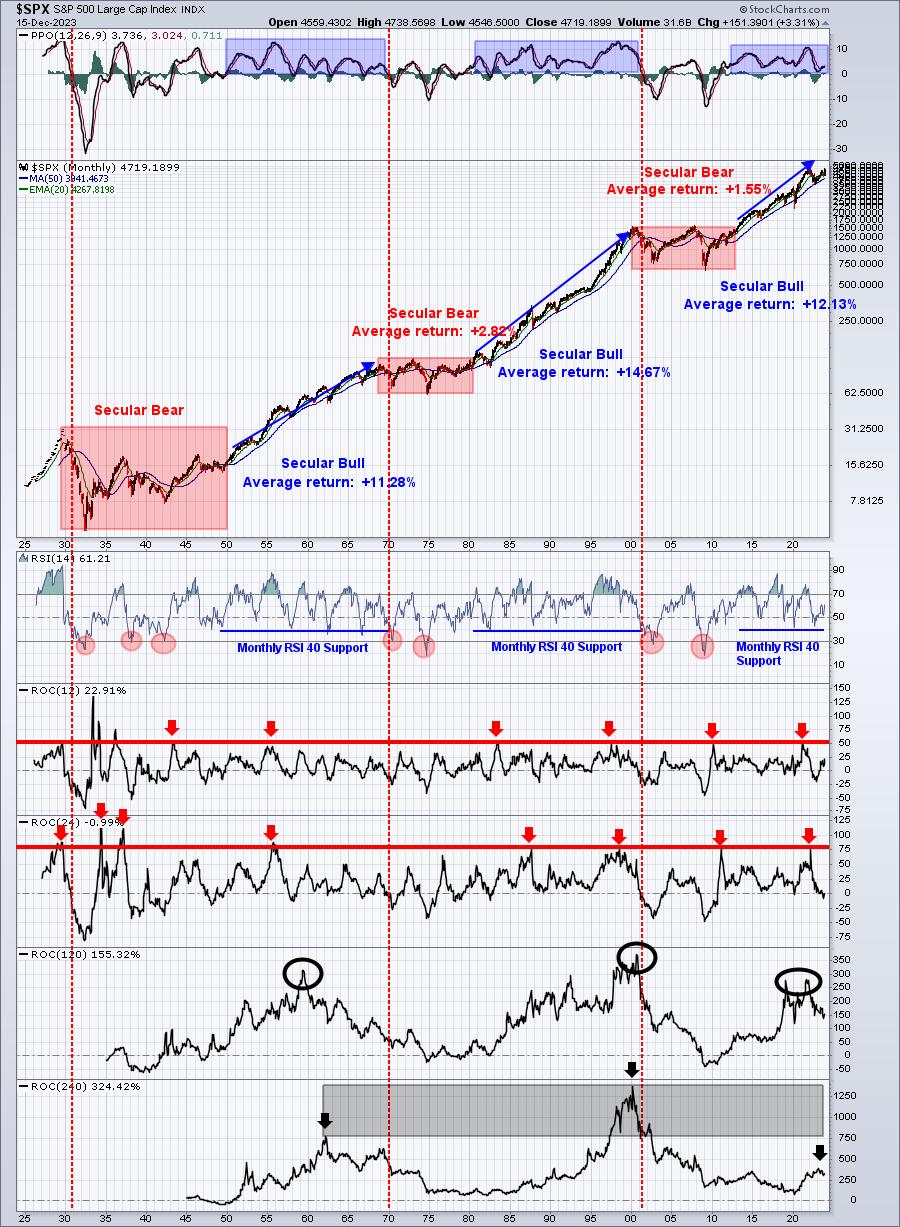
The monthly RSI moving back through 60 is a very big positive as is the monthly PPO continuing to rebound from just above its zero line. This secular bull market is FULL SPEED AHEAD.
Intermarket Relationships
QQQ vs. SPY
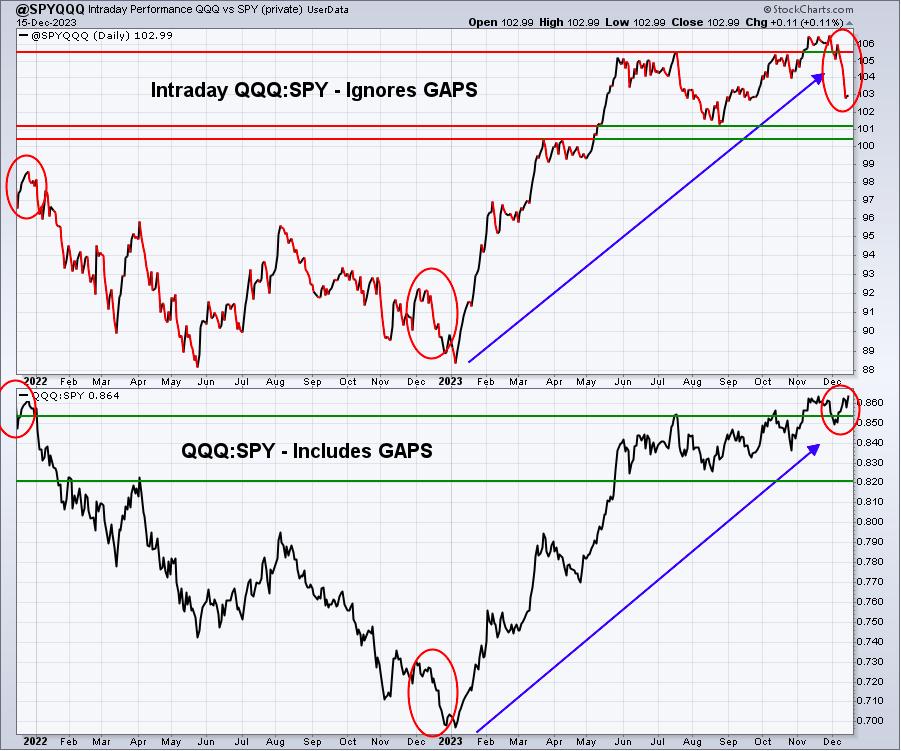
I believe this could be THE most significant chart from last week. Why? Well, if we include gaps in our ratio calculation, the QQQ:SPY has moved back to a 2023 relative high. But if we ignore gaps, we can see that the intraday-ONLY action shows the QQQ rapidly deteriorating vs. the SPY. I interpret this as the QQQ opening strong on a relative basis and maybe even during early morning action, but rotation significant skewing this relationship throughout the trading days last week. A possible explanation is that market makers are putting "lipstick on a pig" at the opening bell, attracting retail traders to chase some of the hottest stocks, while the biggest Wall Street firms are selling into it and buying other areas of the market. This theory makes a lot of sense, given the defensive- and value-oriented leadership that has begun to emerge. Ordinarily, I'd say this is potentially a big warning. But let's keep in mind that December nearly always favors value over growth. So it could simply be market makers seeing even better opportunities in stocks that haven't fared as well in 2023. Enter small caps (IWM).
But we saw perhaps the largest "divergence" in these two ratios - gaps included vs. gaps excluded - than at any time in the past two years. It's certainly a relationship that I'll be keeping a close eye on.
XLY:XLP
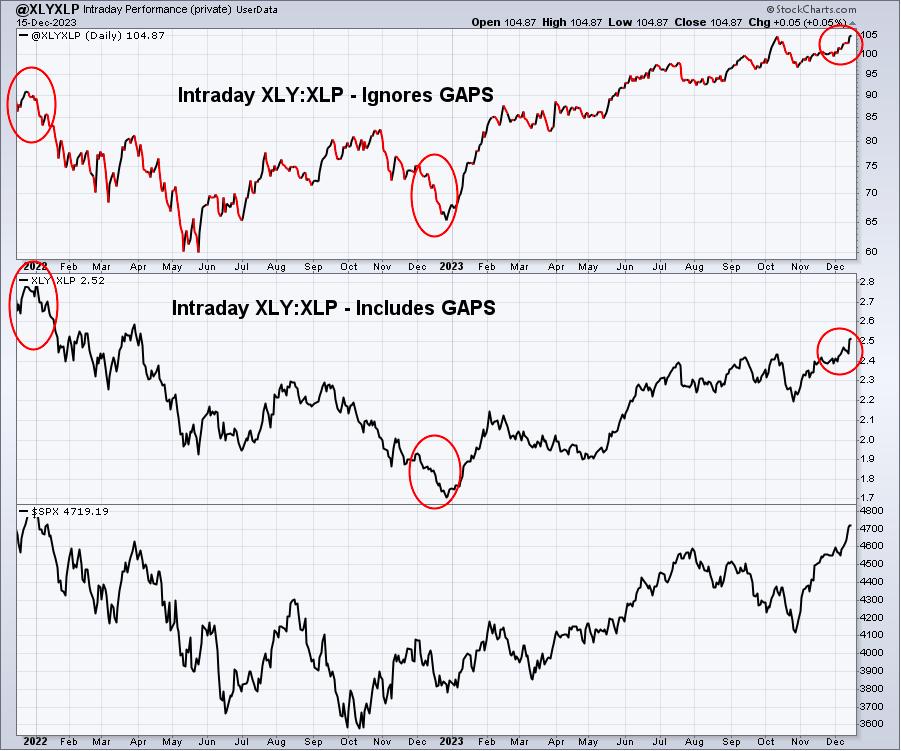
The XLY:XLP ratio is probably my favorite intermarket relationship and this one couldn't be much more bullish. The S&P 500 breaks out above a critical 4600 resistance level and the more aggressive consumer discretionary sector (XLY) pummels its consumer staples counterpart (XLP). And it didn't matter whether we included or excluded gaps. Money was flowing to the XLY. Bingo!
IWM:QQQ
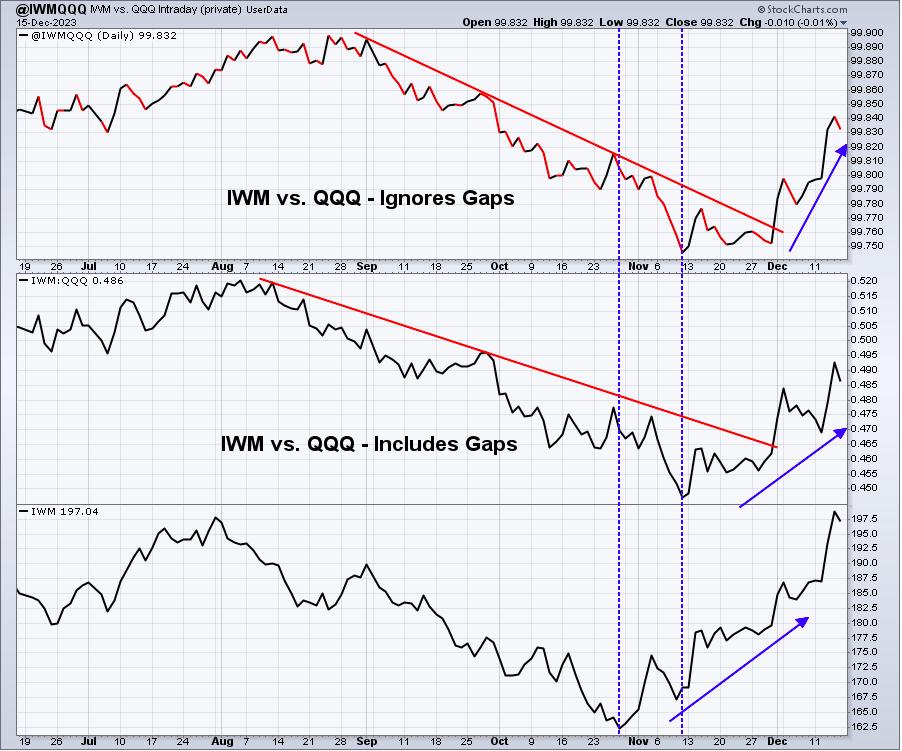
Here's the proof of what I was referring to earlier. The QQQ:SPY intraday relationship soured and the rotation from growth to value benefited small caps (IWM). Note that this new rotation towards small caps didn't take this IWM:QQQ ratio back to summer highs, but the current relative uptrend is undeniable - for now. The IWM is up against big price resistance in the 197.50-200.00 range. It will be very interesting to see how much more bullish rotation the IWM garners if it can clear this critical overhead resistance level.
Market Manipulation
If you've been an EarningsBeats.com member for the past two years, then you should recall all the manipulative market maker tactics that I pointed out in June 2022 in calling for a market bottom and reversal. I called the end of the cyclical bear market at that time. While we did end up going slightly lower in October 2022 after the Fed's infamous "more pain ahead" speech from Jackson Hole, none of my other signals changed, so I accordingly referred to that low as Bottom 2.0. It was a second chance for the bears to shed their coats and turn bullish. Few did, which isn't surprising. Bears tend to be extremely pessimistic and use confirmation bias to an extreme. When one bearish signal is no longer valid, they'll move on to Excuse #2. Then #3 and so on....
Anyhow, if you don't recall the QQQ chart where I was showing all the manipulation that took place and how I broke the price action into bear market phases, here's a refresher:
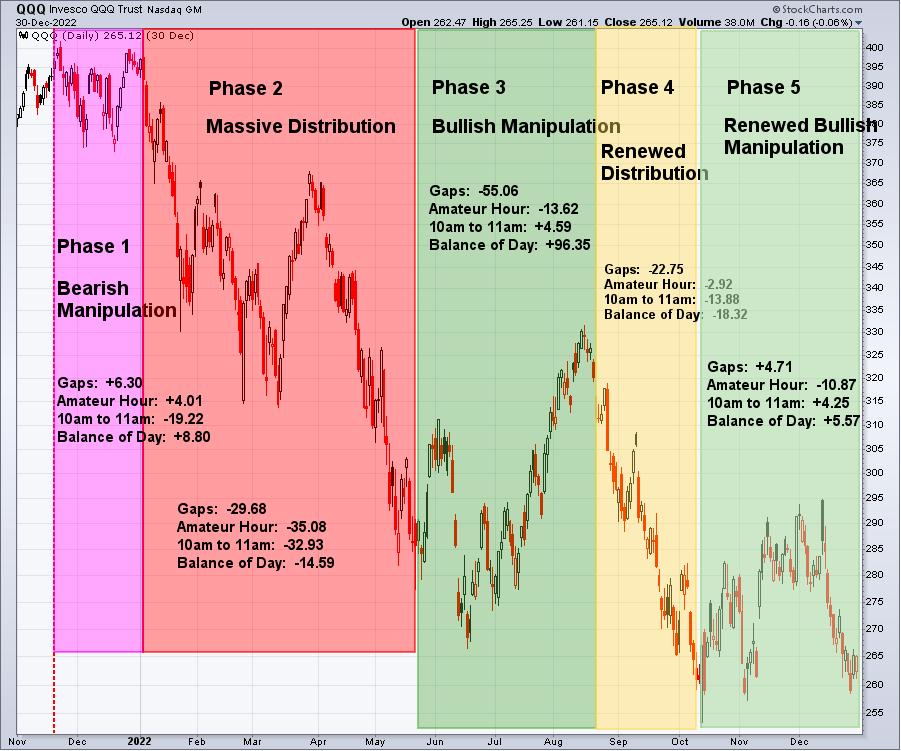
During Phase 1, market makers were gapping stocks higher and they added further gains by 10am, which I like to refer to as "Amateur Hour". But from 11am on, we saw deterioration in the QQQ as the big Wall Street firms began selling. If you recall, December 2021 was the month when consumer staples (XLP) gained 10%, while consumer discretionary was FLAT. That signaled MASSIVE rotation away from growth-oriented stocks and into value-oriented stocks as the QQQ flirted with fresh all-time highs (the S&P 500 actually made its all-time high on January 4, 2022).
Phase 2 was pure distribution. We saw cumulative gap downs and selling throughout every part of the day.
Phase 3 was extremely bullish and was characterized by tremendous manipulation. We continued to see big gaps to the downside and early morning selling as retail traders chased those lower early prices. But the big Wall Street firms were happily buying the remainder of the trading sessions. That much was very clear.
Phase 4 was initialized by the Fed Chair's Jackson Hole speech, which I do not believe Wall Street was expecting. Personally, I don't think the Fed has any business providing their opinion about the stock market. Fed Chief Greenspan turned out to have no clue when he made his infamous "irrational exuberance" speech in 1996, just before one of the largest stock market advances in history. And quite honestly, Fed Chief Powell didn't fare a whole lot better. His "more pain ahead" lasted 2-3 months and the S&P barely fell beneath the June 2022 low when it finally bottomed in October 2022.
During Phase 5, we saw choppy action, but the net was morning weakness, followed by afternoon strength. That preceded the huge rally to begin 2023.
This manipulation certainly wasn't our only signal in calling for a solid market in 2023, but it certainly added to my bullishness.
Trade Setup
Since beginning this Weekly Market Report in early September, I've discussed the long-term trade candidates below that I really like. Generally, these stocks have excellent long-term track records. Only in very specific cases (exceptions) would I consider a long-term entry into a stock that has a poor or limited long-term track record. Check these out:
- JPM
- BA
- FFIV
- UPWK (exception, limited history) - a heavy volume push through 16 would be very bullish here
- MA
- GS - breaking trendline resistance near 350-355 would be very bullish
- FDX
- AAPL
- CHRW
- JBHT
- STX
- HSY
This week, I'm adding another Dow Jones component stock - Walt Disney (DIS). It's certainly been beaten up, but DIS has a solid long-term track record and I believe buying now after 3 years of selling represents a nice long-term addition to our portfolio. Here's the long-term chart of DIS:
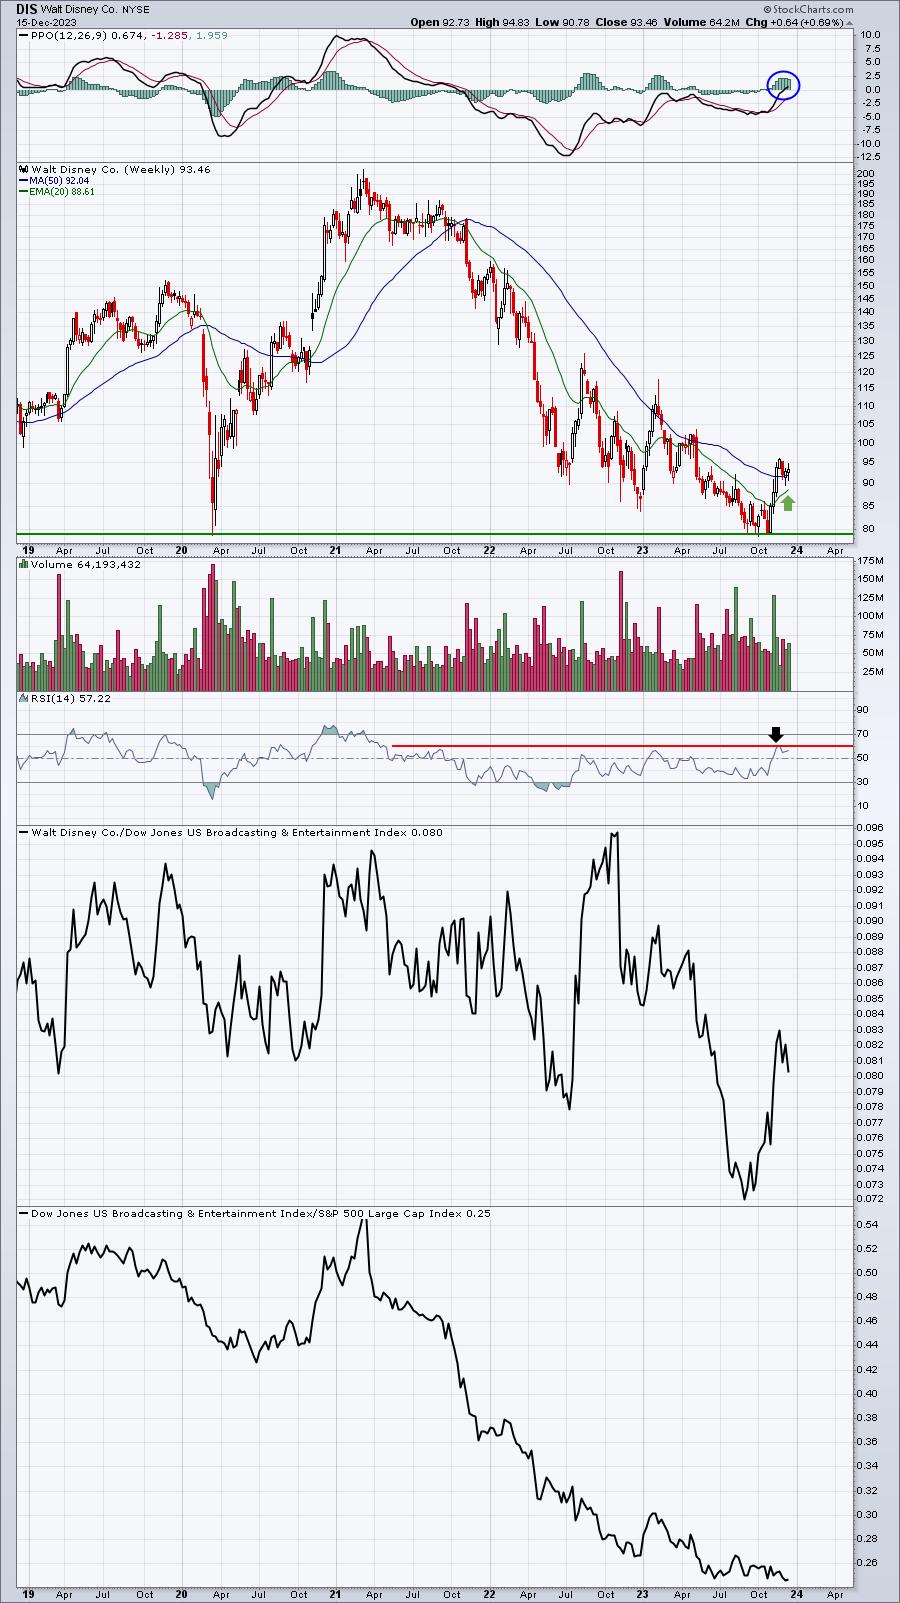
We've seen stocks like Boeing (BA), which has struggled ever since the beginning of the pandemic, begin to rally strongly and it's quite possible that DIS is just starting to do the same. If we step back and take a VERY long-term look at DIS over the past half century, we'll see that a trendline was tested near the 80 level:
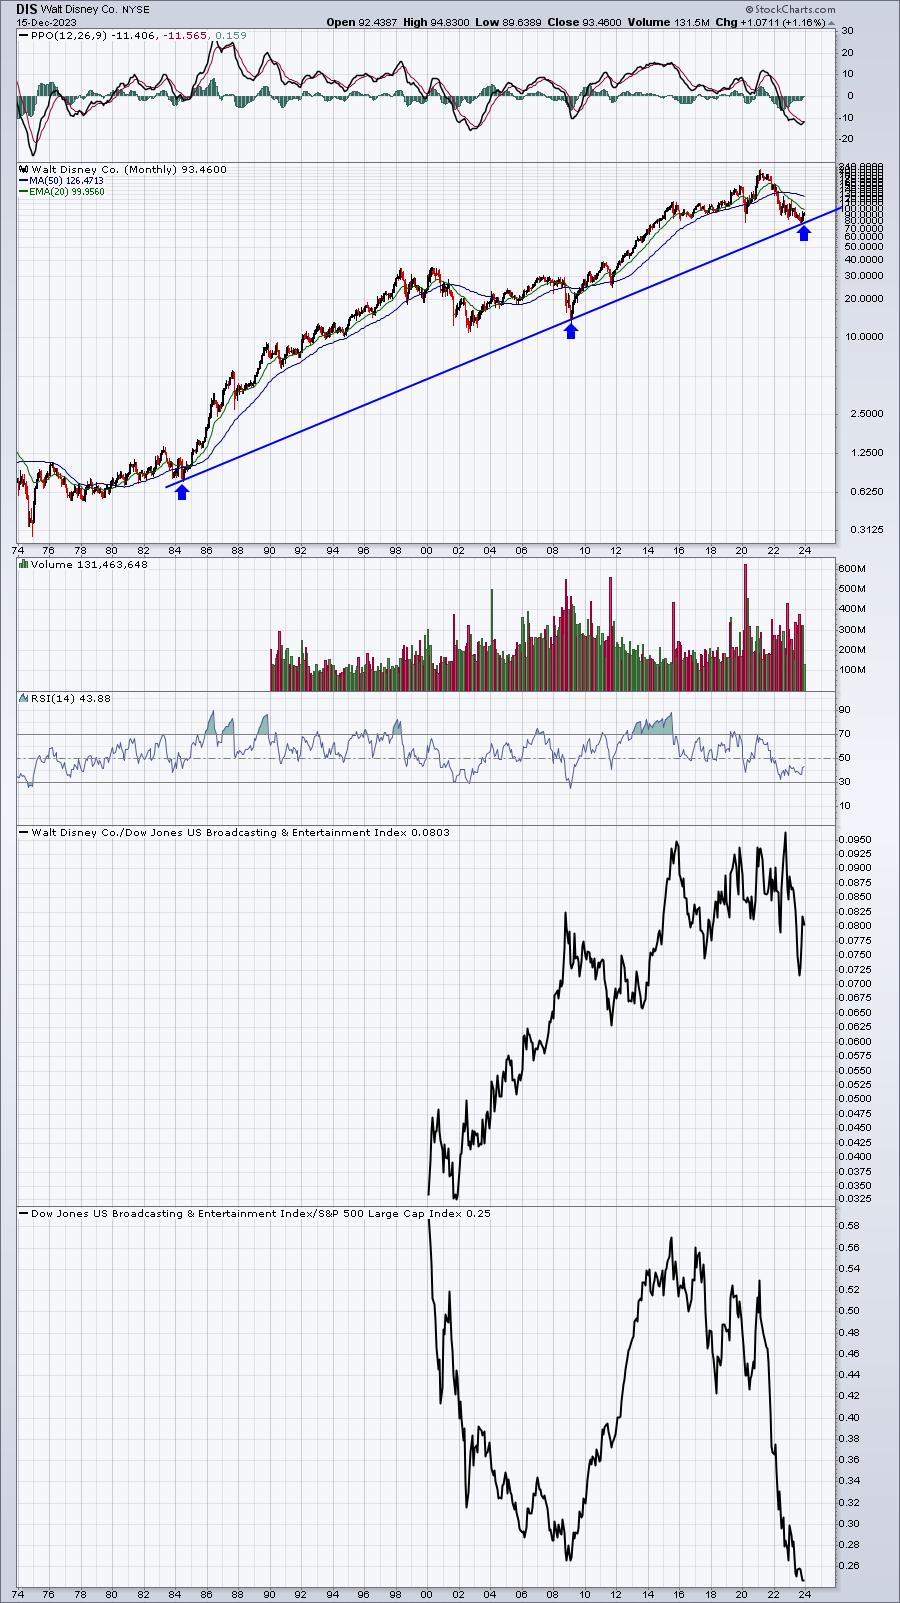
We'll take what we believe is a solid risk and enter DIS here just above 93.
Looking Ahead
Upcoming Earnings:
The following earnings reports (market cap in parenthesis) are, in my opinion, at least relatively significant and worth watching. This is NOT a list of ALL companies reporting this week, so please be sure to check for earnings of any companies that you own or add:
- Monday: HEI ($25 billion)
- Tuesday: ACN ($215 billion), FDX ($70 billion)
- Wednesday: MU ($91 billion), GIS ($39 billion)
- Thursday: NKE ($184 billion), CTAS ($57 billion), PAYX ($46 billion)
- Friday: None
Key Economic Reports:
- Monday: None
- Tuesday: November housing starts and building permits
- Wednesday: November existing home sales
- Thursday: Initial jobless claims, Q3 GDP (final), December Philadelphia Fed manufacturing survey, November leading indicators
- Friday: November durable goods, November personal income/spending, November PCE/Core PCE, November new home sales, December consumer sentiment
Historical Data
I'm a true stock market historian. I am absolutely PASSIONATE about studying stock market history to provide us more clues about likely stock market direction and potential sectors/industries/stocks to trade. While I don't use history as a primary indicator, I'm always very aware of it as a secondary indicator. I love it when history lines up with my technical signals, providing me much more confidence to make particular trades.
Each week, I'll provide you the average annualized returns for each calendar day and by index. Here are the historical numbers for this week:
S&P 500
- December 18: +64.64%
- December 19: -7.10%
- December 20: -31.06%
- December 21: +71.54%
- December 22: +31.82%
NASDAQ
- December 18: +50.51%
- December 19: -58.60%
- December 20: -42.19%
- December 21: +109.28%
- December 22: +87.56%
Russell 2000
- December 18: +39.93%
- December 19: -67.63%
- December 20: +42.45%
- December 21: +150.69%
- December 22: +67.49%
The S&P 500 data dates back to 1950, while the NASDAQ and Russell 2000 information date back to 1971 and 1987, respectively.
We are now in the most bullish period of the calendar year. The close on October 27th through the close on January 18th is THE ABSOLUTE BEST TIME OF THE YEAR FOR U.S. EQUITIES - HISTORICALLY SPEAKING. Last week had a history of being the most bearish week of December, but our major indices mostly charged higher. We have a very bullish period approaching as the December 21-31 period has produced annualized returns for our major indices as follows:
- S&P 500 (since 1950): +40.21%
- NASDAQ (since 1971): +61.72%
- Russell 2000 (since 1987): +72.75%
Final Thoughts
It's always so difficult to bet against a secular bull market advance, which is why I believe shorting in a bull market is a losing proposition. Last week was really a perfect example as negative divergences, overbought conditions, historical bearishness, two inflation reports, a Fed meeting and policy decision, options expiration, etc., did little to slow down this raging bull. Here's what I'll be considering in the week ahead:
- The current uptrend. Can anything stop it? The Dow Jones and NASDAQ have broken to all-time highs. The S&P 500 is nearing one and the Russell 2000 (IWM) is at at MAJOR resistance level from 197.50-200.00.
- Does rotation to value-oriented stocks continue? This is the time of the year when it typically happens and that INTRADAY chart of the QQQ:SPY showed massive intraday rotation to value last week.
- Does the XLY:XLP sustainability ratio power forward on any further S&P 500 strength? If so, don't bet against further gains ahead, despite the overbought conditions.
- There's a heavy slate of economic reports this week, especially in the housing area. What effect do these reports have on the 10-year treasury yield ($TNX), which tumbled last week.
- We're heading into the second half of December, which historically has been the better half BY FAR
- The negative divergence on the S&P 500 was eliminated by the strength last week, but daily divergences remain negative on the NASDAQ, semiconductors ($DJUSSC), and technology (XLK). I'm still watching to see if a reversing candle prints as that could trigger at least some short-term selling and/or consolidation in the week ahead.
Feedback
If you'd like to share your thoughts on our Weekly Market Report, positive or negative, you can reach us at "[email protected]".
Happy trading!
Tom