
EB Weekly Market Report - Monday, January 8, 2024
Note
First, Happy New Year to anyone I've missed the past week or so! I'm back with the first Weekly Market Report of 2024. I literally just discussed at MarketVision 2024 many of the topics that I address in Weekly Market Reports, so this one might be a bit briefer than normal.
MarketVision 2024 Annual Membership Special
Also, remember that our MarketVision 2024 "special" remains in effect until midnight tonight! For trial members and monthly members, this special is designed to save you money NOW! And any annual member whose membership expires in the next 3-4 months should consider this special as well. For more information and to extend your EB membership at the lowest possible price currently available, CLICK HERE! I also want trial members to know that you will NOT lose any of your free trial period by subscribing to our annual service, which includes a one month bonus, by the way. So 13 months will be added to the date that your trial is set to expire. It's a great deal, but it comes to an end in just under 10 hours!
ChartLists Updated
Over the weekend, I began getting caught up on ChartLists. Below are 3 ChartLists that I updated:
- Strong Earnings (SECL)
- Strong Future Earnings (SFECL)
- Short Squeeze (SSCL)
These ChartLists should be updated on our website later today.
Our other ChartLists will be updated over the next couple days and I'll keep you posted on those in the Daily Market Reports.
Weekly Market Recap
Major Indices
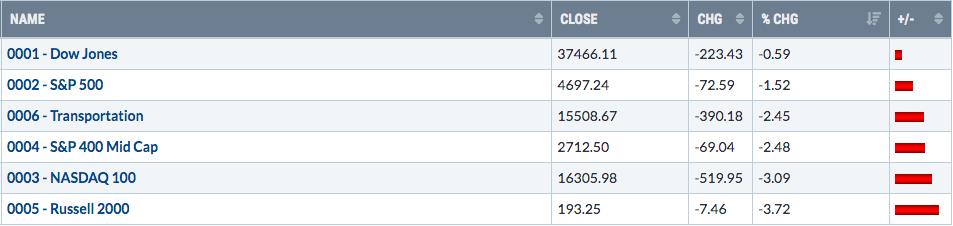
The U.S. stock market finished 2023 a little bit weak and that weakness was felt to open 2024 as well. That selling was felt more distinctly in certain areas more than others, however. The Dow Jones held up best, while the relative selling in the small cap Russell 2000 (IWM) was very clear. Small caps had a strong finish to 2023 and much of its selling was actually at the opening bell. So, based on my approach to the market, I really didn't see much in the way of distribution from the opening bell to the closing bell. But we were down nonetheless and we saw a 20-day EMA test as follows:
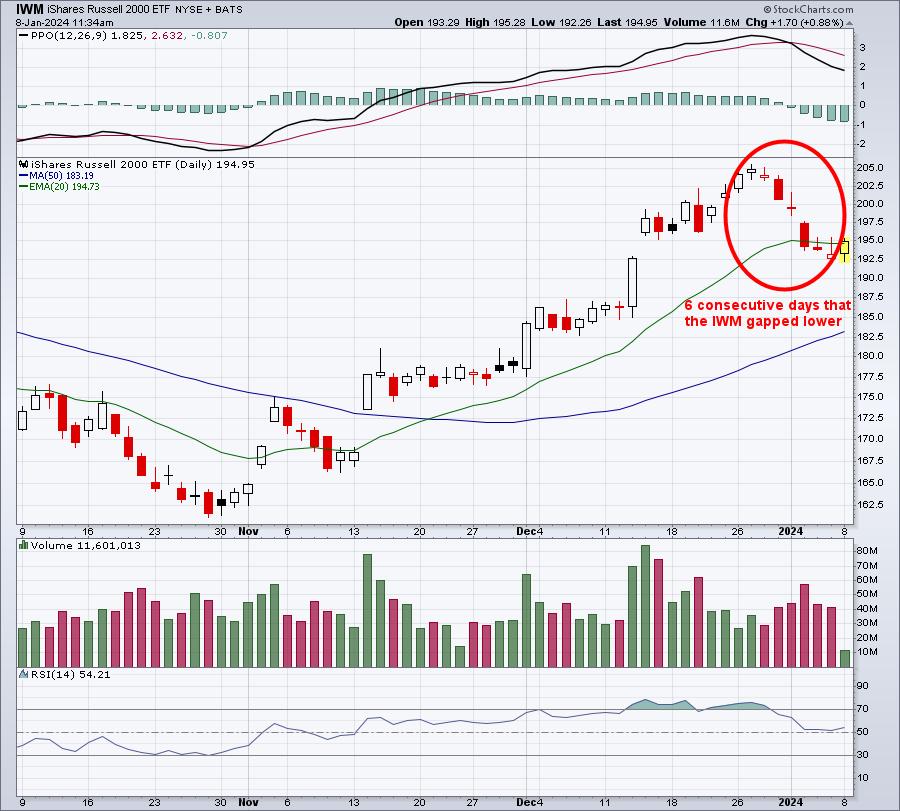
Since that recent closing top on December 27th, the IWM fell more than 11 bucks. However, opening gaps accounted for more than 50% of the pullback. When I see that kind of activity, I think market maker "manipulation". Gapping prices lower eventually triggers intraday selling, which we saw some of last week. That retail selling is typically absorbed by much bigger pockets. So far, gap support at 192.62 from December 13th is holding. To the upside, I'd like to see a couple closes above the 20-day EMA that could kickstart another rally.
Sectors
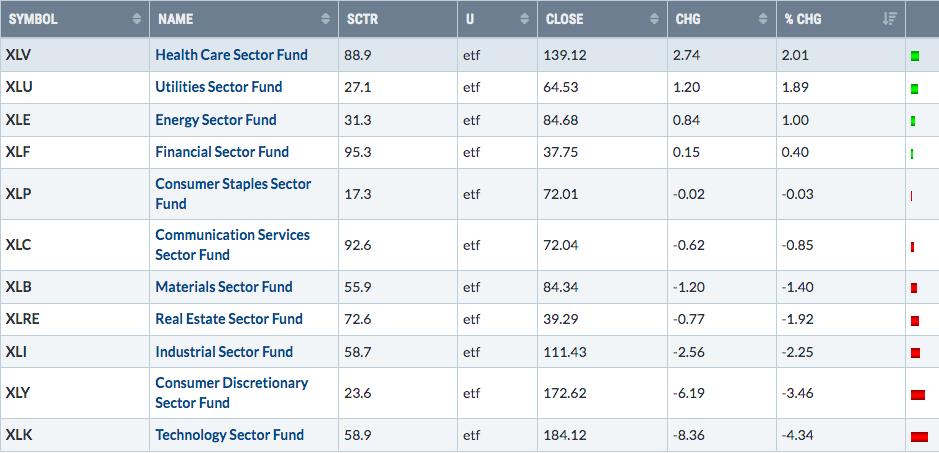
There is no doubt that there's been a rotation from growth to value recently and the above weekly sector summary underscores this fact. I believe we'll see a lot of this type of rotation in 2024, not just a brief period. But we'll keep an eye on it for further long-term signals.
The XLK is bouncing today, but the daily negative divergence may keep this very influential sector in a state of flux for a period of time:
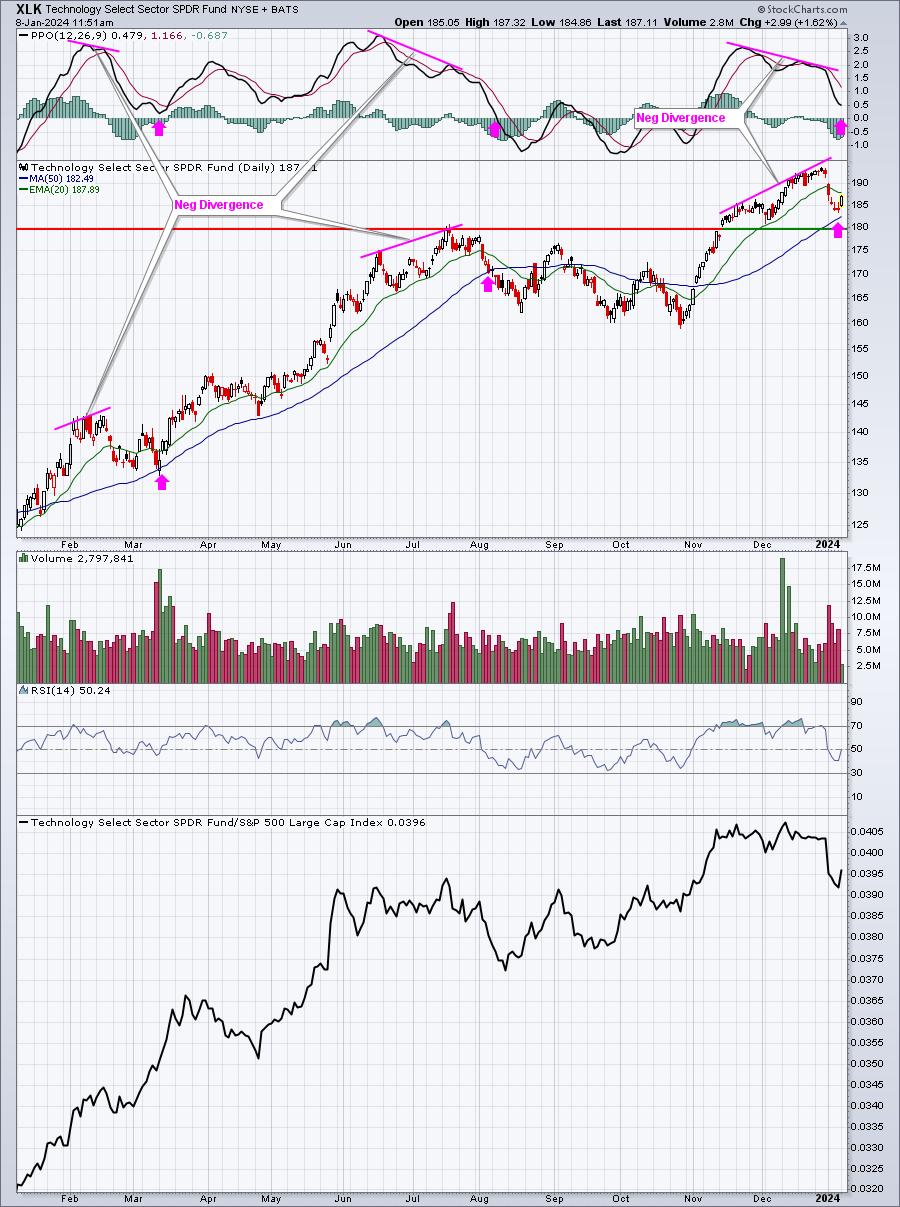
The prior negative divergences illustrate how we might expect this to play out. Sometimes we see a simple pullback to test the PPO centerline and/or 50-day SMA (pink arrows). Other times, the short-term weakness morphs longer as it did from July to October (correction). I'm expecting more of the 50-day SMA test than a drawn out selling event, but either is possible.
Top 10 Industries Last Week
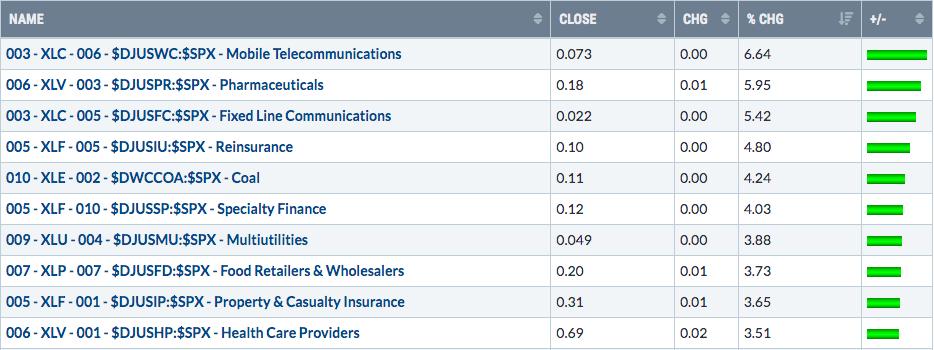
Specialty finance ($DJUSSP) is an industry group within financials (XLF) that I like in 2024. I believe we're going to have tailwinds much of 2024 supporting many areas within the XLF and the DJUSSP is one of those. Since a big run into July 2023, the DJUSSP has consolidated, but watch for a breakout as it could trigger a very strong advance ahead:
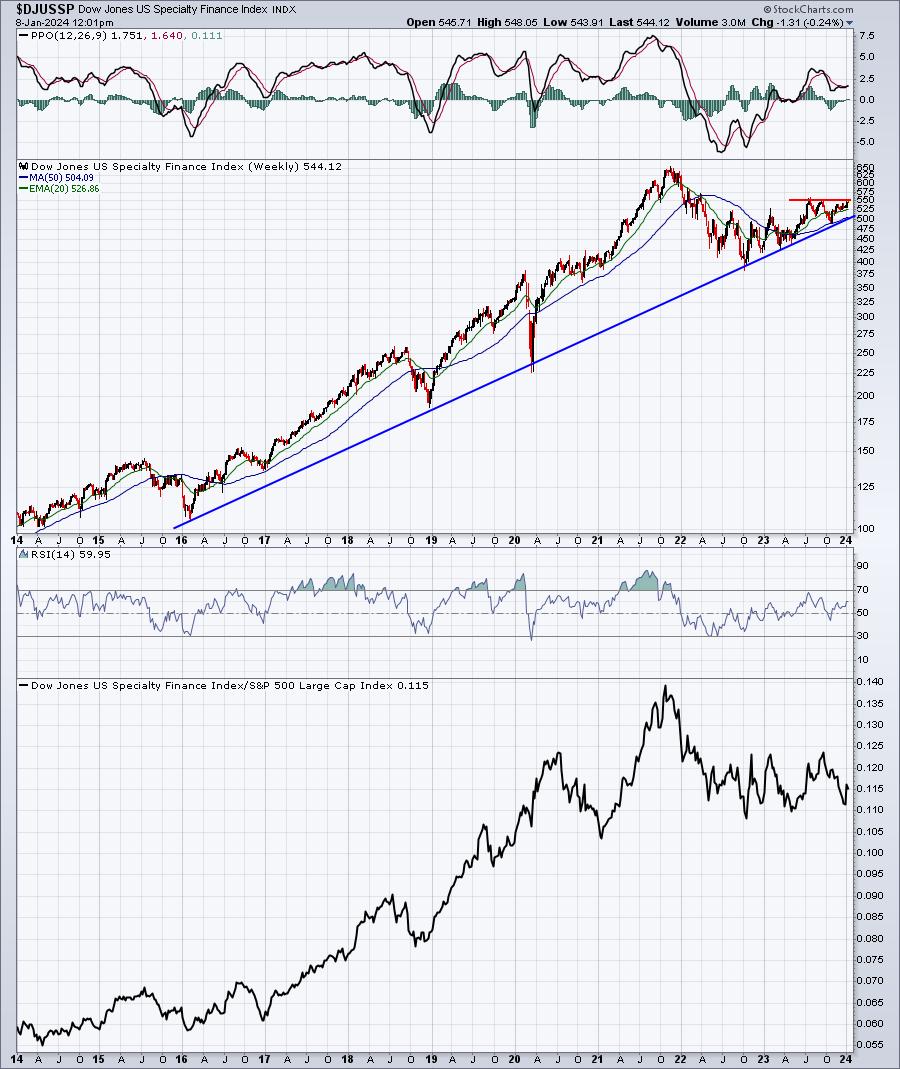
This group has a very strong long-term track record and a breakout of six months' consolidation would be a solid bullish signal for 2024.
Bottom 10 Industries Last Week
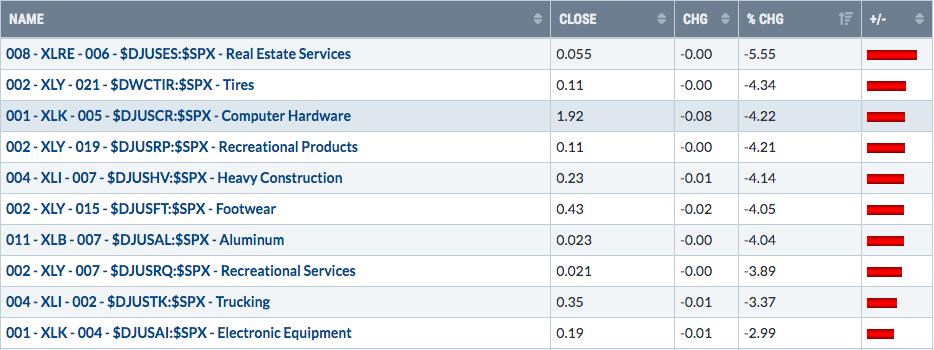
Recreational products ($DJUSRP) had a rough week, but it came after a huge rally over the past two months. Also, the selling carried the DJUSRP down into a gap support zone that appears to be holding:
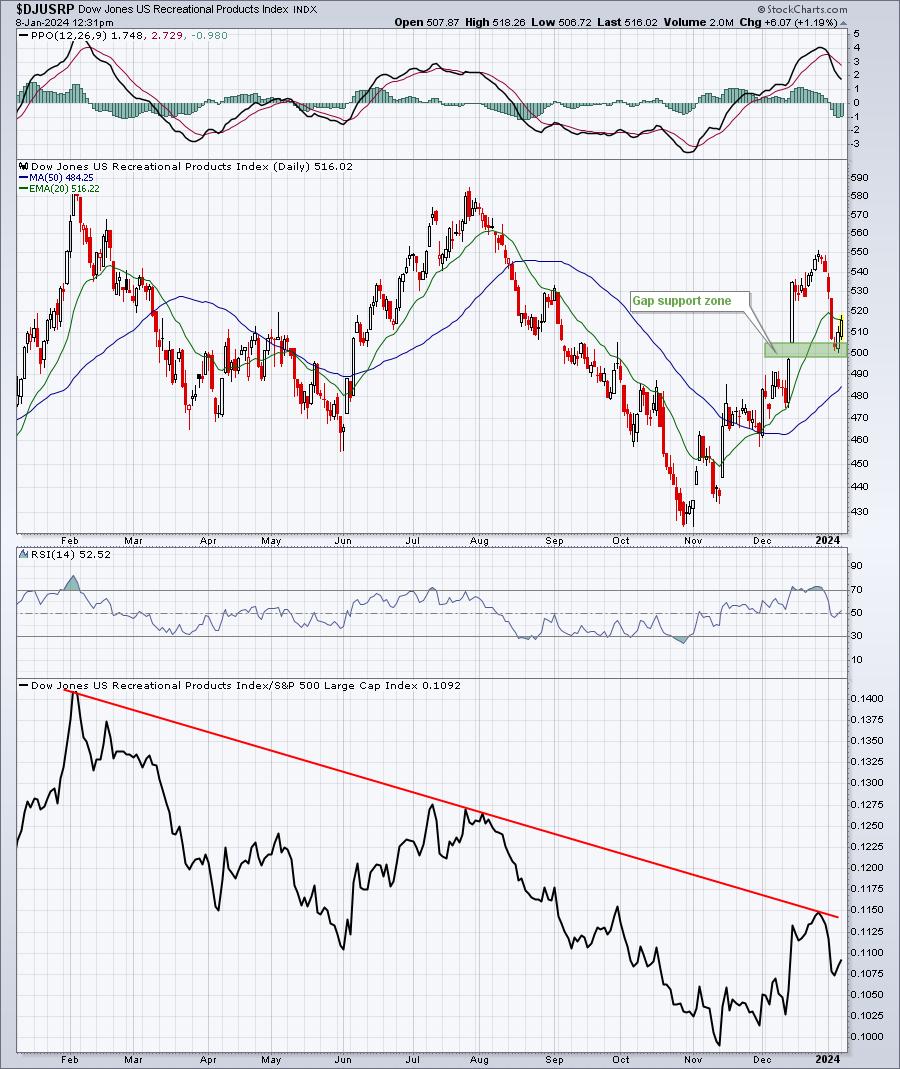
I'm watching this chart to see if the DJUSRP can clear its RELATIVE downtrend line. Absolute price action has turned more bullish, but we don't really want to focus too much on the group until it confirms its longer-term relative downtrend has been broken.
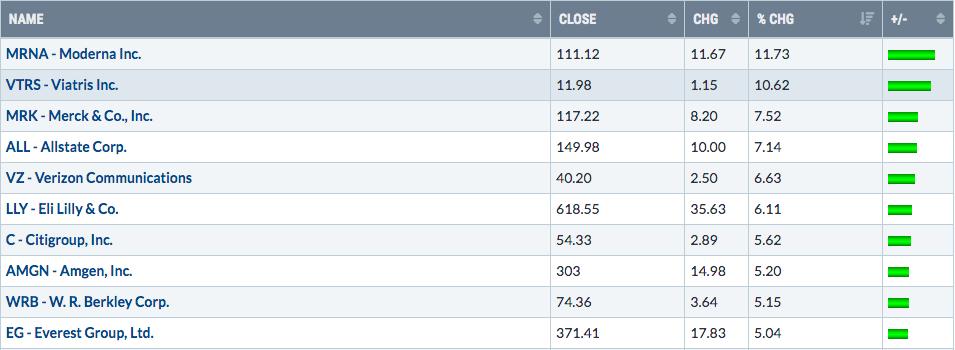
Top 10 Stocks - S&P 500/NASDAQ 100
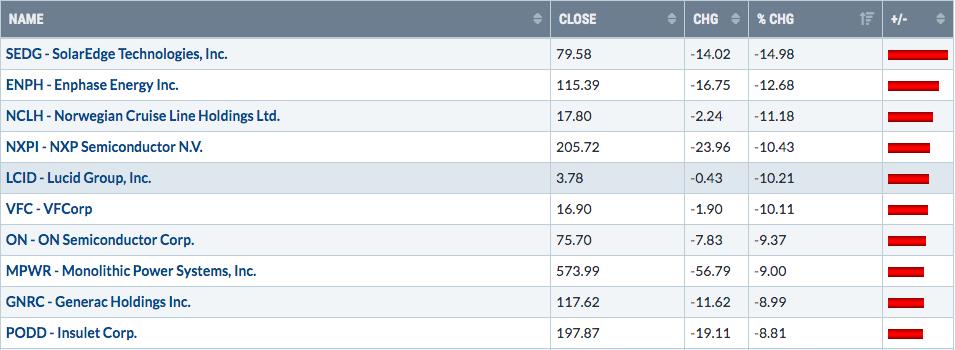
Bottom 10 Stocks - S&P 500/NASDAQ 100
Big Picture
After approaching all-time highs on the S&P 500 to close out 2023, we've seen some weakness to open 2024. But these two short-term observations do nothing for the long-term chart, where I see a continuing secular bull market:
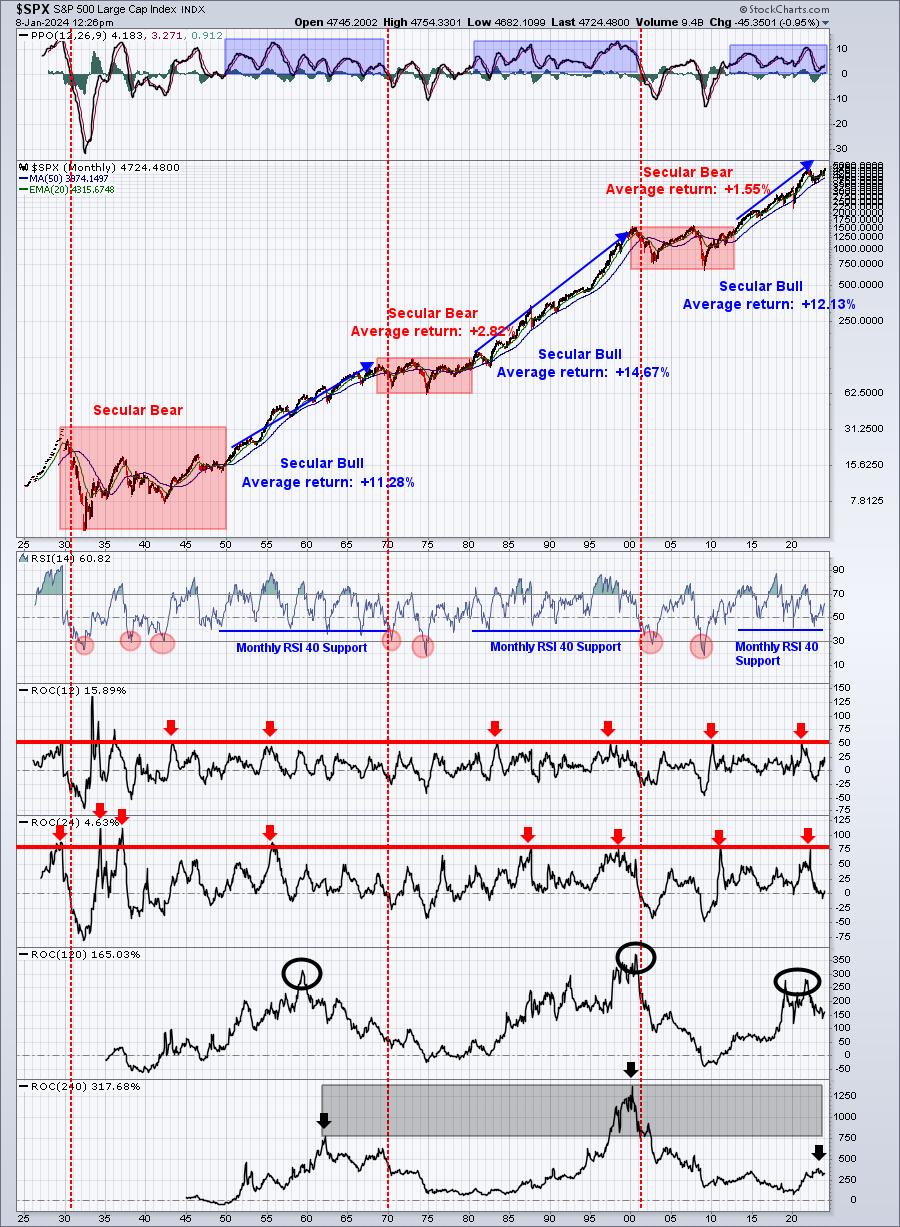
The monthly RSI moving back through 60 is a very big positive as is the monthly PPO continuing to rebound from just above its zero line. This secular bull market is FULL SPEED AHEAD.
Long-Term Divergences
One big picture consideration that I always consider are negative divergences on the weekly and monthly charts. They give us long-term clues that are important to at least be aware of. Here are how the weekly divergences look like right now on our key indices:
Dow Jones ($INDU):
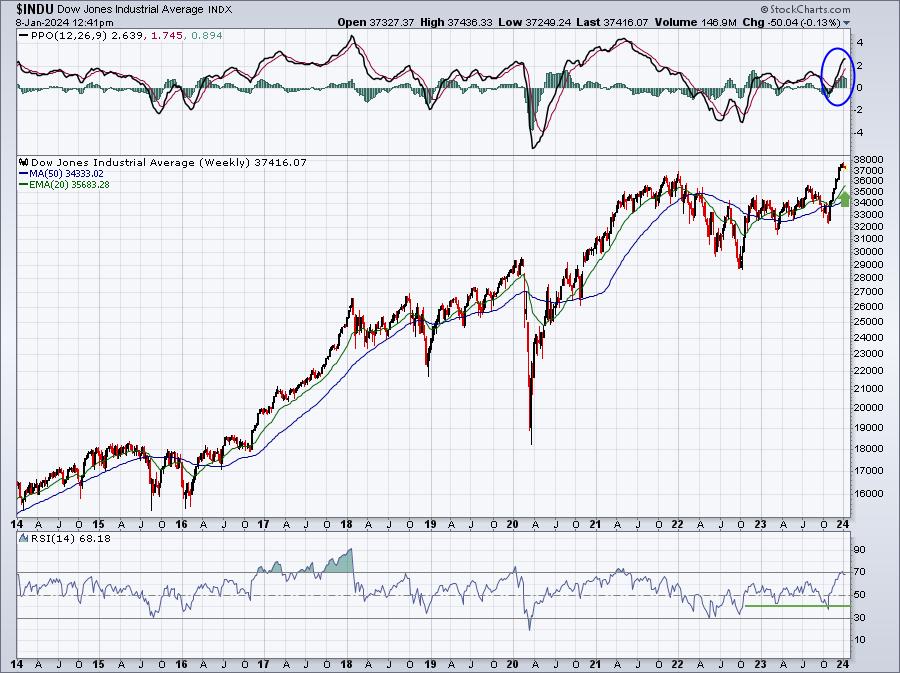
I see strength and accelerating momentum. We just reached an overbought level, though history tells us that overbought can remain overbought during secular bull market advances. Check out late-2017 for a perfect example. I don't bet against secular bull market advances.
S&P 500 ($SPX):
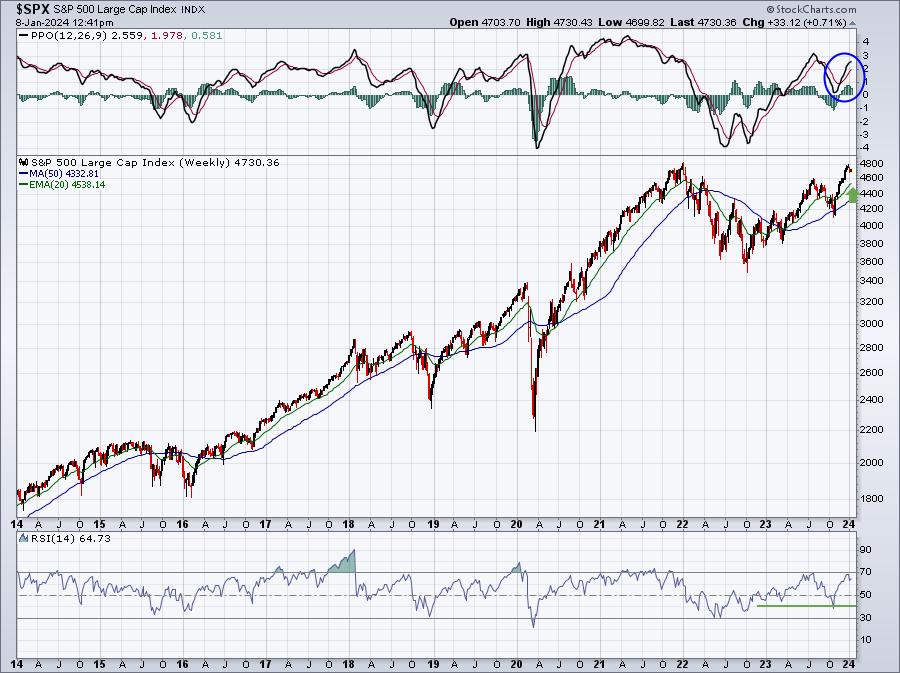
I see roughly the same set up here as I see with the Dow Jones.
NASDAQ 100 ($NDX):
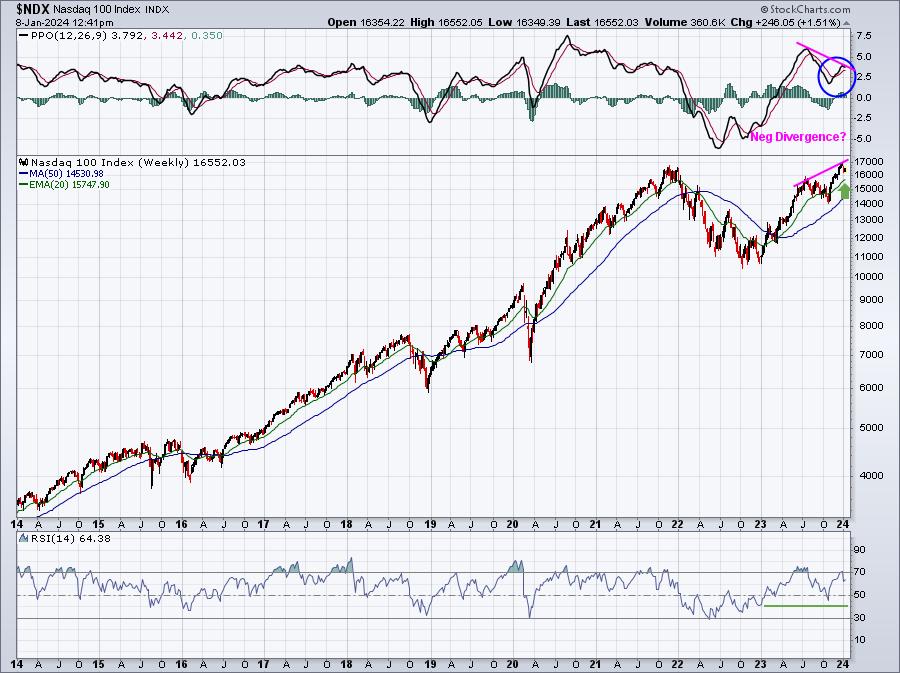
The NASDAQ is interesting, because there's obviously a textbook definition of a negative divergence here - higher prices and a lower PPO. But I look for a PPO centerline test and/or a 50-period SMA test after a negative divergence prints. In this case, however, between the two price peaks, we see price action move below the 20-week EMA and approach the 50-week SMA. The weekly PPO also moves fairly close to a centerline test. This isn't the type of negative divergence that worries me a lot, especially since the other major indices do not have negative divergences present. One thing it does tell me, though, is that the NASDAQ's momentum issues are likely more problematic than the other 3 indices.
Russell 2000 (IWM):
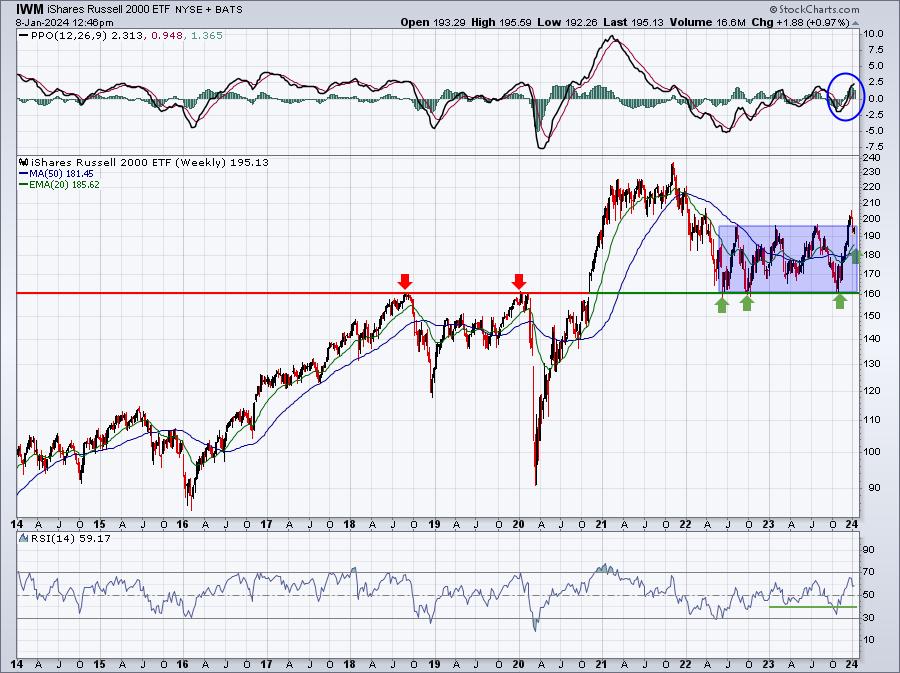
To me, this is the most constructive and bullish chart of the four. Despite performing poorly on a relative basis the past couple years, the IWM NEVER lost its major price support at 160. In other words, the long-term uptrend remains intact, despite the relative weakness. And just recently, the IWM cleared a significant triple top just below 200. After falling back to test its 50-day SMA (not pictured above), it did hold onto daily gap support at 192.67 and is turning higher today. Perhaps most important, rotation is favoring small caps and many areas that are heavily represented in the Russell 2000, like financials, industrials, health care, etc.
I made a very bold call at MarketVision 2024, suggesting a 50% move higher in the IWM this year to 300. That would catch a lot of bears by surprise, if it were to come true. Let's take it one day at a time and see where the IWM ends 2024. For now, let's just say I like it.
Trade Setup
Since beginning this Weekly Market Report in early September, I've discussed the long-term trade candidates below that I really like. Generally, these stocks have excellent long-term track records. Only in very specific cases (exceptions) would I consider a long-term entry into a stock that has a poor or limited long-term track record. Check these out:
- JPM
- BA
- FFIV
- UPWK (exception, limited history) - a heavy volume push through 16 would be very bullish
- MA
- GS - breaking trendline resistance near 350-355 would be very bullish
- FDX
- AAPL
- CHRW
- JBHT
- STX
- HSY
- DIS
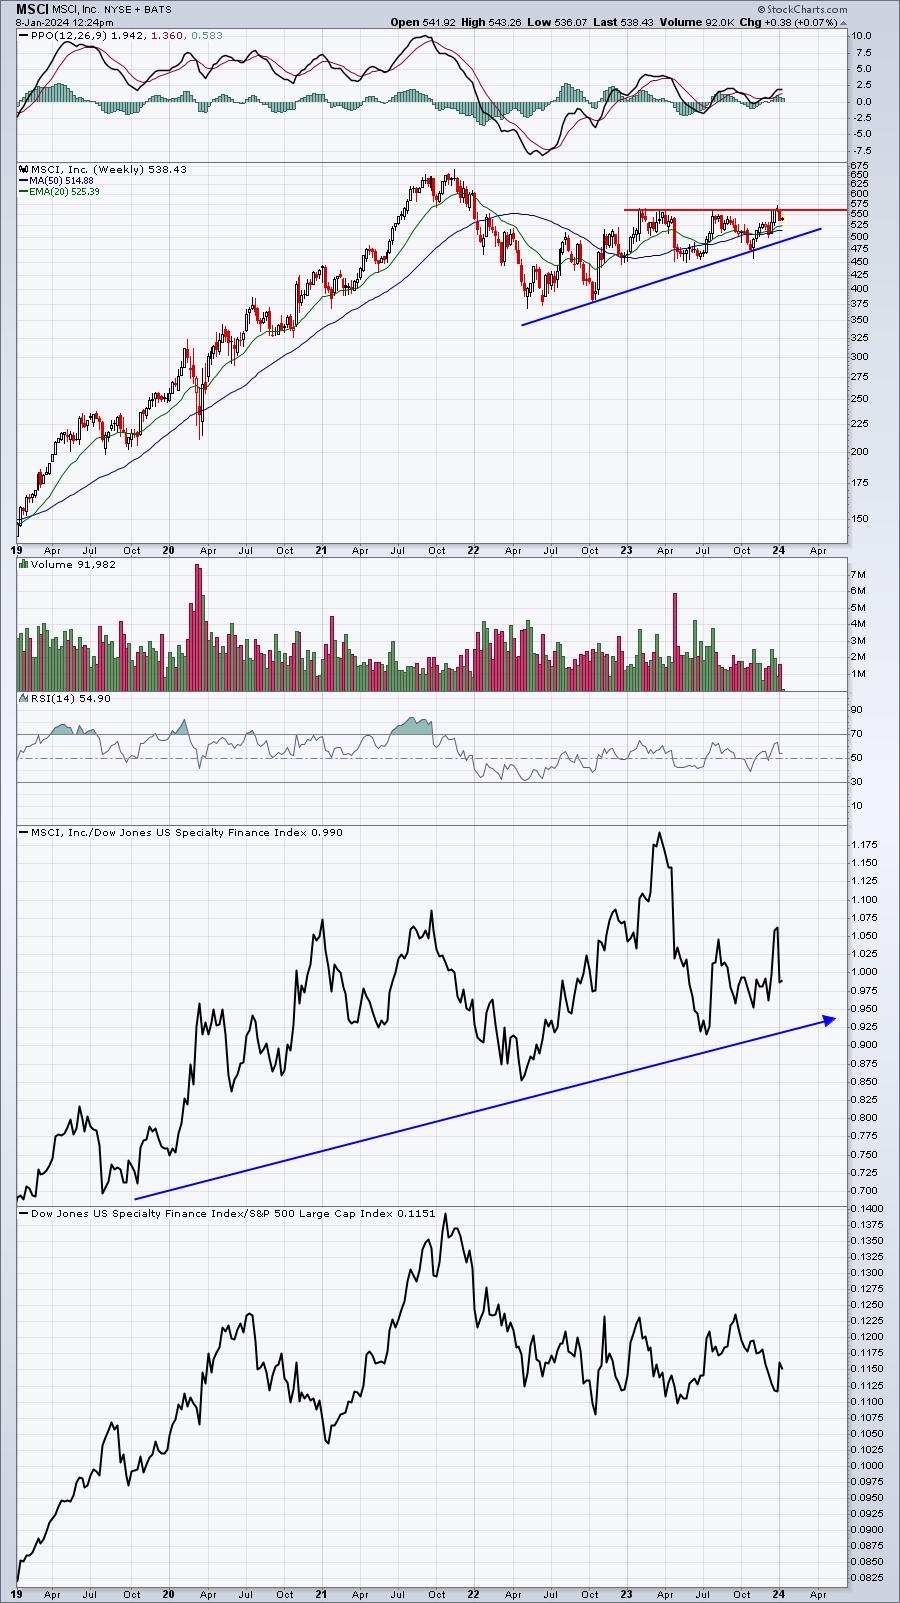
This week I'd like to add MSCI, Inc. (MSCI) to our long-term list of "buy and holds". These stocks are more designed for those of you that like solid long-term entry areas into stocks that have shown a strong track record and withstood the test of time. MSCI is part of the specialty finance group ($DJUSSP) that I discussed earlier. I also like S&P Global (SPGI), but MSCI has been the better long-term performer and it's also been the worst short-term performer. In my view, that sets it up for a nice entry right here:
Looking Ahead
Upcoming Earnings:
It's the calm before the storm. JPM will kick off earnings season on Friday, along with other market-moving types of companies (market cap in parenthesis). There will be plenty of other earnings reports out during the week, but none are particularly significant. This is NOT a list of ALL companies reporting this week, so please be sure to check for earnings of any companies that you own or add:
- Monday: None
- Tuesday: None
- Wednesday: None
- Thursday: None
- Friday: UNH ($504 billion), JPM ($496 billion), BAC ($267 billion), WFC ($179 billion)
Key Economic Reports:
- Monday: None
- Tuesday: None
- Wednesday: Wholesale inventories
- Thursday: December CPI, Initial jobless claims
- Friday: December PPI
Historical Data
I'm a true stock market historian. I am absolutely PASSIONATE about studying stock market history to provide us more clues about likely stock market direction and potential sectors/industries/stocks to trade. While I don't use history as a primary indicator, I'm always very aware of it as a secondary indicator. I love it when history lines up with my technical signals, providing me much more confidence to make particular trades.
Each week, I'll provide you the average annualized returns for each calendar day and by index. Here are the historical numbers for this week:
S&P 500
- January 8: -52.77%
- January 9: -27.18%
- January 10: +35.77%
- January 11: +20.42%
- January 12: -22.21%
NASDAQ
- January 8: +16.48%
- January 9: +4.05%
- January 10: +116.36%
- January 11: +38.73%
- January 12: -26.38%
Russell 2000
- January 8: -25.10%
- January 9: -43.81%
- January 10: +107.28%
- January 11: +17.37%
- January 12: -39.57%
The S&P 500 data dates back to 1950, while the NASDAQ and Russell 2000 information date back to 1971 and 1987, respectively.
We still have another 10 days in the most bullish period of the calendar year. The close on October 27th through the close on January 18th is THE ABSOLUTE BEST TIME OF THE YEAR FOR U.S. EQUITIES - HISTORICALLY SPEAKING.
Final Thoughts
Listen, we've had a very substantial run over the past 10 weeks or so. We're overbought, depending on the time frame that we consider. We do have a bit of slowing momentum on the NASDAQ, though not so much on the other major indices. I believe the higher odds reside with a continuing rally, but I'm nowhere near as bullish today as I was one year ago or even at the time of my bottom call in June 2022. The reward to risk at that time was much different than it is today. But as far as this week goes, this is what I'll be watching:
- Small caps (IWM). Do they hold the gap support zone from 192.67 up to 196.15. And the rising 20-day EMA is squarely in the middle of this at 194.85. I believe gap support will hold and we'll move back up to threaten the late-2023 high near 205. Let's see how it plays out.
- Volatility ($VIX). We have two key inflation reports due out on Thursday (CPI) and Friday (PPI). That's about the only economic reports out this week, so there will be plenty of eyeballs on those two reports.
- 10-year treasury yield ($TNX). Do those inflation reports result in renewed buying of treasuries? The TNX closed last week at 4.04%, which was slightly above the 20-day EMA. Today, however, the TNX is down 5 basis points to 3.99%, just beneath that 20-day EMA. Which side of this moving average the TNX trades will help determine how significant any future pullback might be.
- Rotation. The recent rotation has favored small caps and more value-oriented areas of the market. I believe we could see a lot more of this rotation, especially given the fact that the Magnificent 7 posted such large gains in 2023. If we see a period of consolidation or selling in those names, I believe the rotation to small caps continues. I also really like banks ($DJUSBK) and financials (XLF) in 2024 as these areas could benefit big time if the inverted yield curve "uninverts".
- Election year. That's not so much a "this week" thing, but I do believe that as the election comes more into focus later this year, it could have a big impact on how U.S. stocks perform. I'm sure I'll be discussing this throughout the year.
Feedback
If you'd like to share your thoughts on our Weekly Market Report, positive or negative, you can reach us at "[email protected]".
Happy trading!
Tom