
EB Weekly Market Report - Monday, January 15, 2024
ChartLists Updated
All of our ChartLists have been updated over the past week. They include:
- Strong Earnings (SECL)
- Strong Future Earnings (SFECL)
- Raised Guidance (RGCL)
- Strong AD (SADCL)
- Bullish Trifecta (BTCL)
- Short Squeeze (SSCL)
These ChartLists have been updated on our website and are available for viewing/download.
Weekly Market Recap
Major Indices
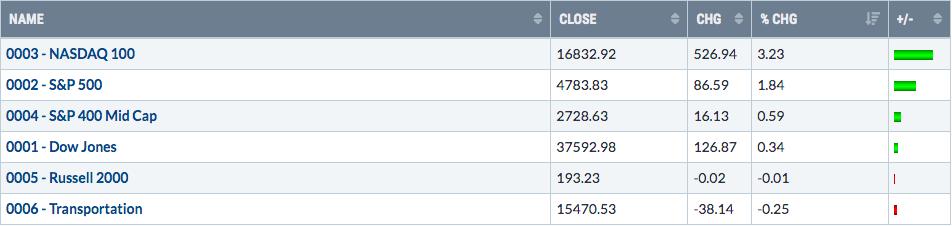
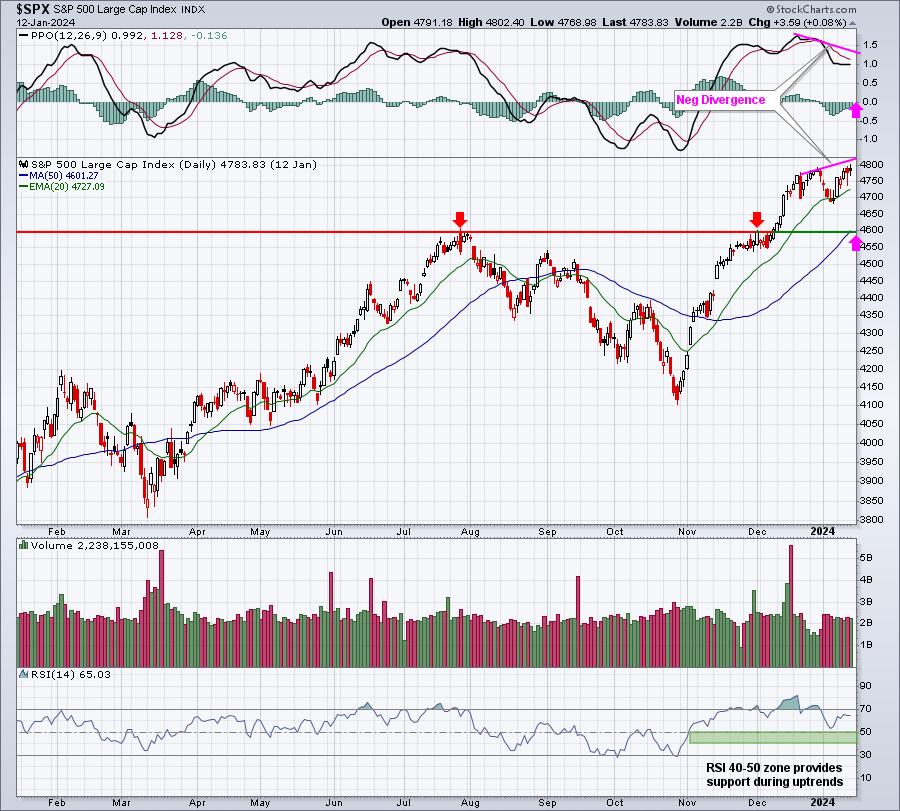
Well, the good news is obvious. The NASDAQ and S&P 500 regained strength and led the market to the upside. The more-than-3% jump in the aggressive NASDAQ felt particularly good as the "risk on" environment persisted for one more week. But there is bad news. We ALWAYS respect breakouts and the NASDAQ and S&P 500 are both on the verge of breakouts. Their PPOs clearly show slowing momentum, however. Any breakout ahead MUST be monitored, because of negative divergences on their respective daily charts. I can get behind the breakouts, but if we see a reversing candle print, I'd grow much more cautious. Here are both charts as they currently stand:
S&P 500:
NASDAQ 100:
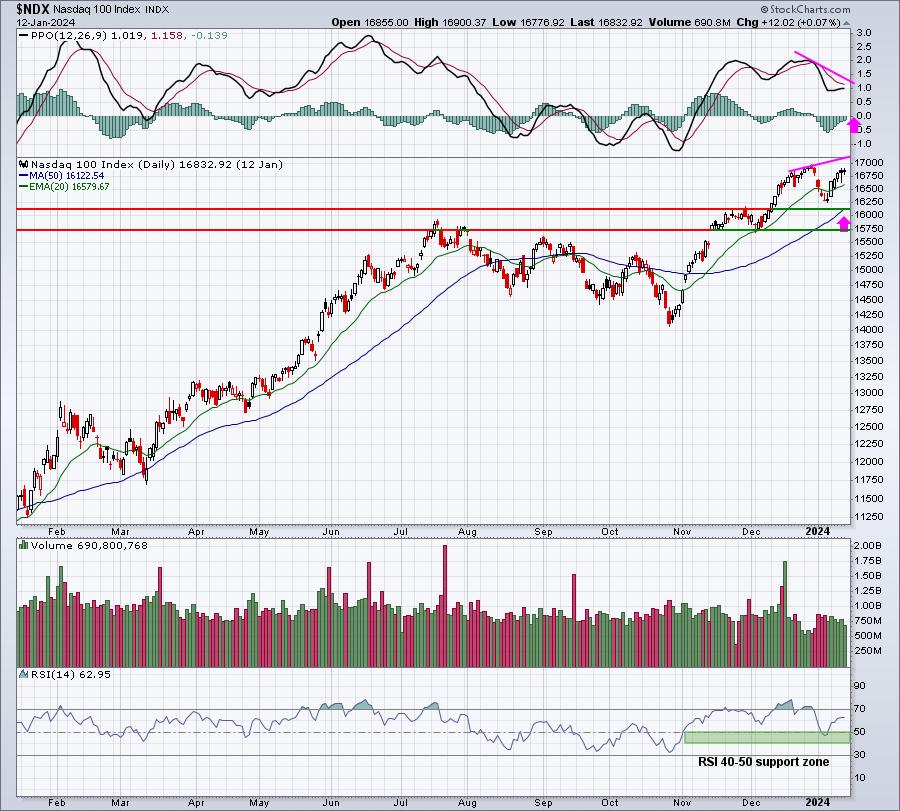
I'm projecting what those negative divergences will look like IF these two indices break to new highs. I consider the S&P 500's resistance from 4796-4818 to be bigger as that zone represents the highs that printed in early 2022, just before the cyclical bear market emerged.
Sectors
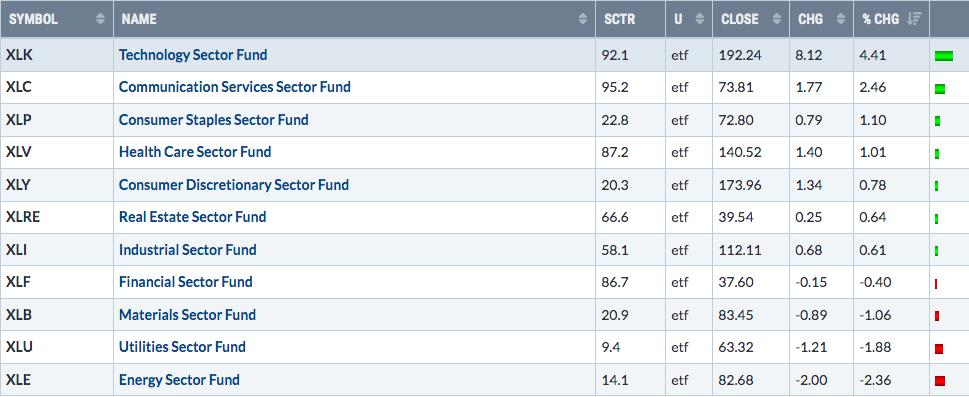
It was nice to see the XLK and XLC leading the market action, but let's remember it's options-expiration week. The best-performing sectors can run into trouble during or just after "Opposite George" week (Seinfeld reference). History tells us that the odds of a market reversal increase during monthly options expiration week. Currently, those leaders, based on SCTR scores are as follows:
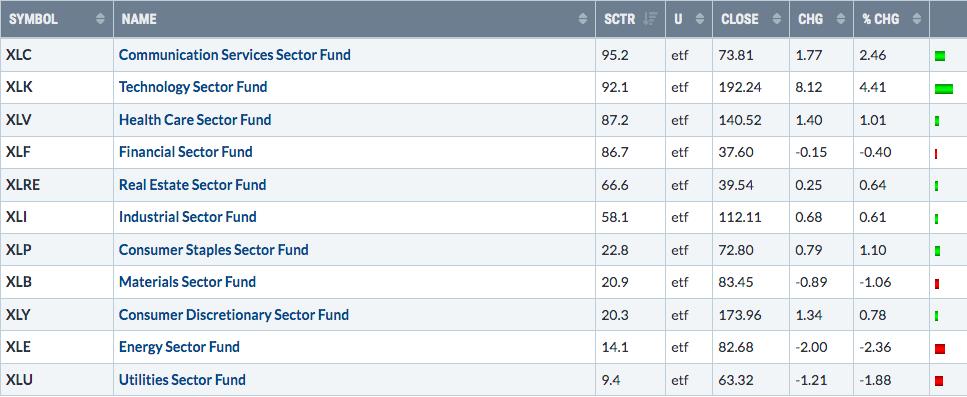
Based solely on the above SCTR scores, it wouldn't be difficult at all to see the XLC, XLK, XLV, and XLF run into some short-term difficulty ahead.
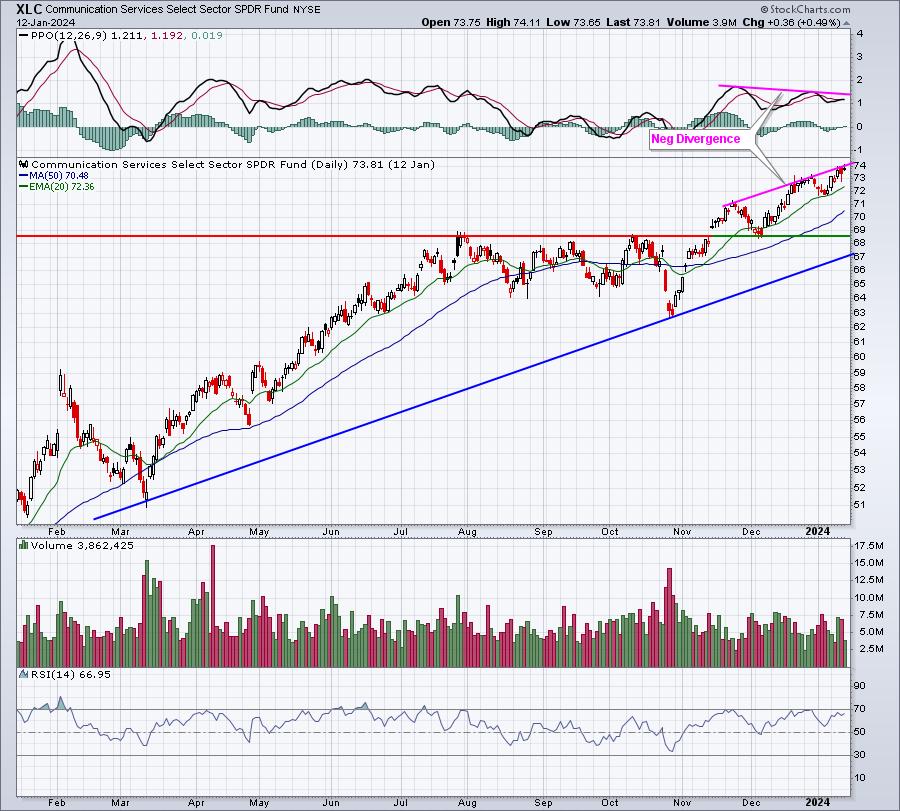
The negative divergence could result, ultimately, in a 50-day SMA test, currently at 70.48. But as I look back a full year, it wouldn't be too unreasonable to see a pullback to 68-69, testing both price and trendline support.
If the expiration of monthly options do cause short-term rotation out of stronger areas, I wouldn't be at all surprised to see materials (XLB) and energy (XLE) benefit from that rotation. Both seemed to reverse their short-term downtrends with higher daily highs and lows on Friday:
XLB:
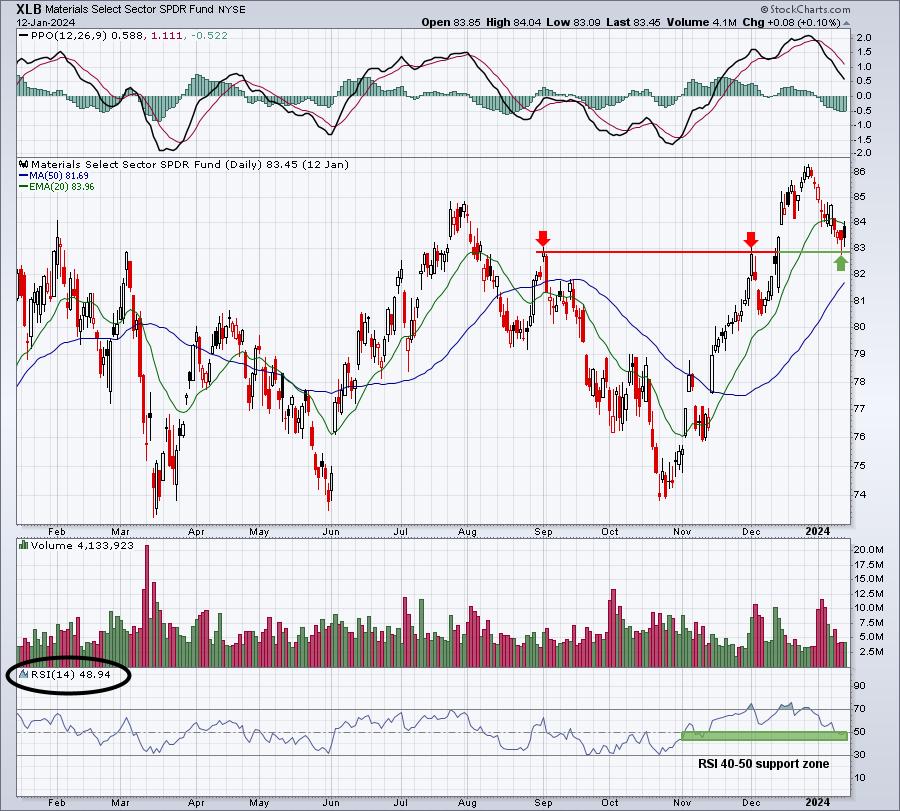
The XLB fell back and tested a key short-term support level at just below 83. It also saw its RSI dip just below 50 into the RSI 40-50 support zone where reversals typically occur during uptrends.
XLE:
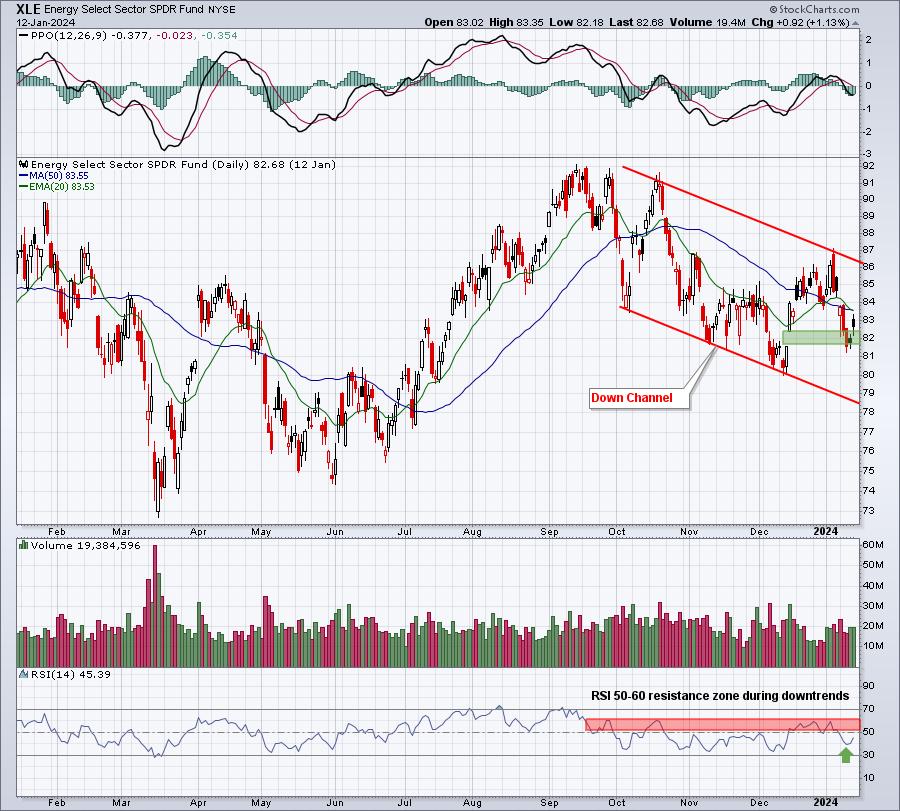
The XLE is a bit riskier on the long side right now, because it has a firmly established downtrend in play. Therefore, if it does bounce, I'd consider it a counter-trend rally and exit quickly. We need to see a channel breakout to the upside before growing more bullish. The intermediate-term lower highs and lower lows form a clear downtrend and note that all advances have seen the RSI stop at 60 - this is another downtrend signal. None of this changes until we see that channel breakout and an RSI trip well above 60.
Top 10 Industries Last Week
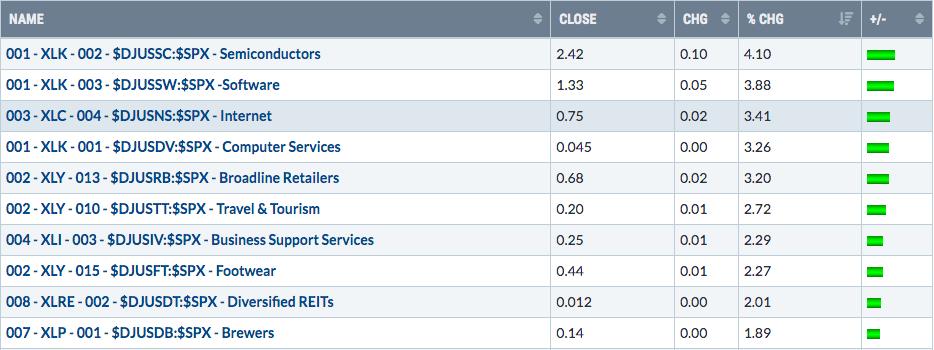
It's generally a bullish signal when we see semiconductors, software, and internet in the top 3 spots out of all industry groups. That's what we saw last week and is one key checkmark in the bulls' column. But many of the stocks in these 3 industries are heavily traded in options. With options expiring this Friday, trading these groups on the long side requires taking on much more risk, so make sure you're okay with that.
In the meantime, I couldn't help but see footwear in the top 10 industry groups. Footwear has taken an absolute beating since Nike's (NKE) earnings report in mid-December. Deckers (DECK) and Skechers (SKX) have both managed to perform well, despite the NKE earnings fiasco (NKE said sales would soften in the 2nd half of its fiscal year). The DJUSFT, which is heavily swayed by NKE, rallied last week, but is now approaching a very critical area on its chart:
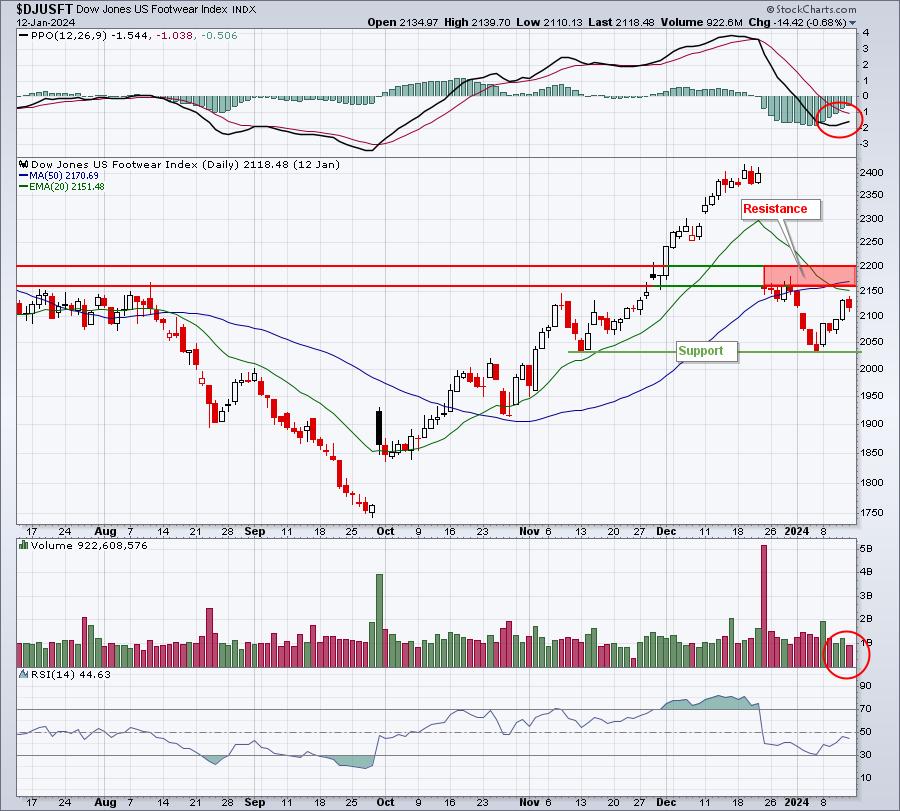
The DJUSFT is in a downtrend with the most likely direction to the downside. The group is current trapped in a trading range from support at 2030 and resistance in the 2160-2200 zone. The PPO has barely budged over the past week, despite a solid rally. That tells me momentum remains quite bearish and that the selling (at least on NKE) probably isn't over.
Bottom 10 Industries Last Week
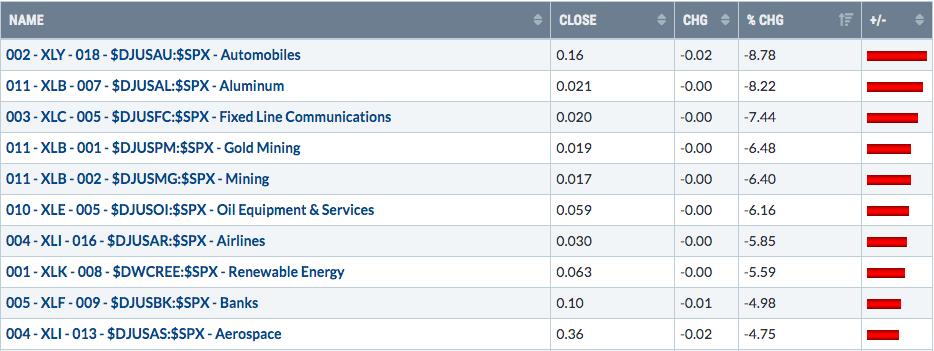
Oil equipment & services ($DJUSOI) look like a solid reward-to-risk opportunity at its current level. We could see a potential double bottom. We reversed and began to rally in this group on Friday, despite the earlier weakness. And if money does rotate for options expiration purposes, energy could benefit. Here's what the DJUSOI looks like right now:
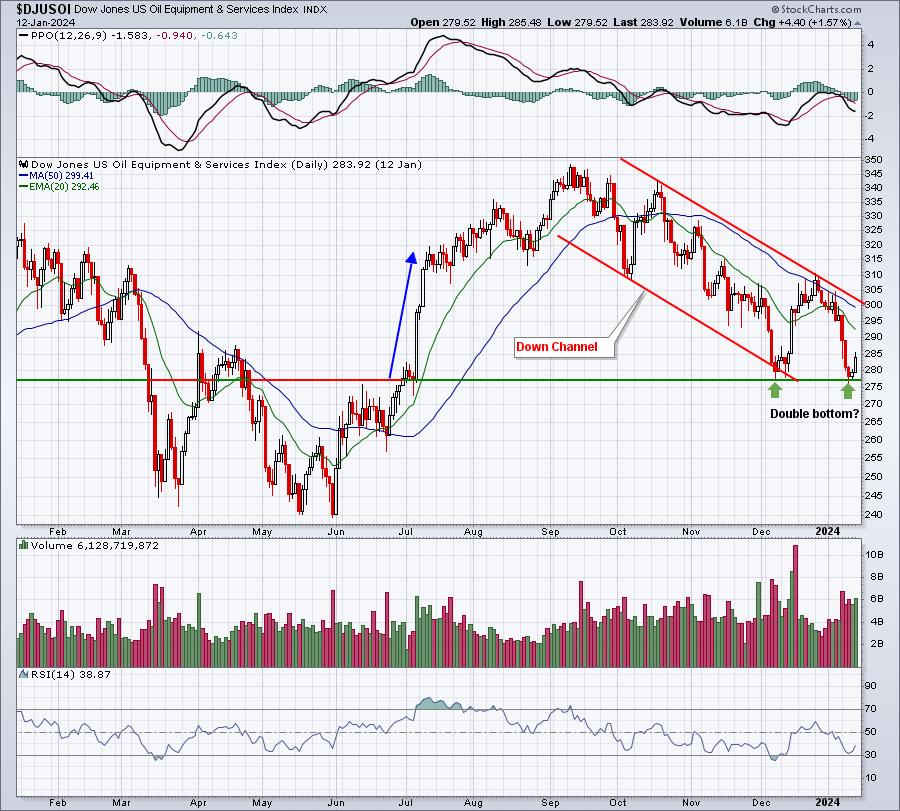
Clearly, when I discuss the short-term possibility to the upside, I'm talking for a trade. I'm not a fan of buy and hold, because the down channel could result in a further decline, especially if that double bottom support does not hold. A 3-5% upside move is what I'd look for in the very near-term.
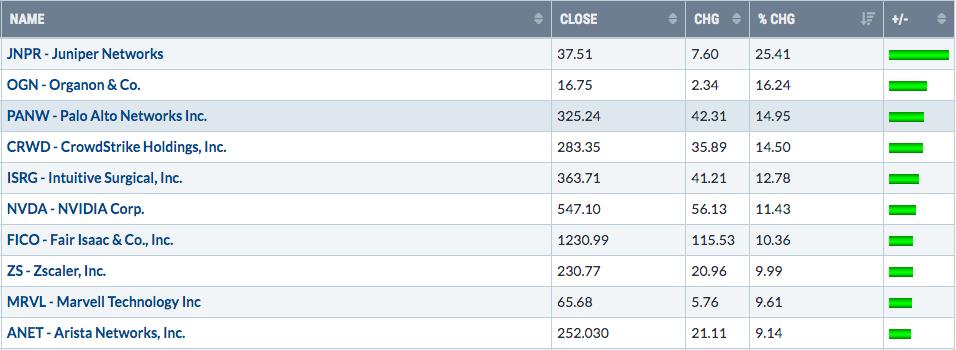
Top 10 Stocks - S&P 500/NASDAQ 100
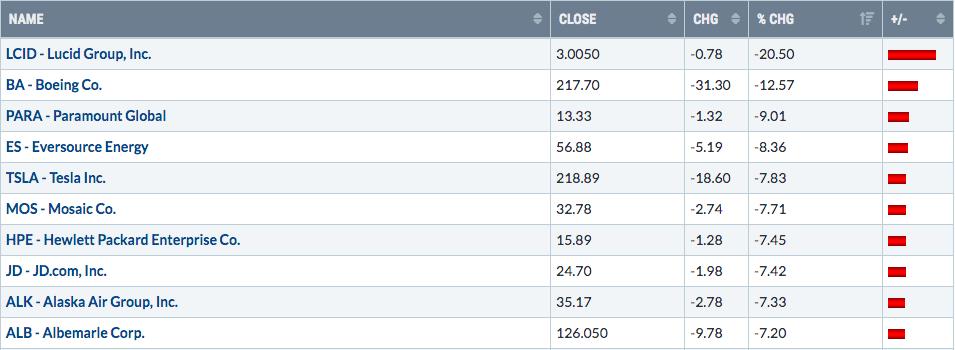
Bottom 10 Stocks - S&P 500/NASDAQ 100
Big Picture
I love to see that monthly PPO turning up off centerline support. If you look back at the 1950s-1960s or 1980s-1990s, you'll see many tests of that centerline support with a rapid turn back to the upside. This tells us that long-term bullish momentum is not lost during secular bull markets. We get down to the centerline, but weakness in secular bull markets does not last long enough to take the monthly PPO below zero:
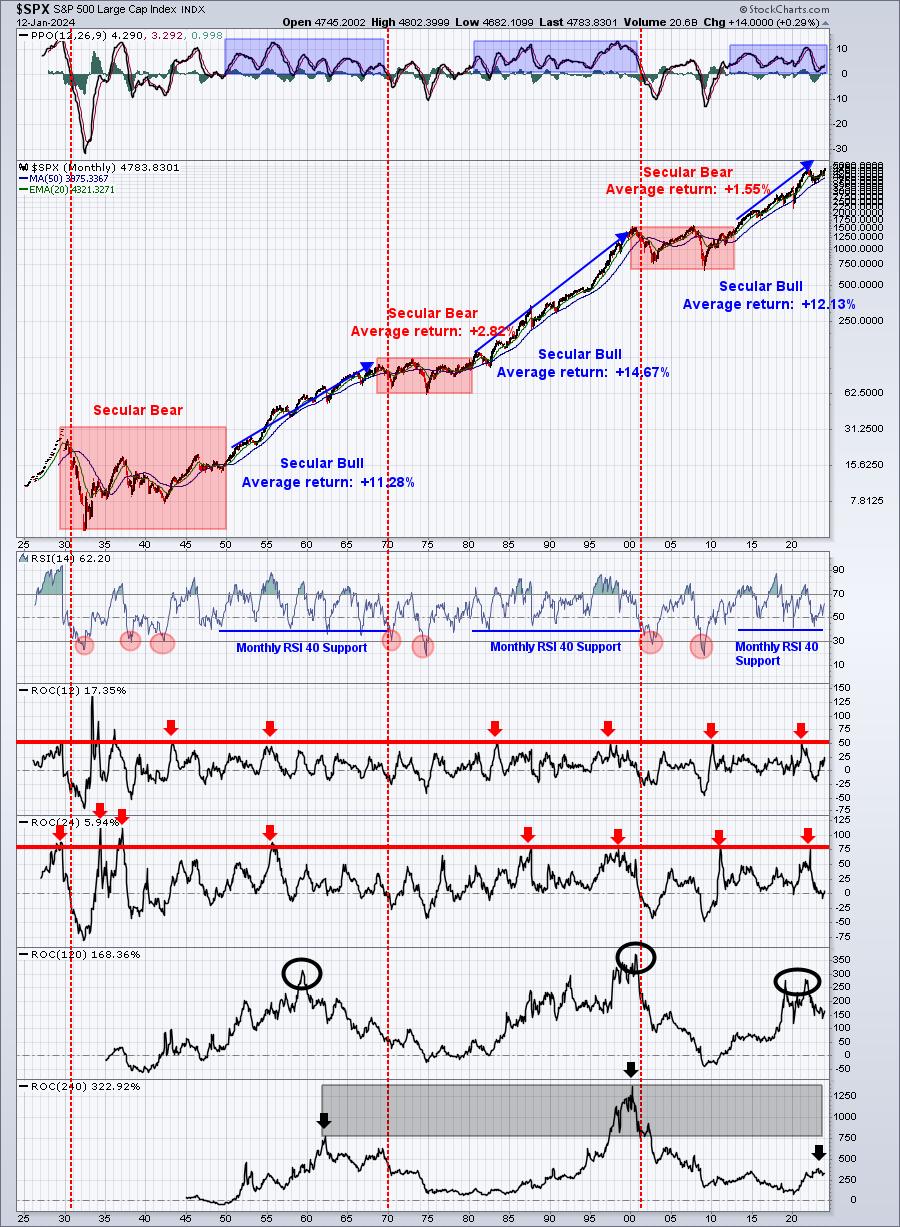
The monthly RSI strengthened again last month and is above 60, always a bullish signal. I expect the monthly PPO during the balance of the 2020s to look more like the 1960s than any other decade. Interest rates have come off of crazy lows and the higher "normal" rate going forward will likely provide bears plenty of fuel at various times to believe "a new secular bear market has emerged", just like they were saying with the pandemic and 2022 cyclical bear market. Perspective is important, however, and the chart above is my favorite in that regard.
Rotation
I calculated the best- and worst-performing sectors/industry groups off the S&P 500's October 27th low and through the December 28th high. I also calculated the rotation that took place at the S&P 500's recent double top (December 28th vs. January 12th). This isn't perfect, but let's look at the 3-month Sector Summary to identify strength and weakness over the past 3 months:
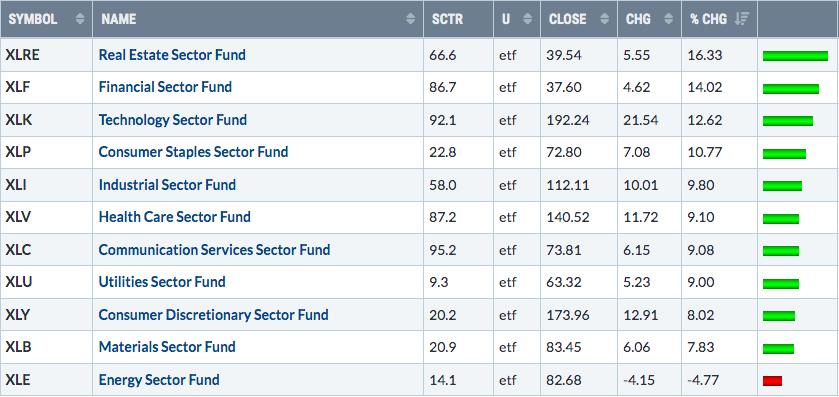
Real estate and financials both represent more value-oriented sectors. While communication services and consumer discretionary (two aggressive, more growth-oriented sectors) are in the bottom half of 3-month performers, technology has remained persistent and among the leaders. Remember, though, this is the past 3-months, which begins earlier than the October 27th bottom and ends after the S&P 500 double top.
I've calculated the actual best and worst performers from October 27th through December 28th and then from December 28th through January 12th. Check this out:
October 27th - December 28th:
During this period, here were the top 4 sectors compared to the S&P 500, which gained 16.17%:
- Real estate: +26.52%
- Financials: +20.51%
- Consumer discretionary: +20.49%
- Technology: +20.09%
And here were the bottom 4:
- Energy: +0.25%
- Consumer staples: +8.78%
- Utilities: +8.99%
- Health care: +11.13%
One thing I see immediately, and I made it bold above, is the relationship between discretionary and staples. The more aggressive discretionary more than DOUBLED staples' performance. Folks, if you're expecting a recession ahead in 2024, please tell me ONE REASON why the big Wall Street firms would be pouring their resources INTO discretionary vs. staples. In December 2021, before the 2022 cyclical bear market, staples gained 10% and discretionary was flat. If those big firms are expecting weakness ahead, trust me, they'll be rotating into market areas that historically perform much better during weak S&P 500 periods. As I've said before, I believe Q1 could be somewhat choppy, but after Q1 ends, I see a solid resumption of the current secular bull market. This rotation supports my theory 100%.
December 28th - January 12th:
This period covers our double top. In other words, the S&P 500 dropped back and then returned once again to test its all-time high. The net change on the S&P 500: +0.01%. But what changed, if anything, during this back and forth period?
Top 4 sector performers:
- Health care: +3.14%
- Consumer staples: +1.28%
- Communication services: +0.97%
- Utilities: -0.14%
Bottom 4 sector performers:
- Consumer discretionary: -3.31%
- Materials: -2.83%
- Real estate: -2.37%
- Industrials: -1.77%
So more recently, we've seen profit taking in discretionary stocks, which resulted in staples easily outperforming. The most recent rotation is likely due to short-term options expiration issues. 3 of the 4 top performers are defensive, or value-oriented, sectors. After the huge upside advance, it makes total sense to see this type of short-term rotation.
Let's move on to industry groups. In my opinion, the top 10 industry performers were as follows (including both the Q4 rally and the recent double top):
- Home construction: +47.08%
- Travel & tourism: +36.07%
- Recreational services: +33.79%
- Hotel & lodging REITs: +32.87%
- Industrial & office REITs: +32.54%
- Asset managers: +31.32%
- Semiconductors: +30.50%
- Diversified REITs: +28.43%
- Banks: +28.20%
- Aluminum: +27.74%
And now the worst 10 performers:
- Oil & equipment services: -10.35%
- Exploration & production: -3.03%
- Integrated oil & gas: -2.79%
- Gold mining: -0.14%
- Business training & employment agencies: +0.00%
- Mining: +0.25%
- Auto parts: +1.22%
- Marine transportation: +2.65%
- Reinsurance: +2.80%
- Insurance brokers: +3.62%
If we were heading into a recession in 2024, do you think that home construction, travel & tourism, and recreational services would be the Top 3 groups during the recent rally? Seriously! The stock market prices in things ahead of time, typically at 3-6 months in advance. Interest-sensitive stocks are also leading, telling me that interest rates are very unlikely to go shooting back up towards 5% like some folks are calling for.
Here's the bottom line. This latest rotation tells me that inflation will continue to subside, eliminating any pressure on the Fed to consider raising rates any further. And the REIT leadership suggests the opposite - that rates are likely to decline throughout 2024. As far a potential recession goes, I just do not see it. Rates did not rise over the past two years, because of the economic cycle. They rose due to the continuing threat of inflation. Rates will drop in 2024 as the threat of inflation diminishes significantly. Many "experts" will interpret rate decreases as the Fed responding to potentially weak economic conditions ahead. That will not be the story of 2024. Economic conditions will be solid, but not overly strong. Slow economic strength and the reduction of Core CPI is NIRVANA for U.S. equities. Once we get through the inevitable chop in Q1, which is the norm for election years, by the way, I suspect will see another fairly solid rally into the summer months.
This is what current market rotation is telling me.
Sentiment
The equity only put call ratio ($CPCE) was 1.55 last Wednesday, but this number needs to be adjusted. If you recall, I use the CPCE as a sentiment reading of individual retail traders like you and me. I look for extreme 5-day SMA readings to help me spot key market bottoms primarily, but also, to a lesser degree, market tops. During Q4 2022 and Q4 2023 (and now into Q1 2024), there were several Wednesdays that showed MASSIVE spikes in the CPCE. There have been articles discussing these spikes, and the reason behind it, apparently, is the use of large equity puts being traded by hedge funds to hedge large investments made in large cap names like AAPL, MSFT, GOOGL, AMZN, NVDA, META, TSLA, etc. This provides us no meaningful information, in my opinion, as to the mental state of retail traders, so I estimate the amount of equity put trades to eliminate in my adjusted calculation of the daily CPCE. I then keep a User-Defined Index (UDI) to track my adjusted daily readings. Below is the UNADJUSTED CPCE chart (5-day SMA) with a lower panel showing the CPCE daily, along with the S&P 500 just above it:
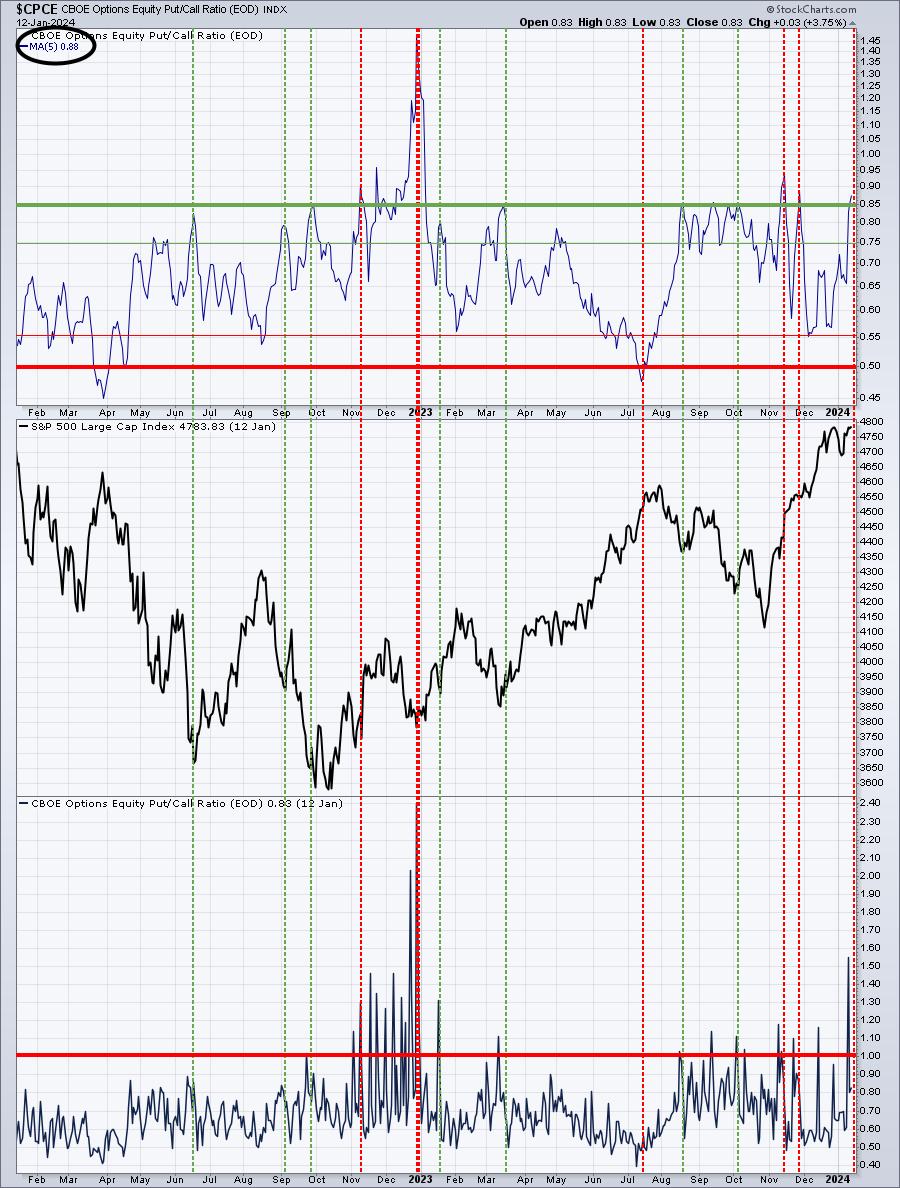
In the bottom panel, check out the tightly-bunched readings well above 1.0 in Q4 2022. There weren't as many in Q4 2023, but still enough to heavily influence the 5-day SMA readings. In the top panel, the green-dotted vertical lines mark periods where retail traders were extremely fearful as the S&P 500 dropped precipitously. This is what this sentiment indicator is supposed to tell us. The red-dotted vertical lines were 5-day SMA readings during mostly bullish market periods. They provided us MEANINGLESS information. Acting upon it would have been a big mistake, with the one exception being that THICK red-dotted vertical line in late-December 2023.
Now let's look at a similar chart, only ADJUSTED this time to eliminate those hedge fund equity put trades:
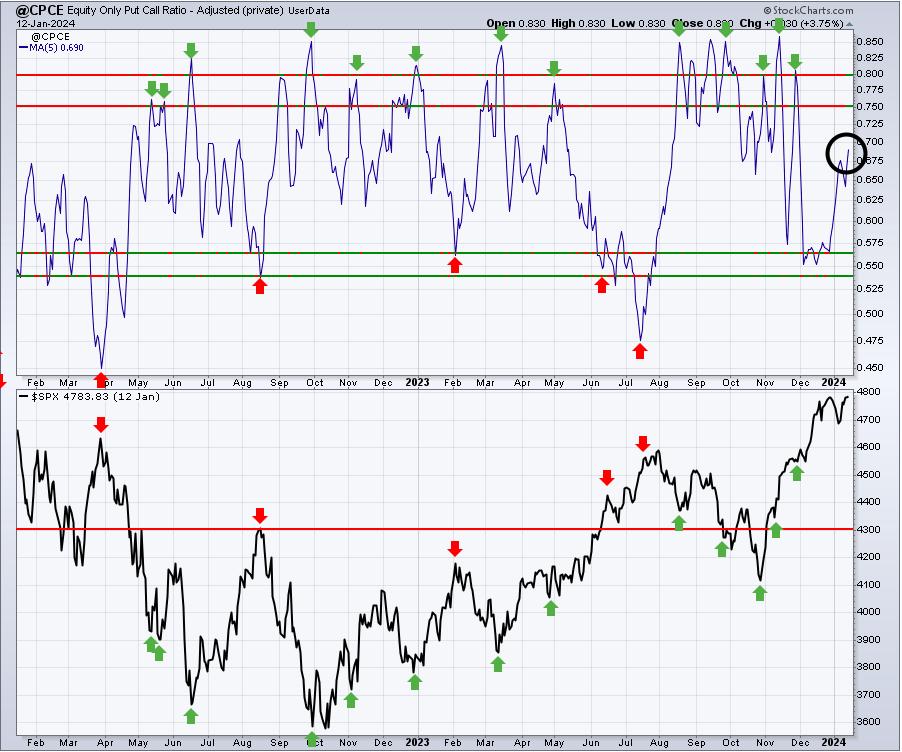
There are two very important things to note on this ADJUSTED chart. First, look at where the 5-day SMA reading is currently - at .69. This is what we'd expect with the S&P 500 closing near an all-time high. In the UNADJUSTED chart, this reading is .88, suggesting that the retail trader is extremely fearful. This isn't even good common sense. Why would retail traders be so fearful if the S&P 500 is at an all-time high. Fear and panic are associated with big market drops. Yet, plenty of technicians look at the first chart and make wrong conclusions.
The second chart is MUCH MORE ACCURATE in forecasting short-term market tops and bottoms. Nearly every 5-day SMA reading in or above the panicked .75-.85 range coincides with a market bottom (green arrows). Using the UNADJUSTED chart results readings that are no better than a coin flip.
Clearly, the ADJUSTED CPCE chart provides us a much better indication of when retail traders are at extremely pessimistic levels. Be careful not to make sentiment conclusions based on the unadjusted data at StockCharts.com. (By the way, it's not StockCharts.com's fault. They are simply reporting the data from the CBOE.com.)
Trade Setup
Since beginning this Weekly Market Report in early September, I've discussed the long-term trade candidates below that I really like. Generally, these stocks have excellent long-term track records. Only in very specific cases (exceptions) would I consider a long-term entry into a stock that has a poor or limited long-term track record. Check these out:
- JPM
- BA
- FFIV
- UPWK (exception, limited history) - a heavy volume push through 16 would be very bullish
- MA
- GS - breaking trendline resistance near 350-355 would be very bullish
- FDX
- AAPL
- CHRW
- JBHT
- STX
- HSY
- DIS
- MSCI
I'm not going to add any stocks to our long-term trade portfolio this week. However, I will be looking to add a technology company or two over the next several weeks if we do see a period of selling in that sector.
Looking Ahead
Upcoming Earnings:
JPM and the banks kicked off earnings season last Friday, along with a couple other market-moving types of companies. The number of earnings reports for Q4 will only accelerate from here. I've identified what I believe are key companies that will report this week, with their respective market caps in parenthesis. This is NOT a list of ALL companies reporting this week, so please be sure to check for earnings of any companies that you own or add:
- Monday: None - Market Closed
- Tuesday: MS ($149 billion), GS ($124 billion), PNC ($61 billion)
- Wednesday: PLD ($121 billion), SCHW ($116 billion), USB ($67 billion)
- Thursday: TFC ($50 billion), FAST ($36 billion), PPG ($35 billion)
- Friday: SLB ($69 billion), TRV ($45 billion), FITB ($24 billion)
Key Economic Reports:
- Monday: None - Market Closed
- Tuesday: January empire manufacturing survey
- Wednesday: December retail sales, December industrial production & capacity utilization, November business inventories, Fed beige book
- Thursday: Initial jobless claims, January Philadelphia Fed manufacturing survey, December housing starts & building permits
- Friday: January consumer sentiment, December existing home sales
Historical Data
I'm a true stock market historian. I am absolutely PASSIONATE about studying stock market history to provide us more clues about likely stock market direction and potential sectors/industries/stocks to trade. While I don't use history as a primary indicator, I'm always very aware of it as a secondary indicator. I love it when history lines up with my technical signals, providing me much more confidence to make particular trades.
Each week, I'll provide you the average annualized returns for each calendar day and by index. Here are the historical numbers for this week:
S&P 500
- January 15: +25.13%
- January 16: +26.75%
- January 17: +18.69%
- January 18: +6.05%
- January 19: -13.73%
NASDAQ
- January 15: +17.69%
- January 16: +72.80%
- January 17: +49.18%
- January 18: +26.25%
- January 19: -35.12%
Russell 2000
- January 15: -18.29%
- January 16: +82.54%
- January 17: +6.55%
- January 18: -27.29%
- January 19: +10.17%
The S&P 500 data dates back to 1950, while the NASDAQ and Russell 2000 information date back to 1971 and 1987, respectively.
The most bullish period of the calendar year ends this Thursday. The close on October 27th through the close on January 18th is THE ABSOLUTE BEST TIME OF THE YEAR TO INVEST IN U.S. EQUITIES - HISTORICALLY SPEAKING.
Final Thoughts
Our most bullish period of the year ends this Thursday. We also know that Q1 isn't a particularly strong quarter during election years. Throw in the fact that January monthly options expire on Friday and it's clear that risks are a tad elevated. January has been the NASDAQ's best calendar month for performance since 1971, which should be considered as well. Technically, a breakout on the S&P 500 and/or the NASDAQ 100 would trigger negative divergences on their respective daily charts. If we do see breakouts and negative divergences, then I'll be on "Reversing Candle Watch" as the combination of those two significantly increase the odds of a more significant selling event - perhaps to the tune of 3-5%. Given the number of net in-the-money calls, market makers would likely support any short-term selling. I'm more worried about that as we near the end of this week, plus the early part of next week. Here are a few other considerations:
- Banks ($DJUSBK). We saw a "buy on rumor, sell on news" Friday, with respect to JP Morgan (JPM) as bank earnings kicked off earnings season. Many more banks will be reporting this week and next. What type of response do we see from the group as a whole? That could provide us some clues about bank leadership in 2024, which is what I'm currently expecting.
- Industrial production. This report will be out on Wednesday and needs to turn lower in a big way to even consider a 2024 recession. Every significant recession this century has been accompanied by dire industrial production numbers.
- 10-year treasury yield ($TNX). There was a very muted response in the bond market to the higher-than-expected December core CPI reading last week. Then, the next day, we saw below expectations inflation in the form of the December core PPI reading. The TNX fell and we closed the week with two consecutive readings below its 20-day EMA.
- Rotation. This will be an ongoing analysis during Q1 2024 to help figure out where leadership is likely to come from as we approach the 2024 Presidential Election in November.
- Volatility Index ($VIX). The S&P 500 has a history of producing gains when the VIX is below 20. And the lower the VIX goes, the better the S&P 500 performance gets. The VIX, while dropping last week back into the 12s, is slightly higher than the lows felt in December. That rising VIX over the intermediate-term could be an early warning sign that a selloff (likely small and contained, maybe 3-5%) could be in the cards for the balance of January.
- Negative Divergences. Both the S&P 500 and NASDAQ 100 have printed negative divergences on their daily charts. If we break out on both indices and then print a reversing candle (think shooting star, bearish engulfing), that would suggest the short-term risk is growing rather significantly.
Feedback
If you'd like to share your thoughts on our Weekly Market Report, positive or negative, you can reach us at "[email protected]".
Happy trading!
Tom