
EB Weekly Market Report - Monday, January 24, 2024
ChartLists Updated
Several updates have been featured on our website since Friday:
- Strong Earnings (SECL)
- Strong Future Earnings (SFECL)
- Short Squeeze (SSCL)
- Strong ETF (SETFCL)
- Model ETF Portfolio (MODETFCL)
Additionally we've included two spreadsheets on our website as well. They are the Presidential Election Year excel spreadsheet and the January ETF Analyzer spreadsheet.
Also, we've had questions about the MarketVision 2024 ChartList. It's been on hold as I've been catching up on all other areas of our service. After this WMR is sent, however, I will update that ChartList and we'll get it up on our site for those wanting to view/download it. Sorry for the delay!
Weekly Market Recap
Major Indices
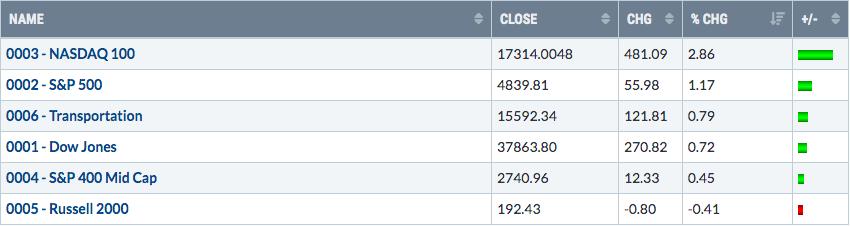
I would not have expected to see the major indices mostly higher last week AND led by the NASDAQ 100. After all, the key companies that represent the largest percentage of the NASDAQ 100 had BILLIONS in net in-the-money premiums. However, the stock market does what it wants and, as I mentioned during the max pain webinar last week, market makers DO NOT lose money if price direction doesn't cooperate with our max pain analysis. The bottom line is that this secular bull market is fully alive and kicking. And it's also why I say NOT to bet against a secular bull market. Because just when we come up with a myriad of reasons why stocks can't go higher, they do exactly that. During bull markets, I'd much rather be long and see the stock market go down than be short and watch the stock market move higher.
I remain VERY BULLISH longer-term. From a trader's perspective, I do follow a number of shorter-term signals that tell me to be cautious from time to time, but I find it nearly impossible to short bull market advances and make money. Last week is simply the latest example of this.
Sectors
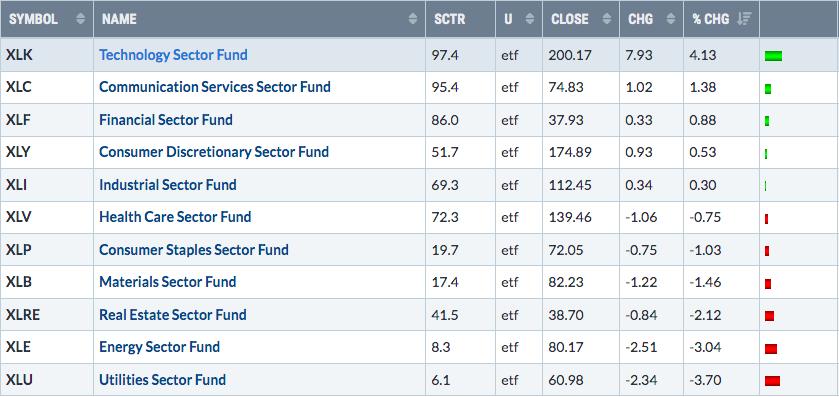
Like the major indices, I would not have expected to see technology (XLK) lead the market higher last week, especially because of options expiration. But the leaderboard was quite consistent with the prior week's sector leaderboard. We saw a bit more relative strength in financials (XLF), but the strength in aggressive sectors last week generally mirrored what we saw in the prior week. Overall, solid performance in these aggressive sectors is a very strong sustainability signal, meaning that it's likely that strength continues. I would still remain on watch for a reversing candle on extreme volume to perhaps mark a short-term top, but without that, betting at all against this bull market advance is just as risky as betting on it. Again, I'll stand with the bulls.
Top 10 Industries Last Week
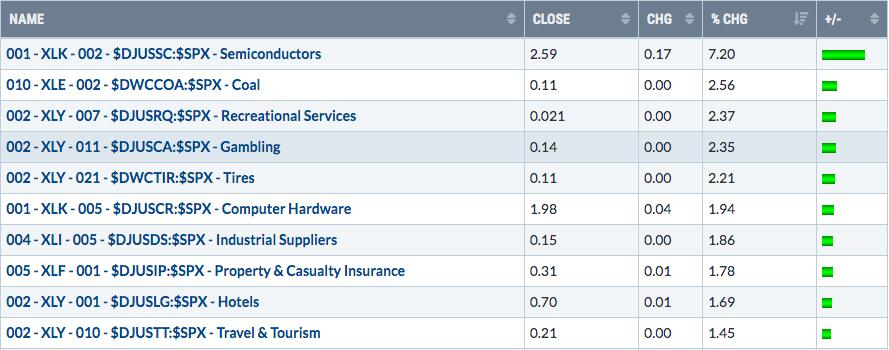
Gambling stocks ($DJUSCA) have been volatile since the October low for sure. They're backing off today, but overhead resistance is very clear here:
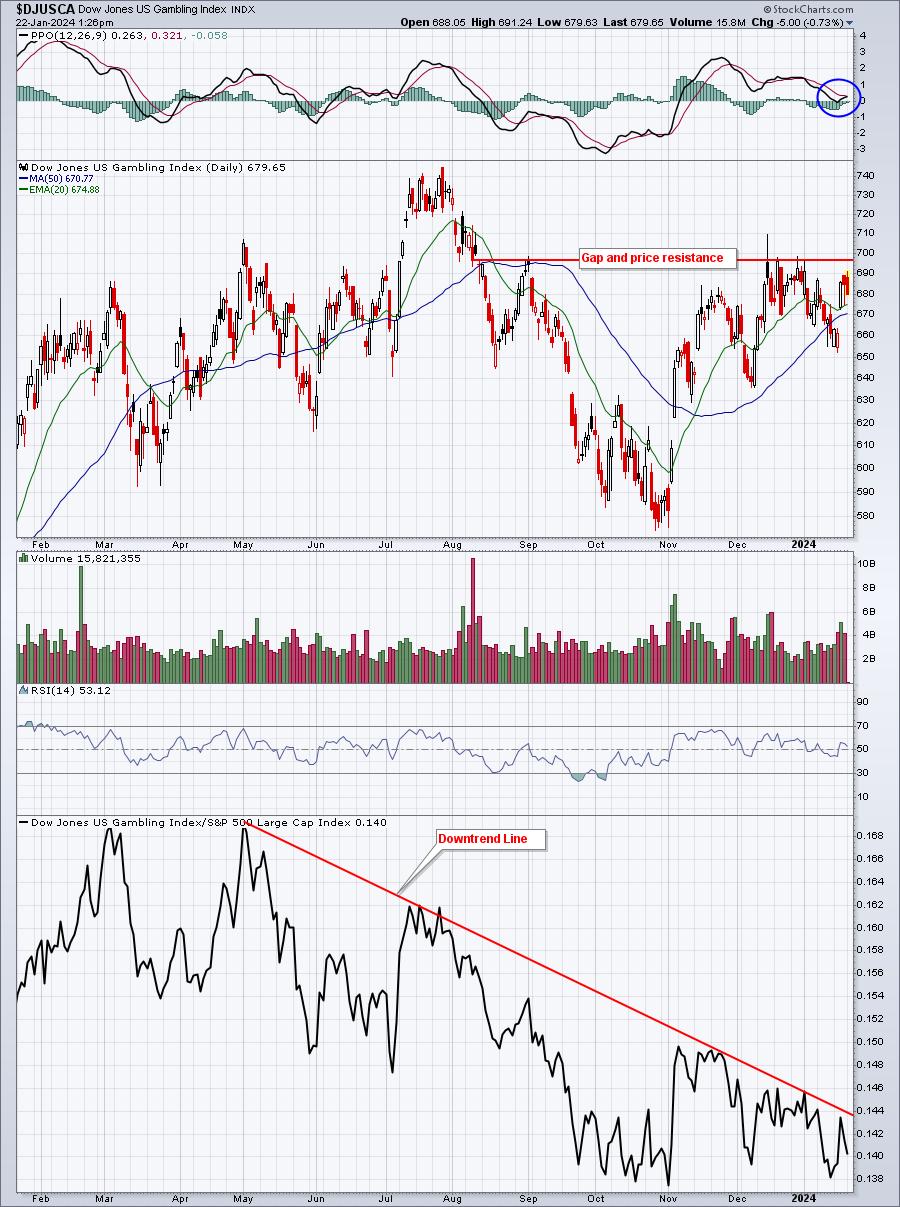
If the DJUSCA can clear overhead resistance just below 700 and simultaneously break the relative downtrend over the past year, then we could certainly see leadership here to support relative weakness in other areas like technology.
Bottom 10 Industries Last Week
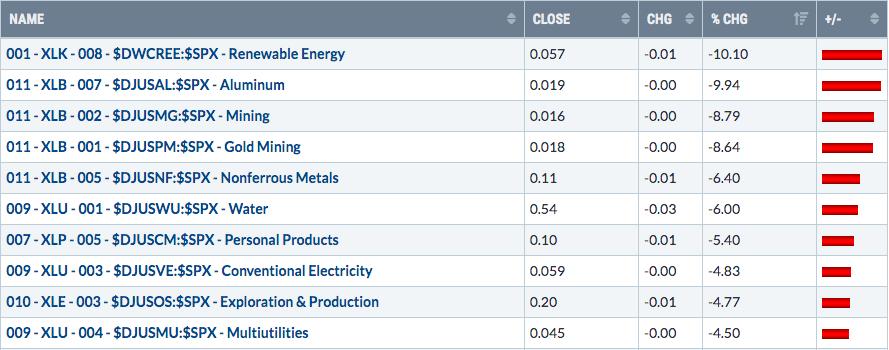
As most of you should know, I'm not a fan of gold and haven't been for a dozen years. Gold has consistently underperformed the S&P 500 during that time. Even last year, gold finished the year higher, but the S&P 500 gain was nearly double that of gold.
Below is an interesting chart, comparing the price of gold (GLD) to the performance of gold miners ($DJUSPM):
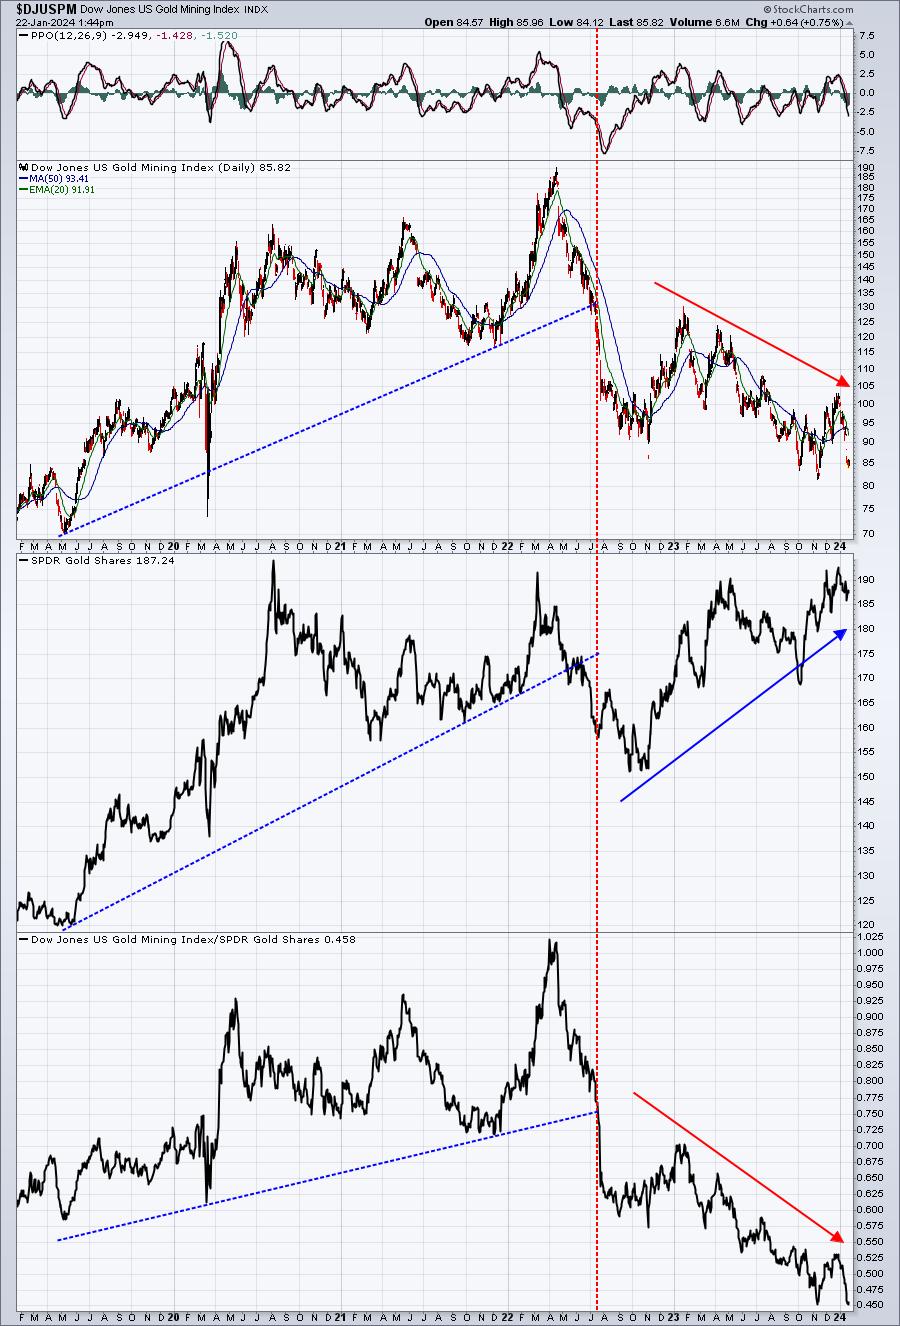
They seemed to be tightly correlated with both moving higher together until June 2022 - at the time the S&P 500 appeared to bottom to me. Since then, gold has moved higher, while the miners have been very weak. Perhaps it was just the inflation concern that lifted the metal. If so, then I could see gold performing much worse in 2024 than many expect, because, in my opinion, inflation is TOAST.
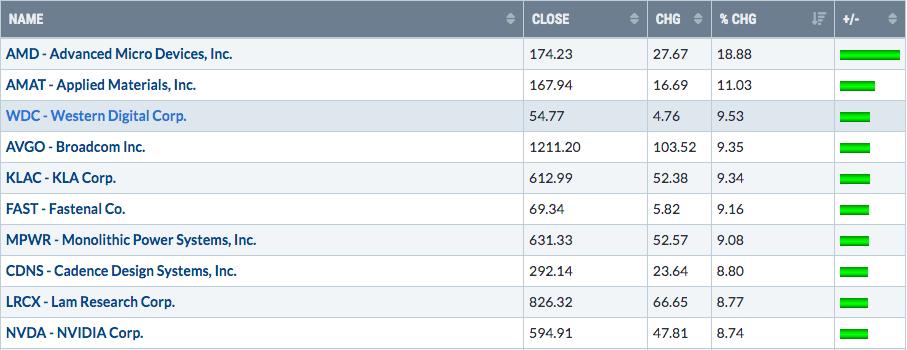
Top 10 Stocks - S&P 500/NASDAQ 100
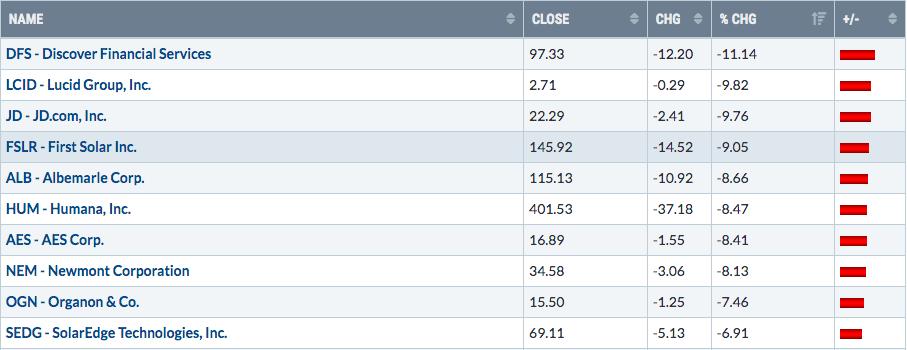
Bottom 10 Stocks - S&P 500/NASDAQ 100
Big Picture
This chart of MAJOR PERSPECTIVE reminds us all every week that this secular bull market rages on. And last week, in true secular bull market fashion, the S&P 500 finally made its long-awaited breakout above the 4800 level. It's been a long trip back from those lows of June 2022, when I called the bottom on my YouTube Trading Places show, but here we are now. Lots of folks have turned bullish now, but this chart played a very big role in me going against the crowd in the midst of a cyclical bear market. I was laughed at and ridiculed, but who got the last laugh?
Maintaining perspective is incredibly important, especially as social media has become such a huge part of our every day life. There are tons of "experts" on social media and other media outlets (sarcasm), always betting against this long-term chart. Constantly remaining fearful and always looking for the next big story to unleash the fury of a secular bear market is no way to approach the stock market. Fear mongerers do so for the "Big Splash", convincing unsuspecting investors to join them and be saved from the world! Keep your investing circle small and remain objective, keeping those you trust close at hand. Yes, the stock market does go down from time to time and it can get scary, but I'll simply remind you to look at this chart once a week. Look at it carefully and ask yourself.....is it better to remain positive or negative when thinking about the S&P 500 throughout its history?
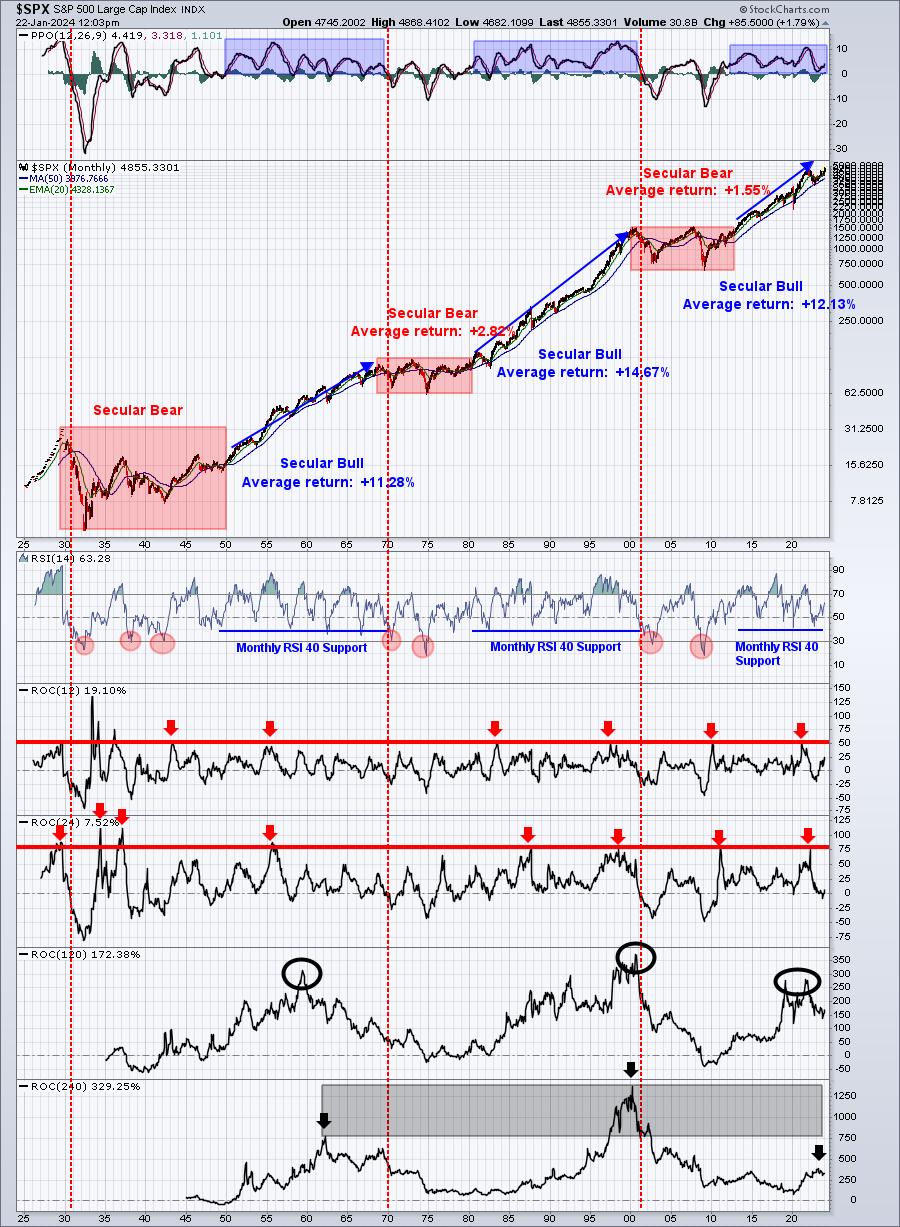
I will often times keep us grounded and discuss short-term issues that might make me cautious from time to time, but please make no mistake about it. I am VERY BULLISH about the prospects of the U.S. stock market as we dive into 2024 and beyond. When the waters truly get treacherous, I'm perfectly able to put on my bear cap. But constantly betting against the stock market is one MASSIVE mistake.
Sentiment
Let's start with the Volatility Index ($VIX). First and foremost, the VIX resides around 13.50 right now. The S&P 500 has a history of performing exceptionally well, so long as the VIX remains below 20. I prefer it to be below 17. Also, as many of you know, I like to monitor the VIX and its correlation to the S&P 500. This VIX:SPX correlation is expected to be inverse at nearly all times, but we do have to be aware of times when these two indices correlate positively as it can provide us a reversing signal in the stock market. Here's how this correlation currently looks:
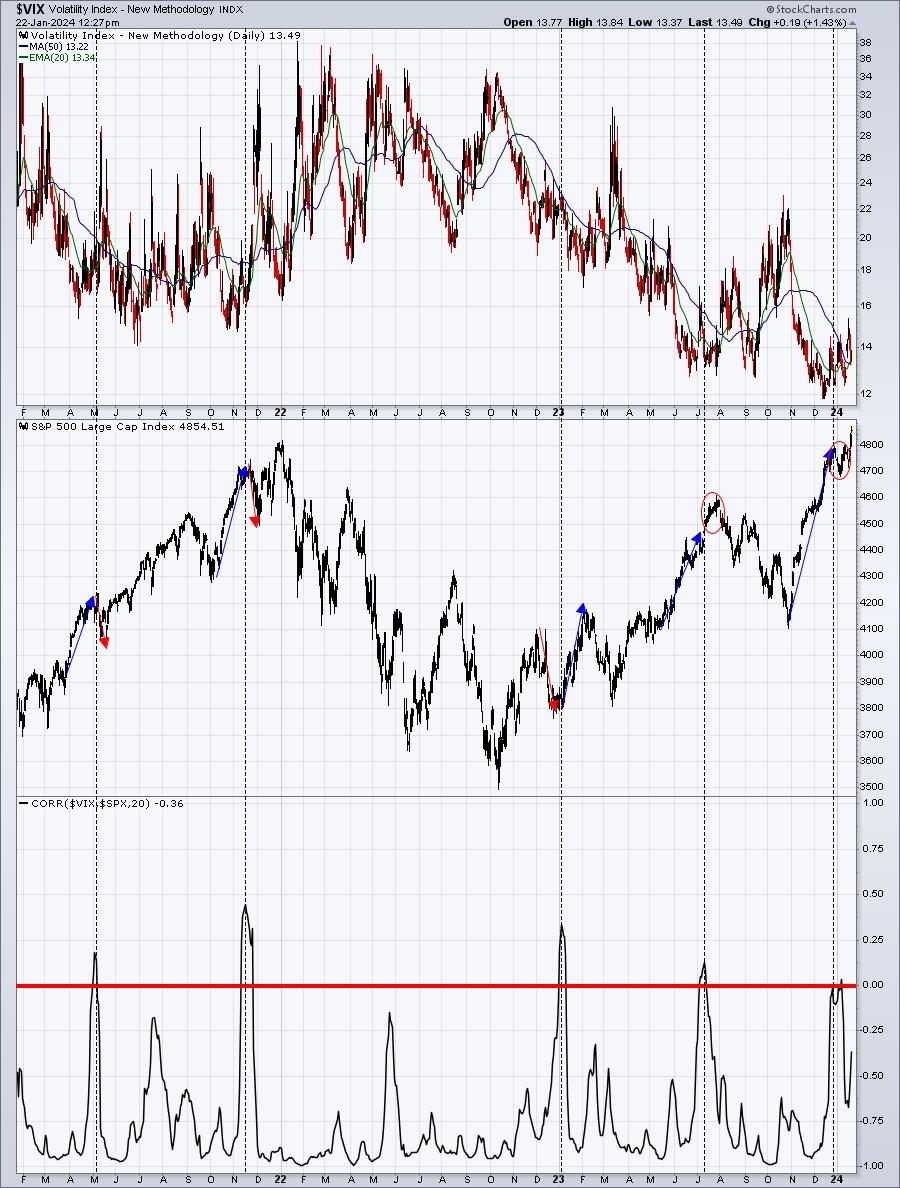
We've only seen this positive correlation 5 times in the past 3 years, so it's not something that we need to spend a lot of time watching. However, it's not normal to see the VIX go up WITH the S&P 500. Usually, rising S&P 500 prices calm the market down. So when the VIX shows that fear is actually picking up during a market rise, the story it's telling me is that fear is building and the market may not handle bad news very well. You can see that the first 3 correlation trips above zero coincided almost immediately and perfectly with a sudden reversal in the S&P 500. I'd say the 4th signal in July 2023 was questionable at best, because the reversal didn't begin until almost two weeks later. The last signal appears to have worked, sending the S&P 500 down temporarily, but that correlation is already starting to turn higher again. I doubt that we'll see it reach zero as that's not happened so soon after a previous positive correlation over the past 3 years.
Next, let's look at that long-term sentiment indicator, the 253-day moving average of the equity only put call ratio ($CPCE). I don't look at this often as it's my "ocean liner" type of indicator. It takes a lot of bullishness or bearishness to get this indicator turned around. But once it does turn around, the signals have been alarmingly accurate. Check this out:
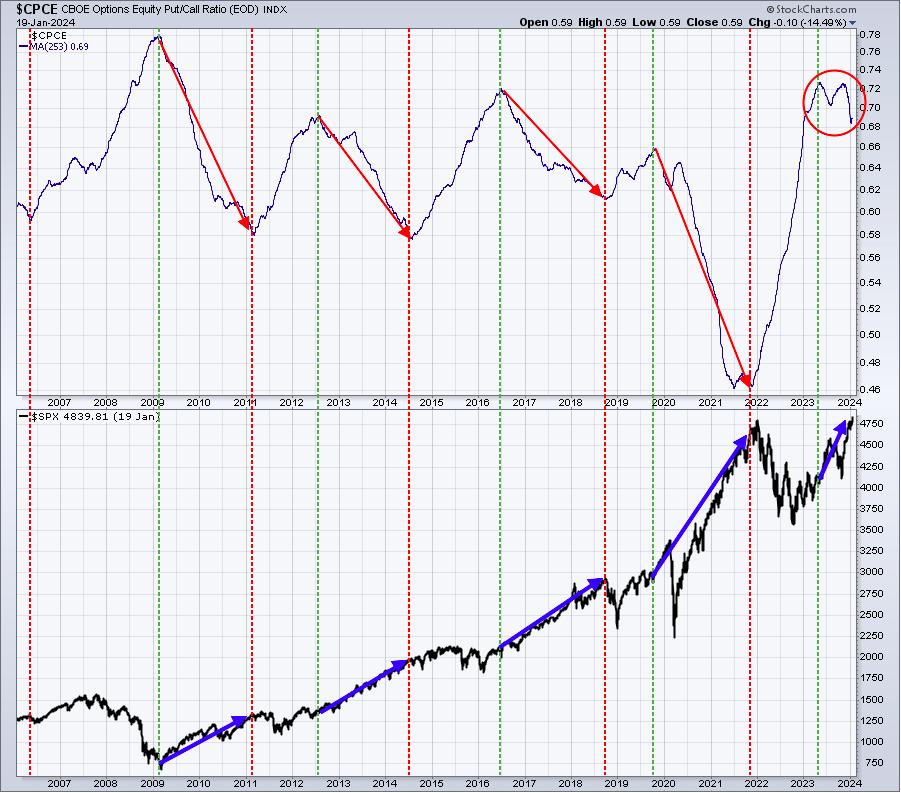
When this 253-day SMA of the CPCE tops and rolls over, it means that excessive fear is just starting to turn the corner and history tells us that for the next 1-2 years we should expect to see this long-term CPCE reading to fall much further, accompanied by a significant increase in the S&P 500. The above chart doesn't lie. I didn't make any of this up. It's how the stock market works. When the selling and fear is exhausted and we break to new all-time highs, the sentiment begins to change. And, as it does, stocks appreciate measurably. Bet against it at your own risk.
Rotation
Ok, so this week I want to show you the "under the surface" rotation that's taking place right now. The "above the surface" signal is much different, which is why we always dig deeper than most every other analyst on the planet. Also, Wall Street analysts have no incentive to show up on CNBC and tell us how they're currently rotating their portfolios. If they did so, their "audience" of retail traders might actually outperform the big Wall Street firms. Think that's going to happen? If so, I have a few bridges I'd like to sell you.
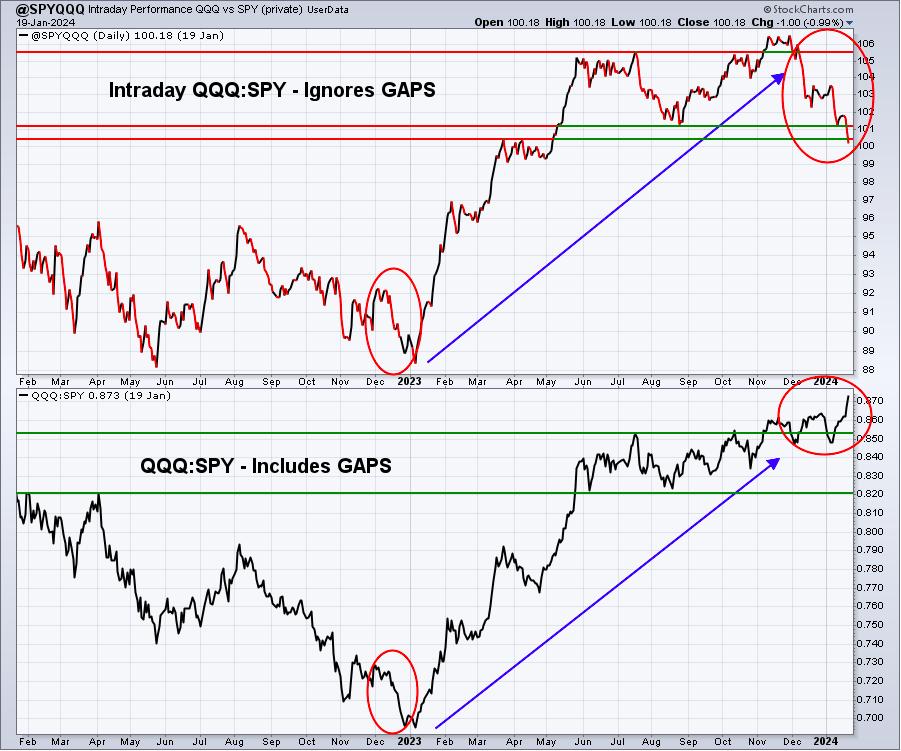
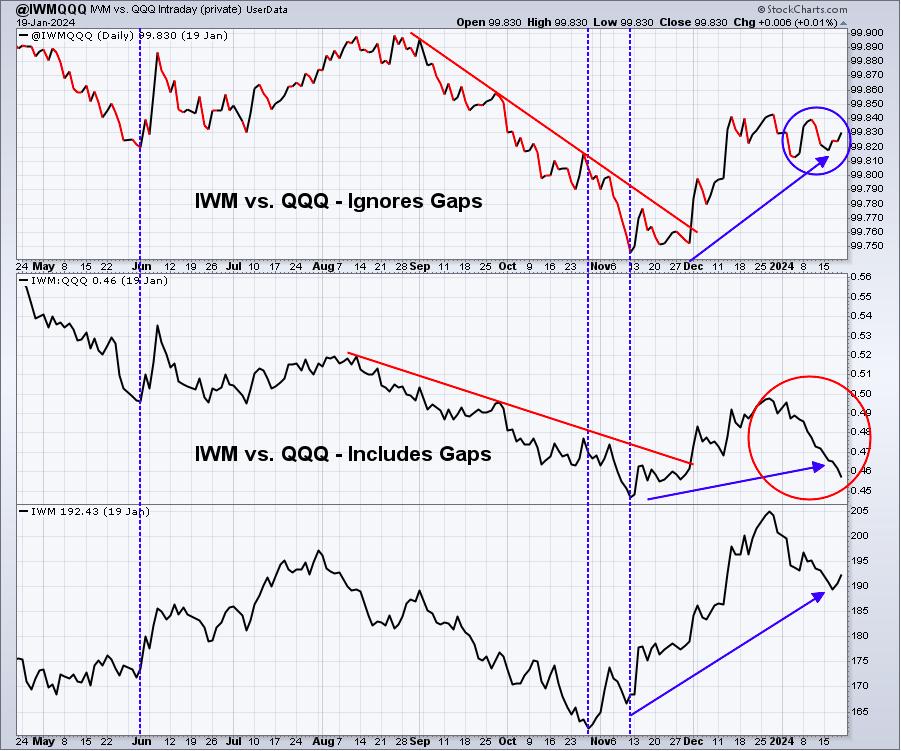
On the surface, the QQQ continues to perform the best, then the SPY, then the IWM. Nothing has changed. Or has it? If we ignore gaps and simply look at what's taking place from the opening bell to the closing bell, I see a much different picture. Check out these two relationships:
QQQ:SPY
IWM:QQQ
Let me clarify one thing before I start here. The QQQ:SPY chart is named "@SPYQQQ". This is just a name. It does NOT reflect how the ratio on the chart is calculated. I simply picked the wrong name for this chart in my User-Defined Index at StockCharts.com. I should have named it "@QQQSPY" to eliminate confusion, but I wasn't smart enough at the time to do that. The actual calculation tracks the relative value when we divide the QQQ by the SPY.
The chart appearance is VERY different, depending on if you include the opening gaps or simply review the rotation during the trading day. The QQQ:SPY that includes gaps shows the QQQ continuing to dominate the SPY, breaking to yet another high. But the intraday action is MUCH, MUCH different as it appears Wall Street firms are rotating FROM the QQQ and into the SPY. Are they manipulating us? My short answer is YES. I saw this type of manipulation when I called the market bottom in June 2022. At that time, the QQQ was seeing significant gap DOWNS and early morning selling, followed by HOURS of intraday accumulation. History tells us now that Wall Street accumulated, while retail traders panicked out of the aggressive QQQ. Imagine that, Wall Street taking advantage of the retail trader! The above looks to me like the sequel to last summer's manipulation as Wall Street moves into areas outside of technology.
Next, look at the IWM:QQQ chart. I see something very similar. When we include gaps, it appears that the IWM is getting absolutely trounced by the QQQ. However, if I only consider what happens during the trading day, the IWM has been holding up relative to the QQQ quite well.
So.....is Wall Street rotating into other areas that could lead us higher in 2024? Well, if you were at MarketVision 2024 earlier this month, then you know I'm calling for small caps to show much better relative strength in 2024. On the surface, that hasn't happened yet, but the intraday signals continue to support that call.
The stock market is certainly interesting, if nothing else!
Trade Setup
Since beginning this Weekly Market Report in early September, I've discussed the long-term trade candidates below that I really like. Generally, these stocks have excellent long-term track records. Only in very specific cases (exceptions) would I consider a long-term entry into a stock that has a poor or limited long-term track record. Check these out:
- JPM
- BA
- FFIV
- UPWK (exception, limited history) - a heavy volume push through 16 would be very bullish
- MA
- GS - breaking trendline resistance near 350-355 would be very bullish
- FDX
- AAPL
- CHRW
- JBHT
- STX
- HSY
- DIS
- MSCI
Recent weakness is lending an opportunity to buy into Starbucks, Inc. (SBUX). In May 2023, SBUX nearly touched 114, and at November's more recent high, SBUX reached the 107 level. Currently, SBUX has dropped back t0 93 and change. As I mentioned in my Trading Places blog article at StockCharts.com over the weekend, SBUX pays a nice 2.43% dividend and has increased its dividend by an AVERAGE of nearly 18% since the secular bull market began in 2013. That dividend increase has slowed recently, but still it rose by 8-9% the past few years. Here's the long-term quarterly chart of SBUX, highlighting that serious dividend boost over the past decade:
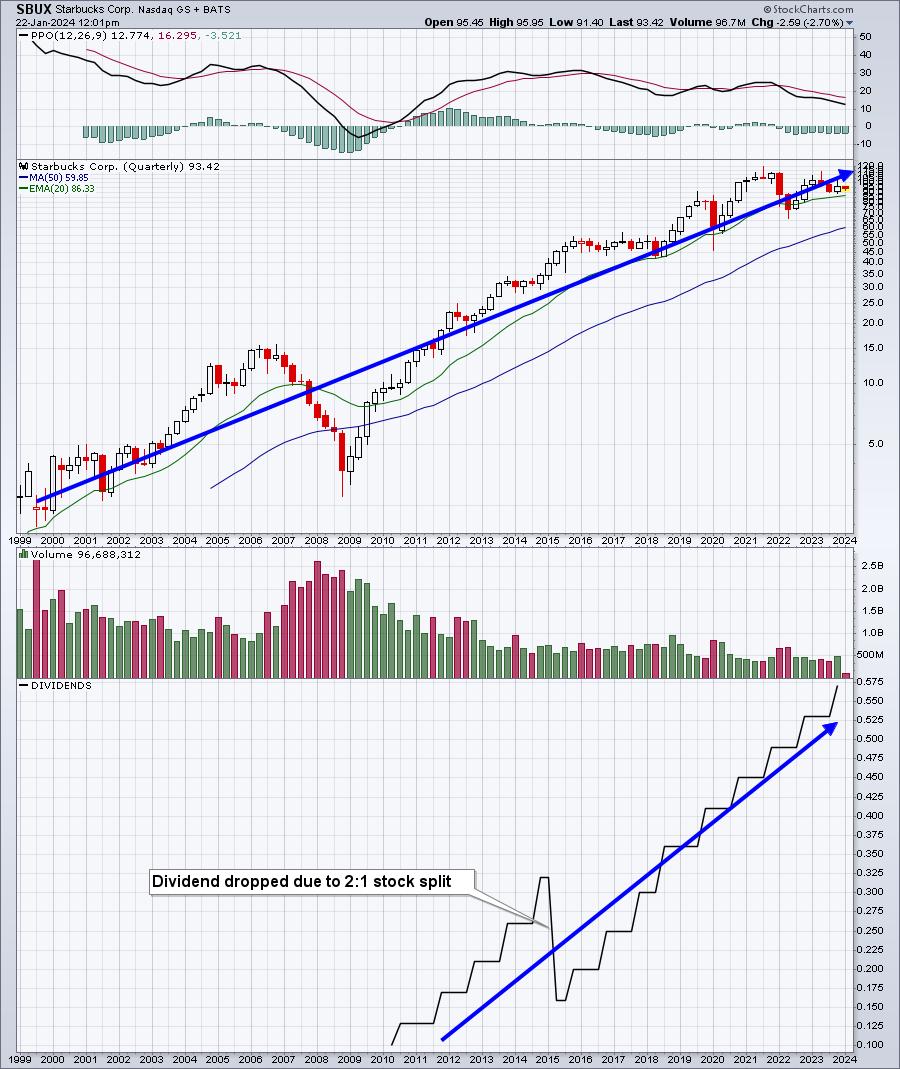
This period of consolidation provides long-term investors an opportunity to buy SBUX well off its highs, while at the same time locking in a nice dividend that has a recent history of rapid increases.
I will be looking to add a technology company or two over the next several weeks if we see a period of selling ahead in this aggressive sector. Based on Presidential Election year cycles that suggest bottoms in March, adding a company sometime in March may make good sense.
Looking Ahead
Upcoming Earnings:
Banks have represented the bulk of quarterly earnings released thus far I've identified what I believe are key companies that will report this week, with their respective market caps in parenthesis. This is NOT a list of ALL companies reporting this week, so please be sure to check for earnings of any companies that you own or add. Any companies in BOLD represents stocks on one of our Portfolios:
- Monday: BRO ($21 billion), LOGI ($15 billion)
- Tuesday: JNJ ($388 billion), NFLX ($212 billion), GE ($140 billion)
- Wednesday: TSLA ($674 billion), ASML ($294 billion), NOW ($153 billion)
- Thursday: V ($492 billion), INTC ($197 billion), KLAC ($80 billion)
- Friday: AXP ($131 billion), CL ($67 billion), NSC ($53 billion)
Key Economic Reports:
- Monday: December leading indicators
- Tuesday: None
- Wednesday: January PMI composite flash
- Thursday: Initial jobless claims, Q4 GDP (initial reading), December durable goods, December new home sales
- Friday: December personal income and spending, December pending home sales
Historical Data
I'm a true stock market historian. I am absolutely PASSIONATE about studying stock market history to provide us more clues about likely stock market direction and potential sectors/industries/stocks to trade. While I don't use history as a primary indicator, I'm always very aware of it as a secondary indicator. I love it when history lines up with my technical signals, providing me much more confidence to make particular trades.
I'm now providing a bigger window into the historical numbers ahead. Below you'll find the next two weeks of historical data and tendencies across the 3 key indices that I follow most closely:
S&P 500 (since 1950)
- January 22: -11.69%
- January 23: +37.99%
- January 24: -14.97%
- January 25: +8.02%
- January 26: +30.43%
- January 27: +7.75%
- January 28: +54.14%
- January 29: +17.60%
- January 30: +2.58%
- January 31: +83.19%
- February 1: +42.23%
- February 2: +41.30%
NASDAQ (since 1971)
- January 22: -41.47%
- January 23: +94.02%
- January 24: -25.10%
- January 25: -6.77%
- January 26: +49.57%
- January 27: -43.49%
- January 28: +82.12%
- January 29: +6.92%
- January 30: -3.96%
- January 31: +104.47%
- February 1: +114.44%
- February 2: +26.77%
Russell 2000 (since 1987)
- January 22: -13.91%
- January 23: +108.86%
- January 24: +5.63%
- January 25: -1.77%
- January 26: +76.34%
- January 27: -99.42%
- January 28: +42.00%
- January 29: -15.02%
- January 30: -72.65%
- January 31: +135.91%
- February 1: +192.59%
- February 2: +27.66%
The S&P 500 data dates back to 1950, while the NASDAQ and Russell 2000 information date back to 1971 and 1987, respectively.
The most bullish period of the calendar year ended last Thursday (October 27th close through January 18th close). It's worth mentioning at this point that the first half of calendar quarters historically have performed MUCH better than the second half of calendar quarters. So when earnings season slows and we move past the middle of February, we need to be aware that we're moving into a period where performance drops off considerably - at least based on history.
Final Thoughts
Given the breakout on the S&P 500, it appears as though the market path might look like what we talked about at MarketVision 2024. I suggested that the S&P 500 would likely head a bit higher to possibly even threaten 5000. I also mentioned that Presidential Election years have a history of finding lows in March. So there's a solid chance we remain quite strong through earnings season before turning lower. Of course, we do still have negative divergences on the daily charts of both the S&P 500 and NASDAQ 100. There is most definitely more than one path to eventual higher prices across our major indices. :
- Rotation. Yes, technology and the red-hot NASDAQ 100 continue to lead. At some point, though, money will rotate away from this sector and index and where it goes will be of utmost interest to me. Does it just leave the market and we see a short-term selloff? Or does it simply rotate to other areas that have been lagging in 2024, like financials (XLF), mid caps (MDY), and small caps (IWM)? I'm expecting the latter. Bull markets are notorious for constant rotation amidst new money inflows. The rallies are jaw-dropping. We saw that in November/December and then again recently as the S&P 500 blew through its overhead resistance near 4800 to set new all-time highs.
- Earnings. The Q4 earnings season is just getting started and a few BIG names will be reporting the next few days. Netflix (NFLX) and Tesla (TSLA) report Tuesday and Wednesday, respectively. A few big semiconductor names will also be reporting this week, including ASML, TXN, INTC, and KLAC, and this group has been on fire. Current prices need to be supported by excellent quarterly results, so the pressure is on for this very influential group.
- 10-year treasury yield ($TNX). I view the current range on the TNX to be roughly 3.80%-4.20%. On Friday, the TNX touched 4.20% and the 50-day SMA, currently at 4.17%, before backing down. We've since moved lower today and are now at 4.10%.
- Sentiment. I wrote about it above, but that falling 253-day SMA of the CPCE is very encouraging and supports the idea that we're going to rally in 2024.
- Negative Divergences. We're not out of the woods here. It's so difficult to predict market action over the next day or two or couple weeks. I can get a pretty good sense of what the stock market is telling me from a long-term perspective, but short-term action can be extremely volatile. Divergences can play a role in predicting short-term movement, no doubt, but like everything else, there are no guarantees.
- Semiconductors. Their moves can be powerful and quick and both of these adjectives perfectly describe what we've seen in this group over the past couple weeks. If this turns into a "buy on rumor, sell on news" type of event for semis, retail traders may be slow to react to the intraday rotation that we're already seeing. And semiconductors can pull back just as hard and quick as they go up.
Feedback
If you'd like to share your thoughts on our Weekly Market Report, positive or negative, you can reach us at "[email protected]".
Happy trading!
Tom