
EB Weekly Market Report - Monday, February 5, 2024
ChartLists Updated
Several ChartLists have been updated on our website since Friday:
- Strong Earnings (SECL)
- Strong Future Earnings (SFECL)
- Raised Guidance (RGCL)
- Bullish Trifecta (BTCL)
- Upcoming Earnings (5)
Weekly Market Recap
Major Indices
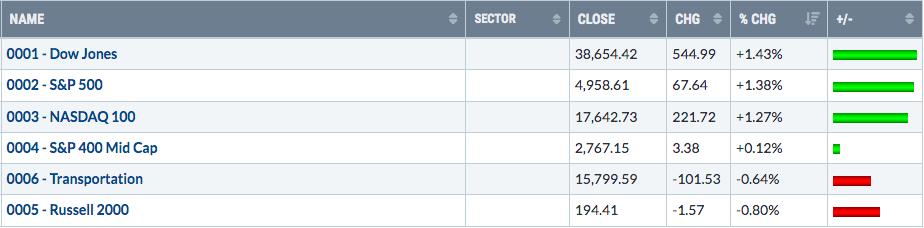
Those top 3 indices from last week not only posted nice gains, but also closed on Friday at all-time highs. It hasn't been across-the-board strength as small caps continue to lag on a relative basis. We're still looking at negative divergences on the Dow Jones, S&P 500, an NASDAQ 100 daily charts. Here's the latest look at the NDX:
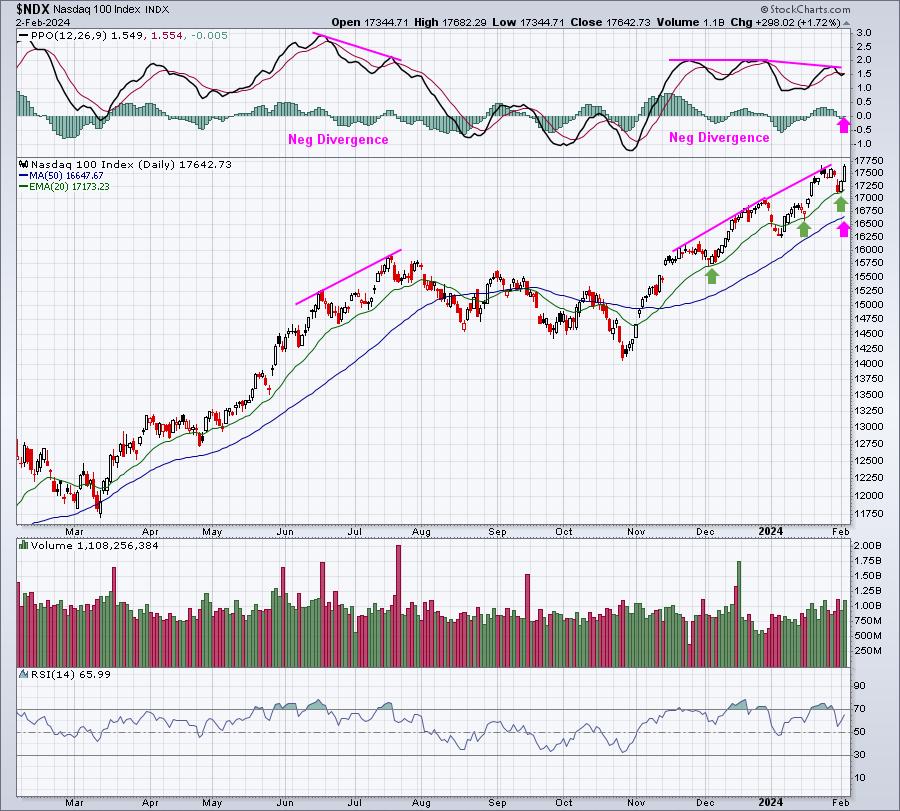
We do need to respect yet another price breakout to an all-time high, especially since volume increased to confirm the breakout. But the negative divergence has not been eliminated. It feels as though we're ready for a pullback, although betting against a secular bull market advance can be financial suicide. For me, that means I don't short.
Personally, I'm remaining long, but avoiding leverage (double & triple ETFs, options, etc.)
Sectors
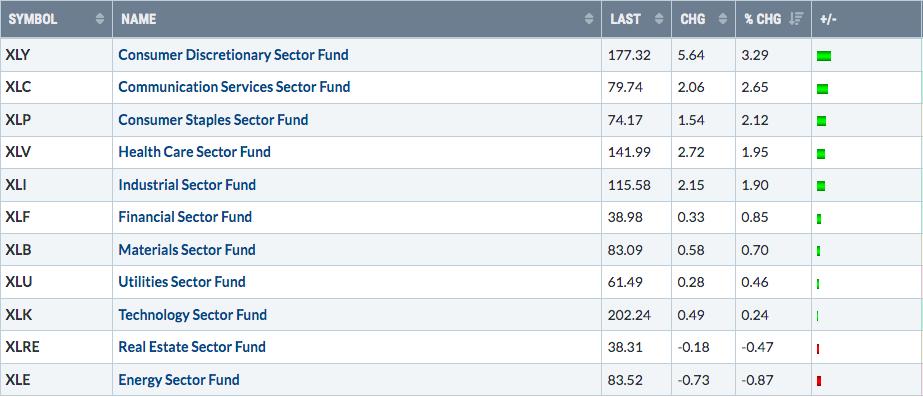
Consumer discretionary had an excellent week and broke out of a bullish wedge pattern. This typically results in further strength ahead. Check out the chart:
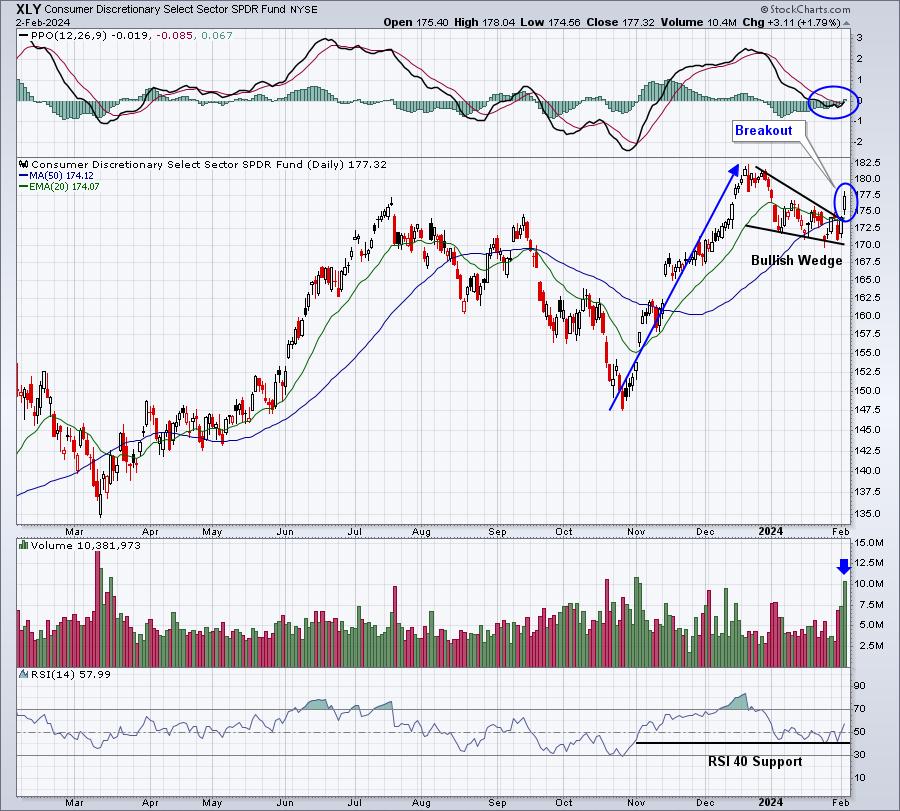
After underperforming for a few weeks, the XLY appears to be back. I love the RSI holding 40 support and now bouncing. Friday's breakout of the bullish wedge was accompanied by excellent volume - one of the highest volume days over the past year. Also, the recent wedge that formed occurred as the PPO stabilized near its centerline. This looks like a sector that can take the baton for the next leg of the bull market.
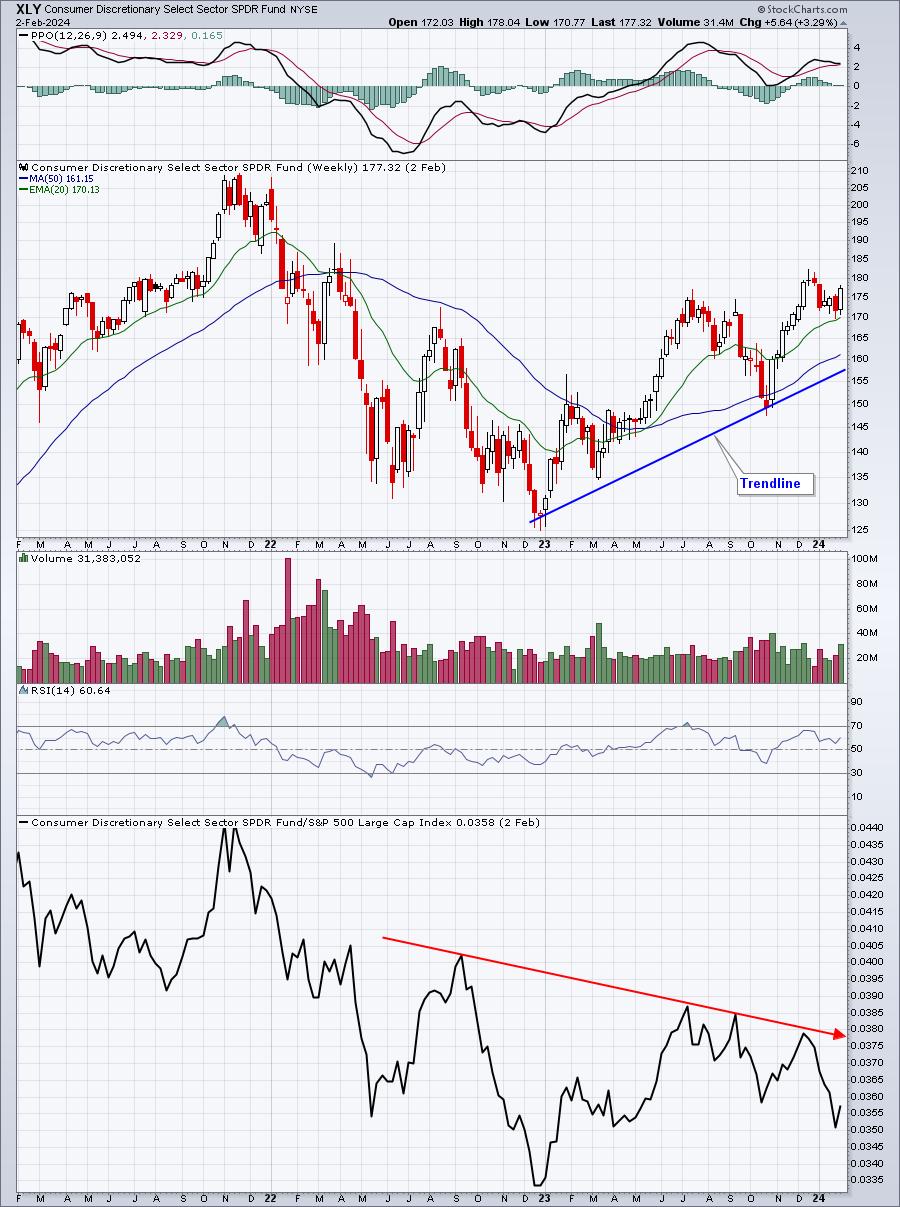
But then I look at the XLY weekly chart and I'm still waiting to see that XLY:$SPX relative strength line trend higher, rather than lower:
Top 10 Industries Last Week
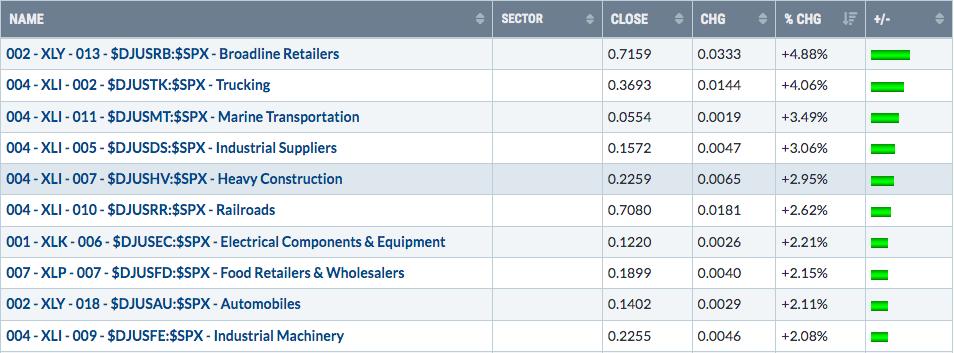
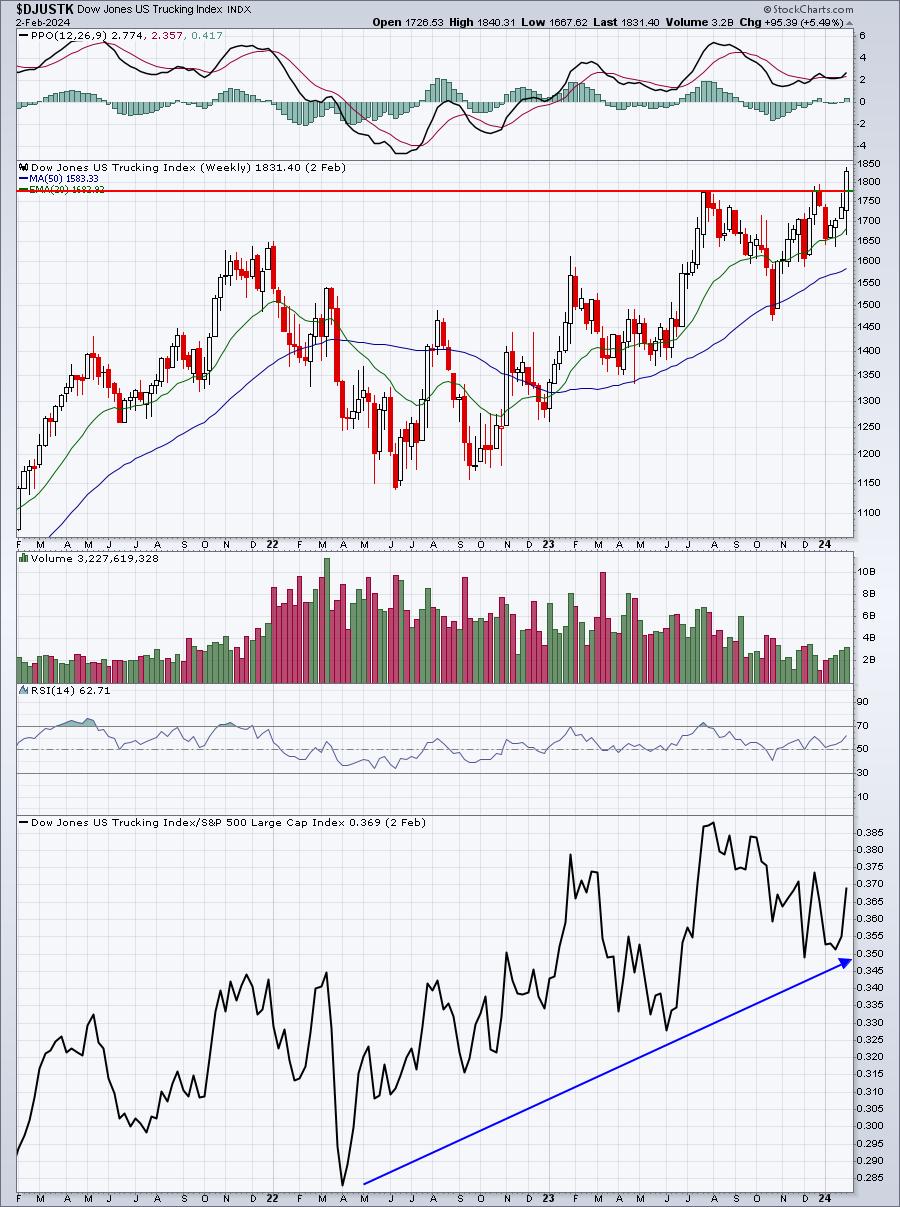
Certainly one bullish signal is seeing both truckers and railroads on this list above. They've not only performed well over the past week, but 2024 seems like it could be an excellent year for both groups. Check out these two charts and the recent breakouts:
Trucking ($DJUSTK):
Railroads ($DJUSRR):
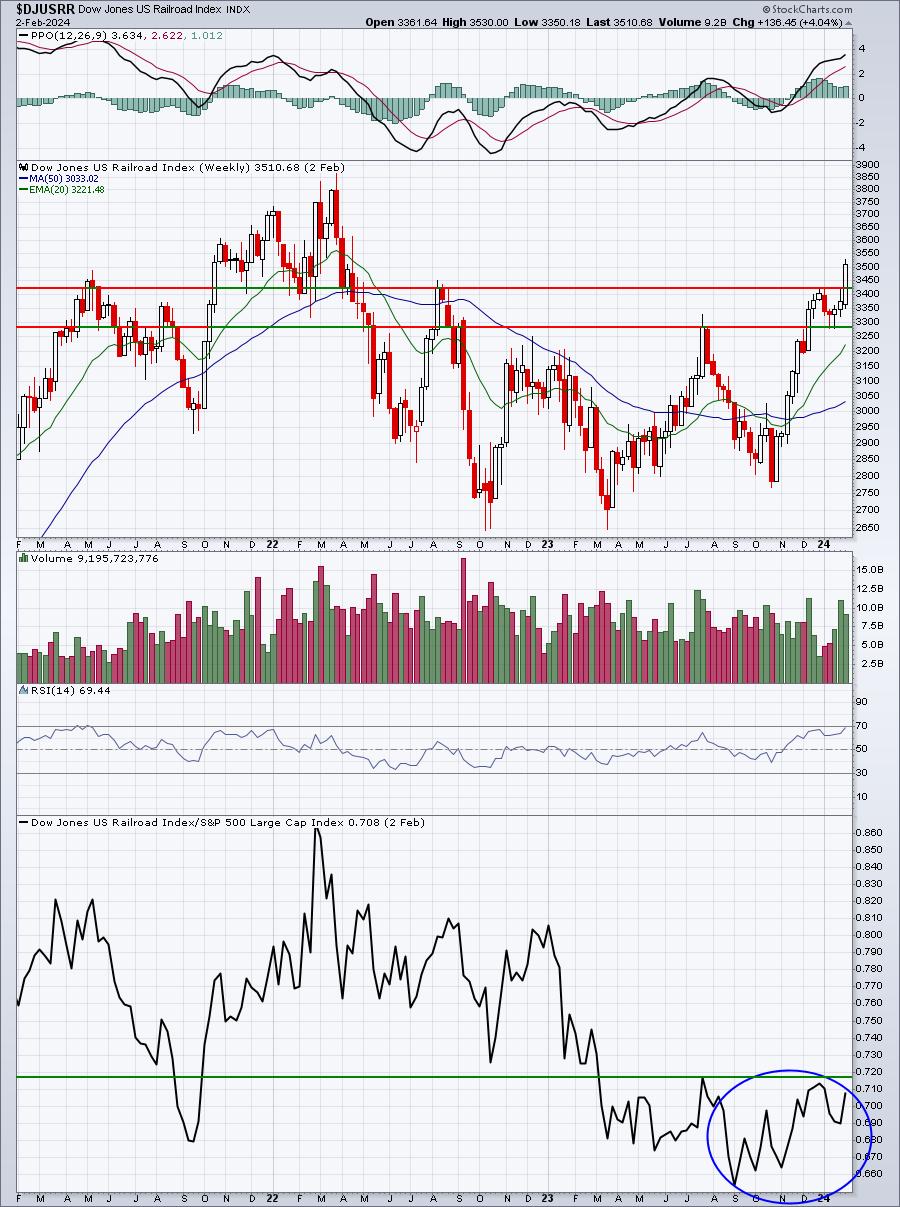
Trucking's strength, particularly relative to the S&P 500, is undeniable. Railroads, on the other hand, appear as though their relative strength may just be getting started. Clearing 0.720 relative resistance is the short-term key.
Bottom 10 Industries Last Week
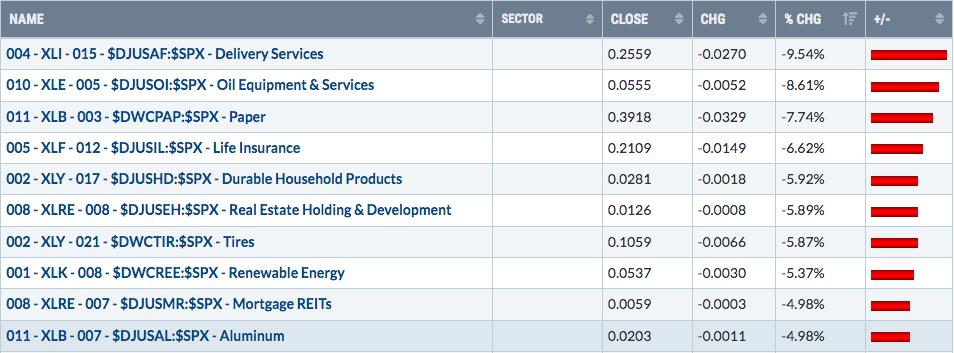
Life insurance ($DJUSIL) broke down beneath its 50-day SMA last week, but it's now testing what I believe is very significant price support. The DJUSIL had a triple top from August, September, and October of 2023, before finally breaking out in December. We're now backtesting that breakout level:
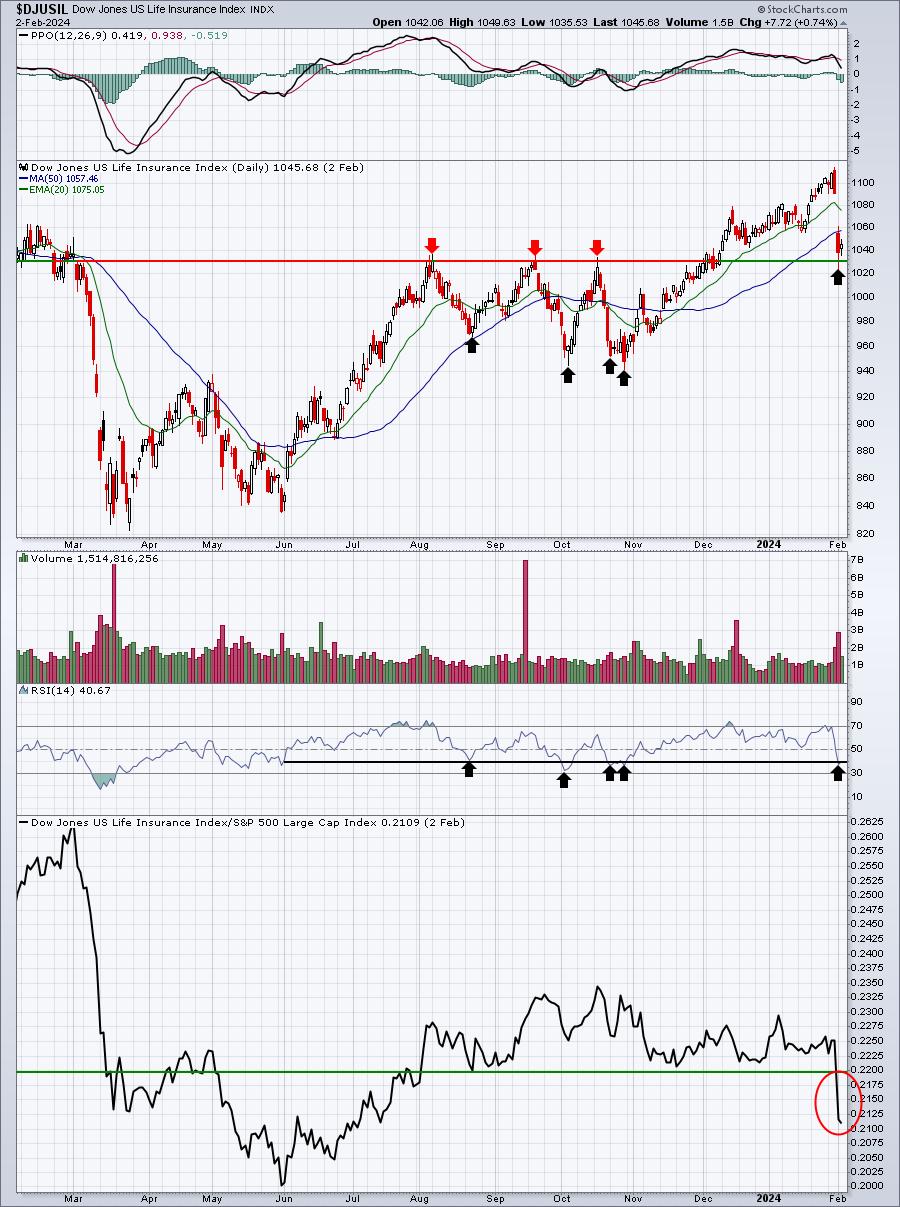
That bottom panel shows a breakdown in relative strength, so it's not all bullish on this chart. But I like RSI at 40, price at key support, and a PPO that remains above the centerline.
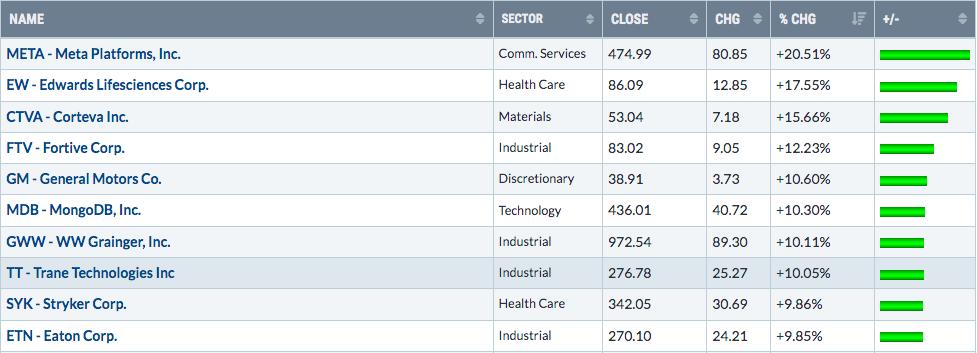
Top 10 Stocks - S&P 500/NASDAQ 100
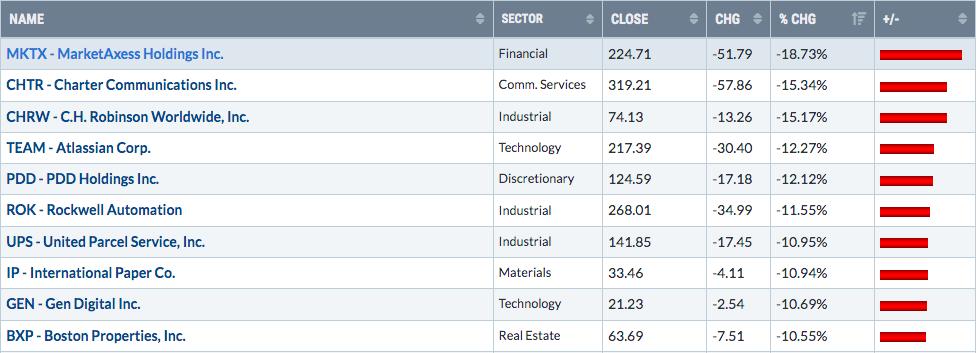
Bottom 10 Stocks - S&P 500/NASDAQ 100
Big Picture
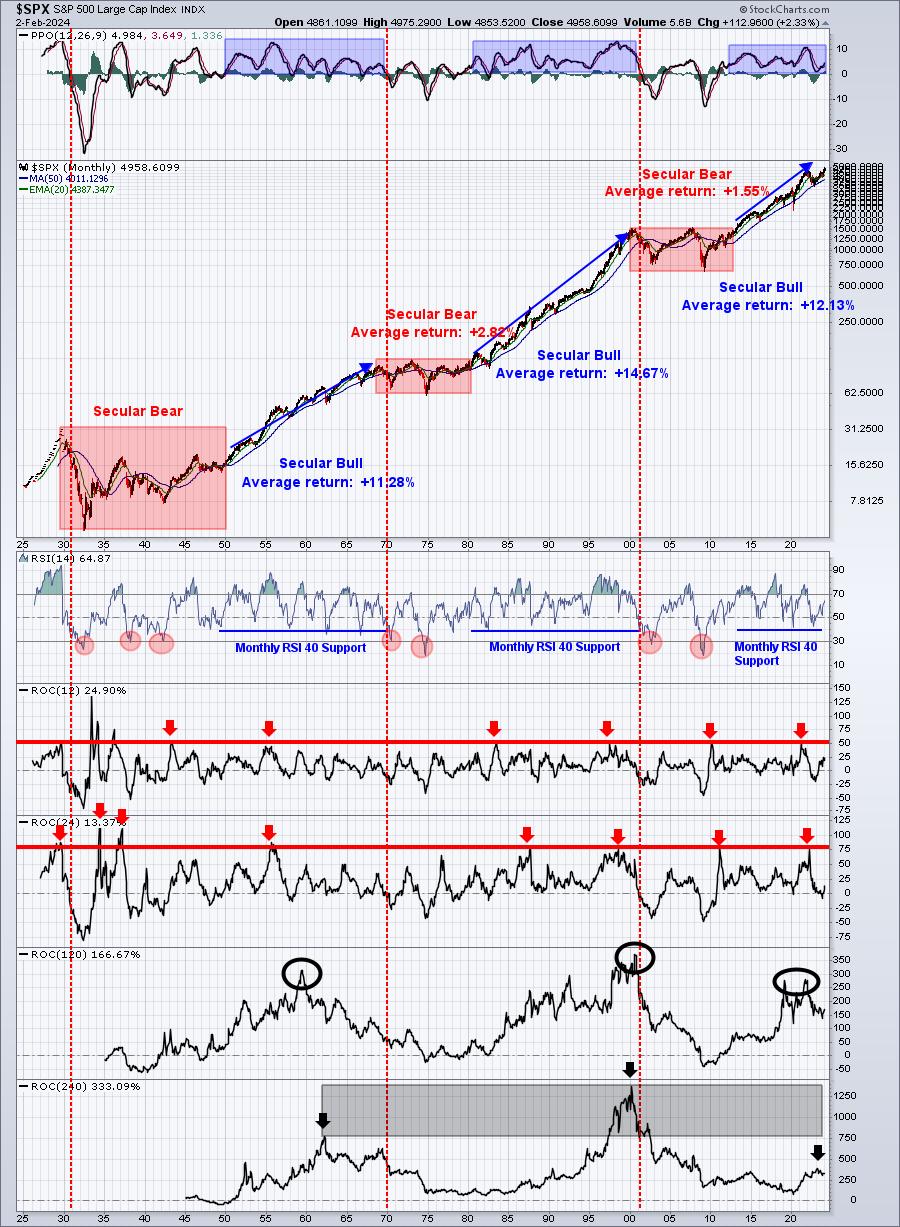
It's hard to argue with this chart, period. This secular bull market has risen to new heights and who's to say how far it'll go. Why not just ride it? Yes, I'm a little cautious near-term, because of history. I know that February isn't a great month. I know that Q1 does much better during the first half of the quarter (Jan 1 - Feb 15) than it does the second half (Feb 16 - Mar 31). I know that during Presidential Election years, February and March can be problematic. But these are all stand-alone signals. They guarantee us nothing.
The long-term chart doesn't care about all of this noise. That's why, no matter how loud the short-term noise gets, I remain fully invested. Unless you're in a cyclical or secular bear market, the chart below SCREAMS at us to remain long. And I don't believe we're in either a cyclical or secular bear market. In fact, I fully believe the S&P 500 will close out 2024 at an all-time high - or at least very close to one.
Here's the long-term picture that we need to be reminded of periodically:
Sentiment
I only use the Volatility Index ($VIX) in a couple ways. I know that the lower the VIX is, the better the S&P 500 performs. This was a chart that I produced several weeks back, but it shows clearly how the S&P 500 has performed with the VIX at various levels:
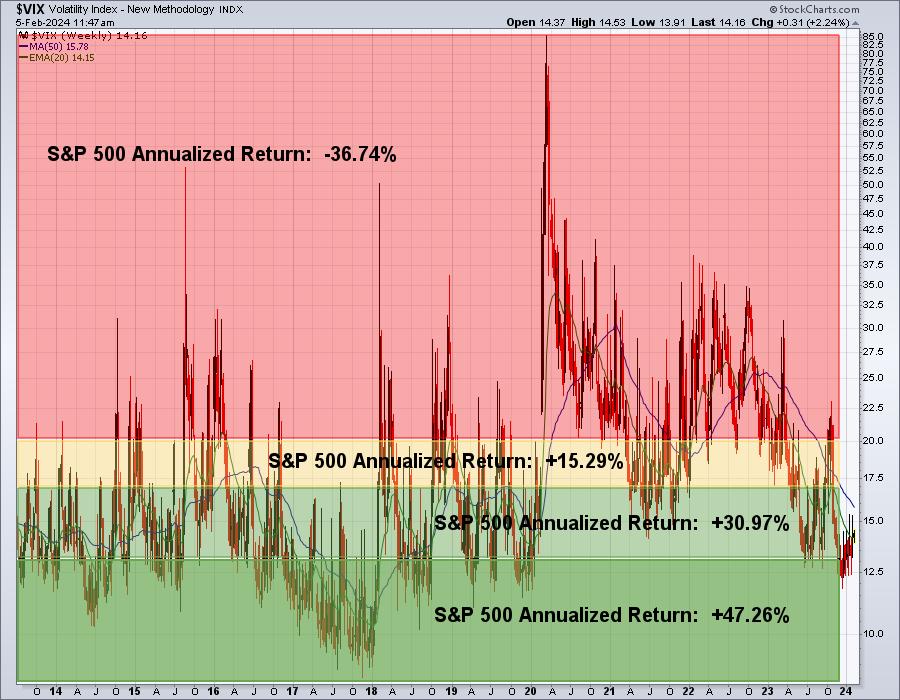
This was a chart that I included in a Trading Place blog article on November 26, 2023. You can see, without a doubt, that the S&P 500 performs best when the VIX is below 13. It also performs quite well when the VIX resides in the 13-17 range. It's really not until the VIX hits 17, and especially 20, that we need to worry about S&P 500 performance. Folks, these are the numbers throughout the current secular bull market advance. It's fact.
Here's something else to consider. The VIX was at 12.46 at the time I wrote this November article. Today, the VIX was 14.16 at 11:47am ET. It's up nearly 2 points since that November 26th article, yet the S&P 500 has climbed from 4559.34 to well over 4900. Many bears believe that when the VIX is low, like that 12.46 level on November 26th, it's a bearish signal, because the VIX is low and will rise at some point, spelling trouble for the stock market. It doesn't work that way. The rise in the VIX does usually coincide with S&P 500 weakness on a very short-term basis. But a rising VIX below 17 is MUCH, MUCH different than a rising VIX above 17 or 20.
EMBRACE THE LOW VIX!
Now, we do have one issue with the VIX and it's a very short-term concern. More recently, the VIX and the S&P 500 have shown a tendency to move in the same direction, which results in its daily correlation to turn positive. Again, the "normal" behavior and relationship is for the VIX and the S&P 500 to move opposite one another, resulting in a correlation reading that typical sits close to -1. Check out the current reading and what that could mean for the S&P 500 short-term:
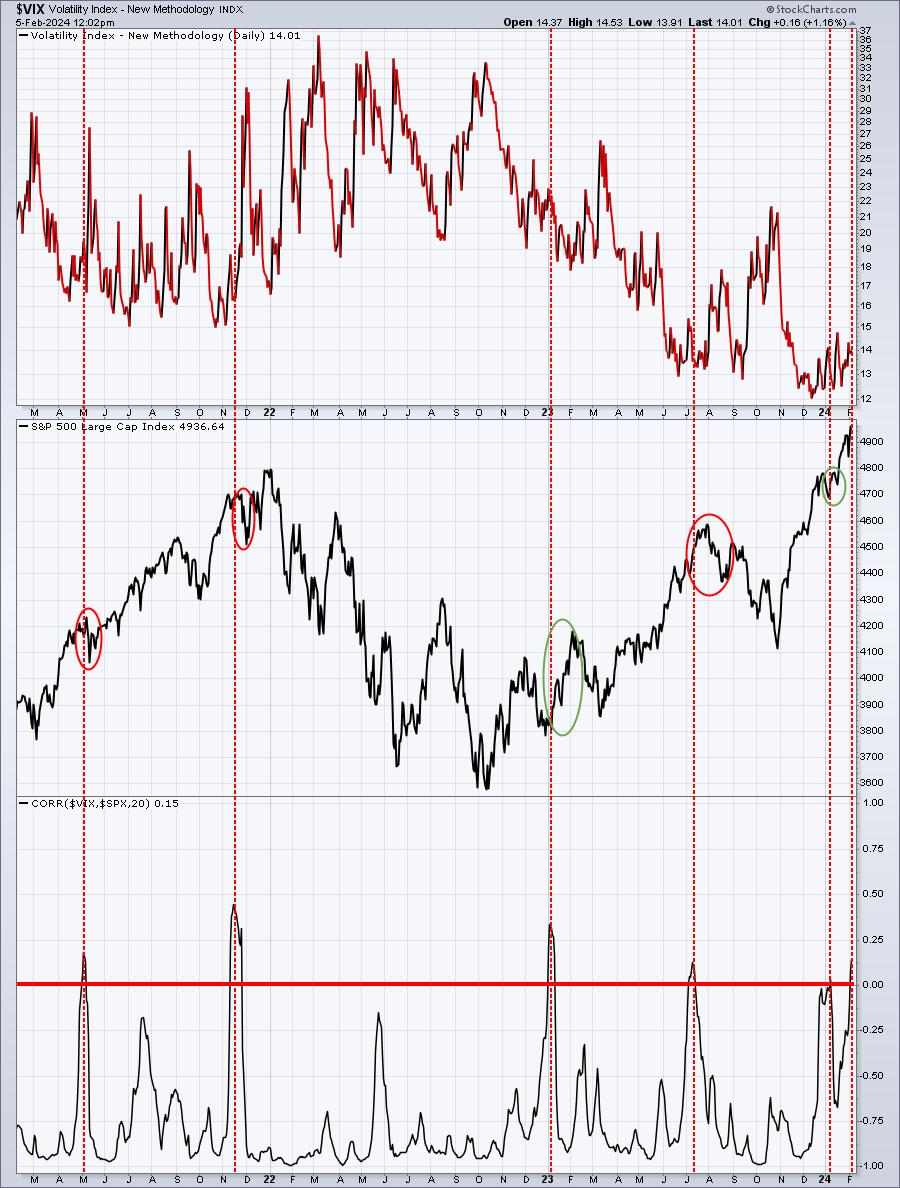
Positive correlation is quite rare, only happening 6 times in the past 3 years. It does serve as a warning that the current S&P 500 trend (currently higher) could reverse at any time. The signal is given at the peak in positive correlation. The current positive correlation is still climbing, so perhaps we see a bit more strength. While this provides us no guarantee, it's a sign that doesn't pop up very often and does have a solid track record. Note, however, that any reversal doesn't necessarily last a long time. Don't think of this as signaling a long-term top, but rather a short-term top. Any pullback in the 2-5% range would likely do the trick.
Rotation
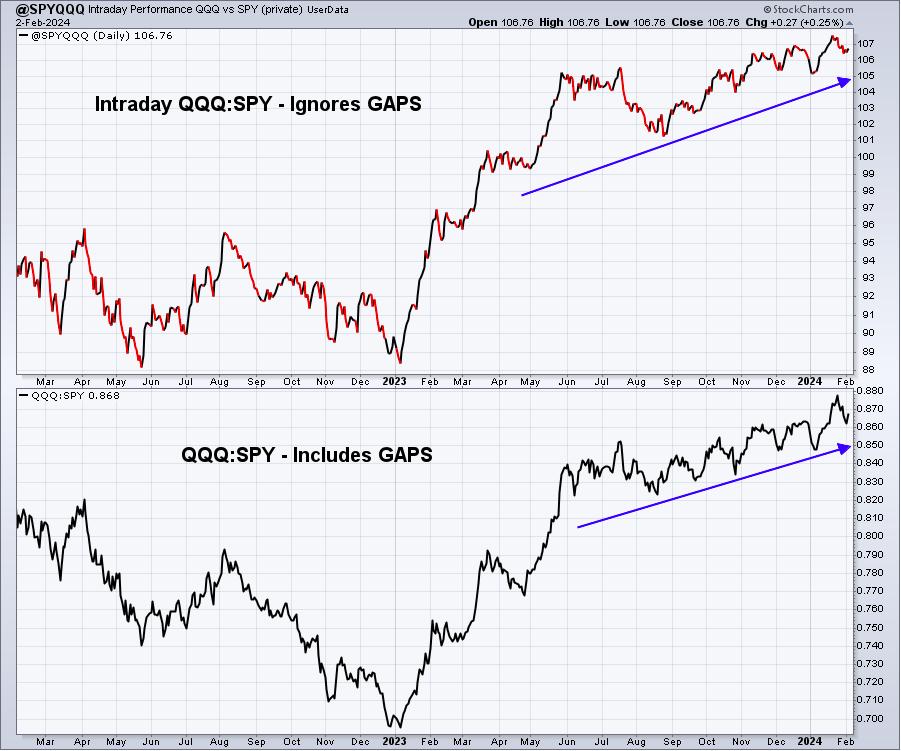
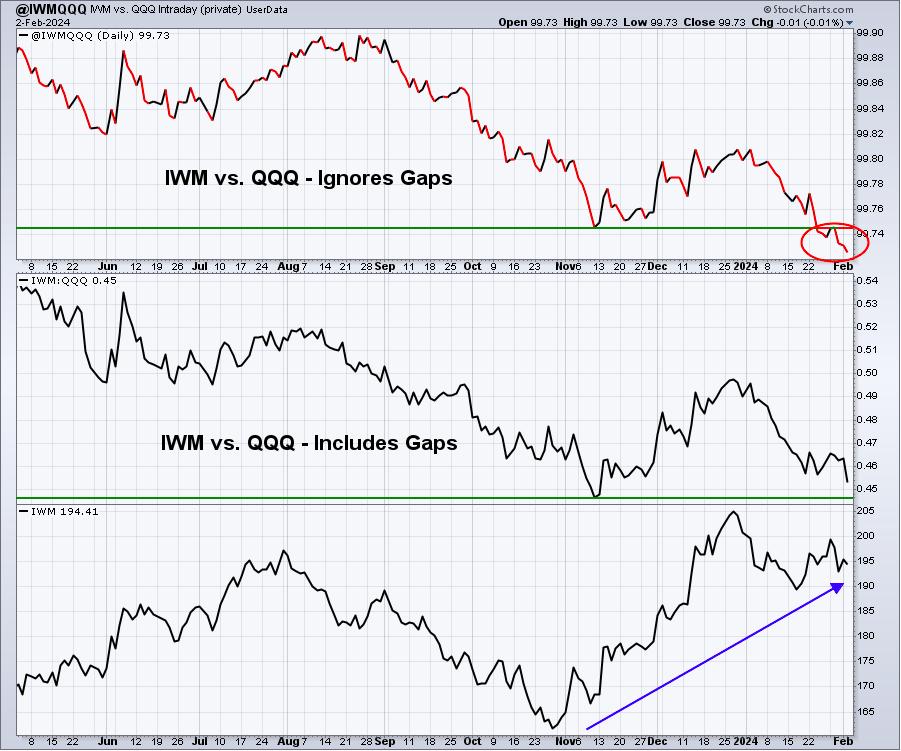
Last week, I reported that I had made errors in my "INTRADAY" charts that I track using the User-Defined Index at StockCharts.com. It resulted in the QQQ:SPY ratio being UNDER reported and the IWM:QQQ ratio being OVER reported. In both cases, the bottom line is that the QQQ was performing better on an intraday basis than what I had reported over the prior two months as the error began at the very end of November. Last week I circled the period that was in error, so I today I want to report on these ratios after the problem was fixed:
QQQ:SPY
IWM:QQQ
The XLY:XLP ratio did not contain the same error. This is how this ratio looks as of Friday:
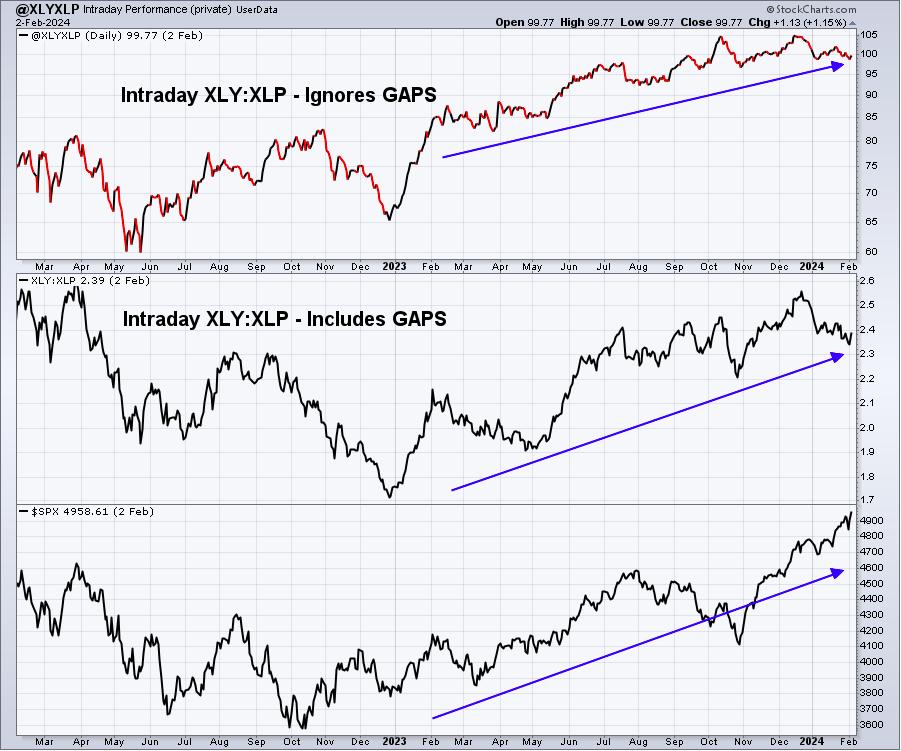
The corrections result in ratios that still favor the QQQ. There are plenty of other signals that suggest rotation is taking place, namely the performance of all sectors during the rally since the October 27th low. Here's a chart that I included in my Trading Places blog article over the weekend:
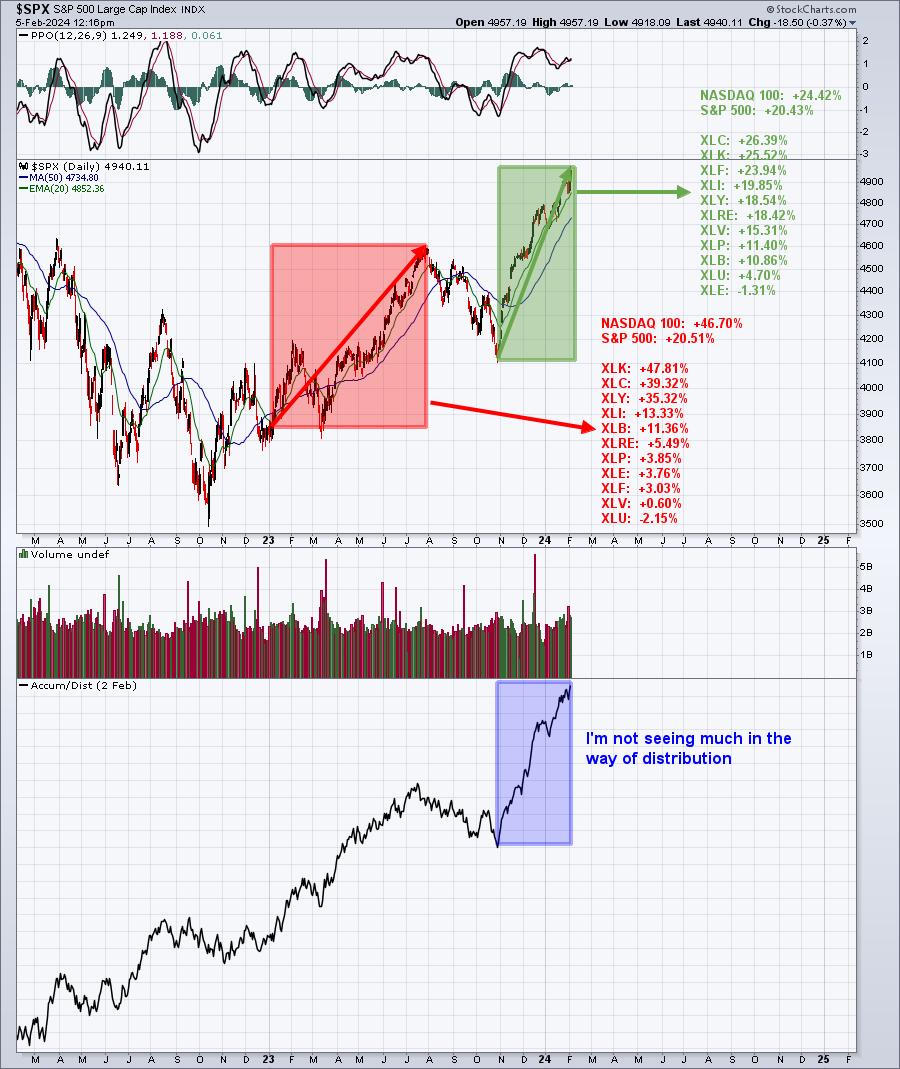
From this chart, you can see that the S&P 500's performance is close to that of the NASDAQ 100. That was not the case in the early 2023 rally. Also, check out the performance of all sectors during each rally. There's much wider participation in the current rally, indicating that MANY more stocks are participating and getting healthier on their own individual charts. That's a big deal, because IF money does begin rotating away from large cap tech names, there'll be plenty of healthy choices for institutions to invest in and remain fully invested.
One last thing about rotation. The regional banking ETF (KRE) has turned lower vs. the S&P 500 on the rally from the January 5th close. Check out this absolute and relative price chart of the KRE on a year-to-date basis:
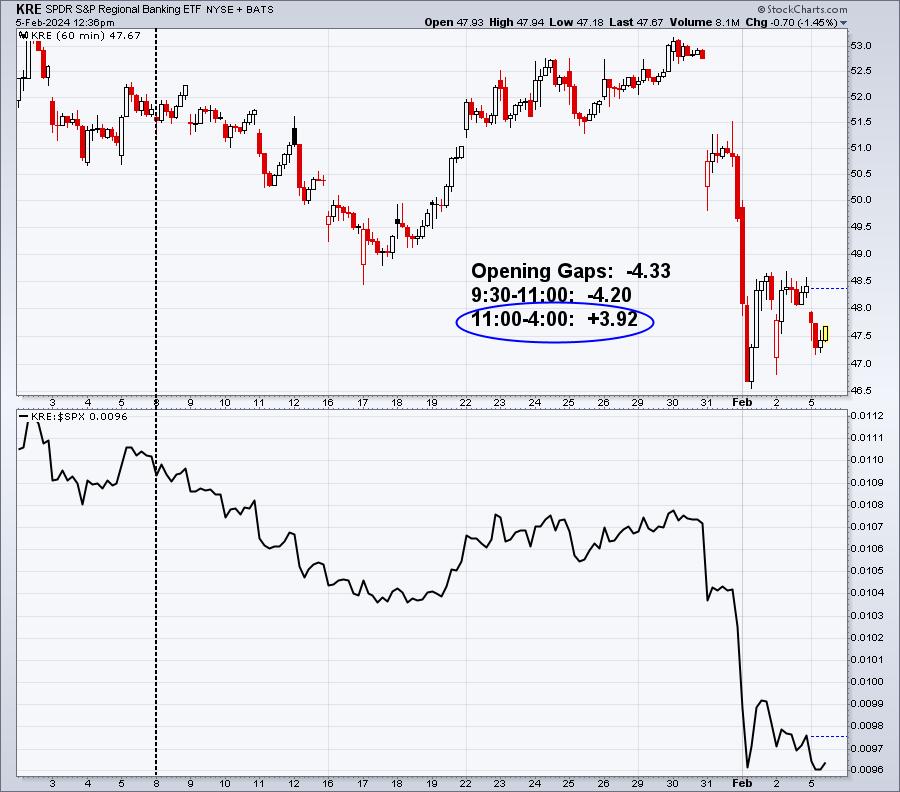
On the surface, the KRE is not performing well. However, if you recall how the QQQ traded during the latter stages of the 2022 cyclical bear market, I see very similar action above. Remember how the QQQ performed horribly at the opening bell and during the morning hours and then, suddenly, the bulls (market makers) came to the rescue in afternoon trading? That was a big reason I called a major market bottom in June 2022. The manipulation by Wall Street was off the charts! To a lesser degree, I see the same thing with banks right now. The chart doesn't look so great, but if we dig a little deeper, we can definitely see the possibility of the same market manipulation that later resulted in a QQQ surge. I believe banks will perform well in 2024 and the above KRE chart and intraday analysis supports my belief.
Interest Rates and the Dollar
I like to track the 10-year treasury yield here in the U.S. ($UST10Y) vs. Germany ($DET10Y). The net difference in yields helps to predict the direction of the U.S. dollar, which in turn can have dramatic effects on how materials (XLB) and energy (XLE) perform relative to the S&P 500.
So let's look at the latest in terms of the $UST10Y - $DET10Y:
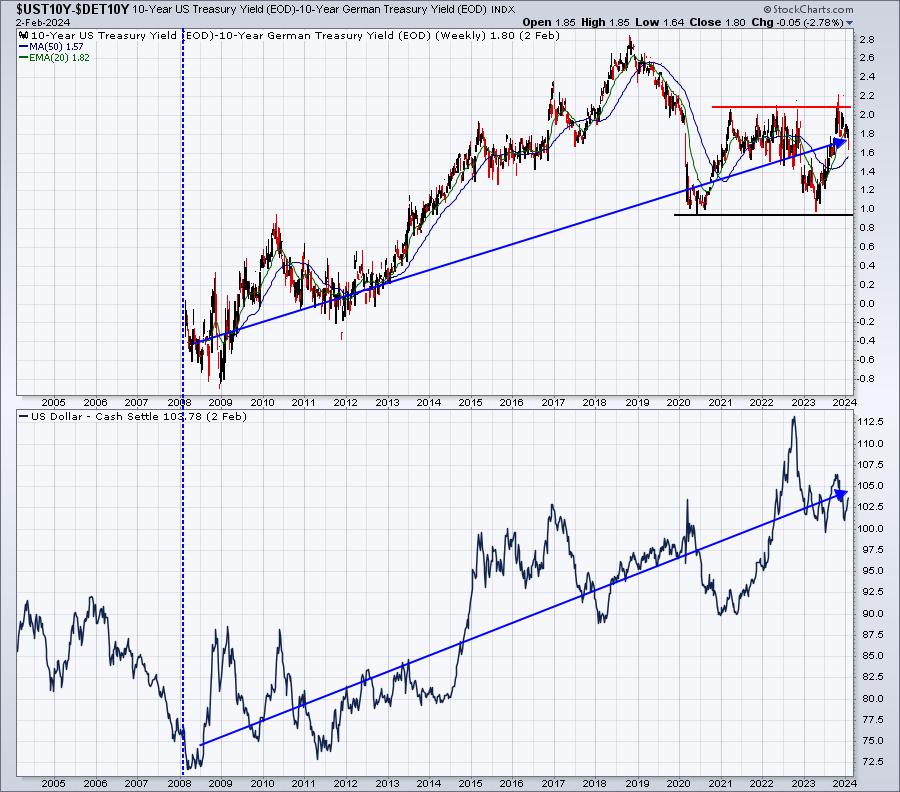
I've heard plenty of analysts discussing the U.S. Dollar Index ($USD), believing it's going to move lower. I just don't see it. It's been in a 15-year uptrend, so I need to see that uptrend reverse before I'd grow bearish the USD. The UST10Y-DET10Y has also been rising during this 15-year period. If this difference moves up and past the 2.2 level, it confirms the next leg higher in the dollar. It's way too early to make that call, but I'm certainly not going to bet against a 15-year trend higher.
Trade Setup
Since beginning this Weekly Market Report in early September, I've discussed the long-term trade candidates below that I really like. Generally, these stocks have excellent long-term track records. Only in very specific cases (exceptions) would I consider a long-term entry into a stock that has a poor or limited long-term track record. Check these out:
- JPM
- BA
- FFIV
- UPWK (exception, limited history) - a heavy volume push through 16 would be very bullish
- MA
- GS - breaking trendline resistance near 350-355 would be very bullish
- FDX
- AAPL
- CHRW
- JBHT
- STX
- HSY
- DIS
- MSCI
- SBUX
While I've concentrated on individual stocks to this point, I'm going to add the first ETF to my list. I've been discussing the banking group for awhile now and I like the KRE as a longer-term play. I definitely do not want to try to pick an individual small or mid-size bank as the risks are too great, but the KRE allows us to invest in a HUGE basket of small to mid-size banks and the annual dividend yield is a very nice 3.24%. Look at the long-term chart of the KRE:
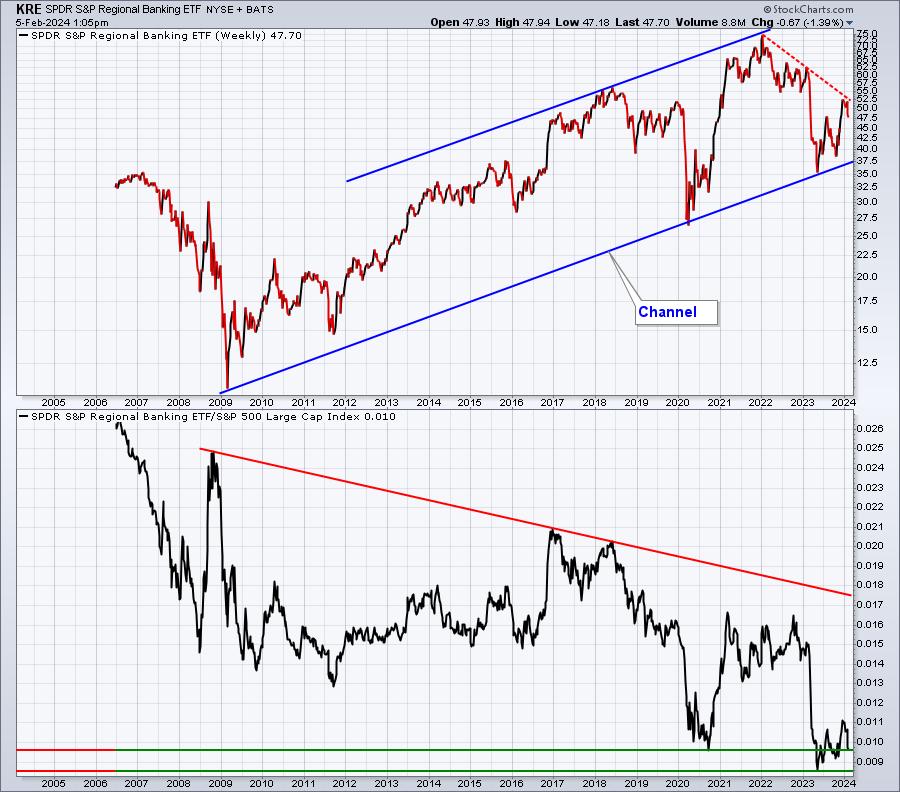
The fundamentals for banks have not been great for years and years. Personally, I believe that is in the process of changing and a much different interest rate picture later in 2024 will benefit these banks immensely. I believe that's why we're seeing buying in the KRE after gap downs and morning weakness. Being able to buy the KRE at a depressed level when it's already yielding more than 3.3% could be a very rock-solid investment for years to come.
Looking Ahead
Upcoming Earnings:
Earnings are accelerating, but we're mostly moving on to Tier 2 companies as the biggest of the big have generally reported. I've identified what I believe are key companies that will report this week, with their respective market caps in parenthesis. This is NOT a list of ALL companies reporting this week, so please be sure to check for earnings of any companies that you own or add. Any companies in BOLD represents stocks in one of our Portfolios:
- Monday: MCD ($216 billion), CAT ($157 billion), NXPI ($55 billion)
- Tuesday: LLY ($627 billion), AMGN ($174 billion), GILD ($97 billion), CMG ($67 billion)
- Wednesday: DIS ($178 billion), UBER ($137 billion), PYPL ($68 billion)
- Thursday: AZN ($207 billion), SPGI ($145 billion), TDG ($62 billion)
- Friday: PEP ($236 billion)
Key Economic Reports:
- Monday: January ISM services
- Tuesday: None
- Wednesday: None
- Thursday: Initial jobless claims, December wholesale inventories
- Friday: None
Historical Data
I'm a true stock market historian. I am absolutely PASSIONATE about studying stock market history to provide us more clues about likely stock market direction and potential sectors/industries/stocks to trade. While I don't use history as a primary indicator, I'm always very aware of it as a secondary indicator. I love it when history lines up with my technical signals, providing me much more confidence to make particular trades.
I'm now providing a bigger window into the historical numbers ahead. Below you'll find the next two weeks of historical data and tendencies across the 3 key indices that I follow most closely:
S&P 500 (since 1950)
- February 5: -35.77%
- February 6: +32.77%
- February 7: +8.04%
- February 8: -37.29%
- February 9: -49.10%
- February 10: -1.93%
- February 11: +0.16%
- February 12: +47.73%
- February 13: +51.93%
- February 14: +7.29%
- February 15: +56.39%
- February 16: -19.19%
- February 17: -31.56%
- February 18: +1.24%
NASDAQ (since 1971)
- February 5: -25.82%
- February 6: +66.65%
- February 7: -11.89%
- February 8: +8.22%
- February 9: -60.09%
- February 10: +25.71%
- February 11: +64.51%
- February 12: +56.77%
- February 13: +42.64%
- February 14: +53.64%
- February 15: +82.89%
- February 16: -34.54%
- February 17: -52.28%
- February 18: -13.59%
Russell 2000 (since 1987)
- February 5: -22.38%
- February 6: +71.85%
- February 7: +13.16%
- February 8: +16.94%
- February 9: -38.31%
- February 10: -25.82%
- February 11: +94.21%
- February 12: +89.84%
- February 13: +75.67%
- February 14: +20.46%
- February 15: +117.74%
- February 16: +51.47%
- February 17: -66.49%
- February 18: -39.52%
The S&P 500 data dates back to 1950, while the NASDAQ and Russell 2000 information date back to 1971 and 1987, respectively.
Most of the earnings reports, especially the big ones, are behind us. This week historically has been a slight advantage for the bulls. Next week, however, tends to be the last hurrah for the bulls in Q1. We typically see very strong action next week to take us through the 15th. After that? Well, let's see how the technical conditions look then, but history will not be supporting the bulls any longer.
Final Thoughts
It's so difficult to predict short-term moves in the stock market. It's quite humbling. I do have a few indicators that do a decent job, especially the 5-day SMA of the equity only put call ratio ($CPCE). That indicator right now, though, is neutral. I continue to feel very strong about the S&P 500 moving higher in 2024, but timing when the pullbacks occur will be the key in outperforming the major indices. Here are few things on my mind right now:
- January Effect. The S&P 500's January 2024 performance placed it in the 2nd Quartile of January performances since 1950. That typically results in "balance of year" performance that's above average. Januarys falling in this 2nd quartile have averaged gaining another 11% from January 31st through December 31st. That would suggest the S&P 500 to finish 2024 just above the 5300 level. I'd be good with that.
- Nonfarm payrolls. The report on Friday revealed the economy added 353,000 jobs in January 2024, ahead of consensus estimates that had the number pegged at 170,000, slightly below the December level of 216,000. There were also positive adjustments to the November and December 2023 levels. The economy clearly remains strong. The only downside was that average hourly earnings jumped 0.6%, well above the expected 0.4% level.
- The Fed. Last week's FOMC policy statement provided no change in the fed funds rate, exactly as expected. However, Fed Chief Powell did it again. In the prior meeting, Powell was pretty dovish, saying the Fed would likely cut rates 3 times instead of the 2 they previously forecast. Last week, he decided to be more hawkish, telling the market not to expect a rate cut in March and that "rates might not be cut as many times as the market expects". WTH? How do you go from calling more rate cuts one month to saying the Fed might not cut as often as the market believes the next? This is the EXACT reason why I have little confidence in the Fed and really do not like Jay Powell. His messages are mixed and the stock market doesn't like uncertainty, probably a big reason why interest-rate-sensitive stocks have underperformed the past week (think banks).
- 10-year treasury yield ($TNX). It's jumping again to push close to the upper end of the current 3.80%-4.20% range. The TNX is up 12 basis points today to 4.15% and it's now up 28 basis points since the strong January jobs report on Friday.
- Sentiment. The VIX now has a positive correlation with the S&P 500. When that positive correlation tops, we typically see an S&P 500 reversal.
- Seasonality. History tells us that we're mostly trading in bullish waters until we hit February 15th. That tends to be a brick wall for bullish advances and the 2nd half of Q1 can be rough. Prepare accordingly if you're a short-term trader. Longer-term investors should simply stick with the long side, weathering any short-term weakness, looking toward higher S&P 500 prices later in 2024 and into 2025.
Feedback
If you'd like to share your thoughts on our Weekly Market Report, positive or negative, you can reach us at "[email protected]".
Happy trading!
Tom