
EB Weekly Market Report - Monday, February 12, 2024
ChartLists Updated
Several ChartLists have been updated on our website since Friday:
- Strong Earnings (SECL)
- Strong Future Earnings (SFECL)
- Strong AD (SADCL)
- Raised Guidance (RGCL)
- Bullish Trifecta (BTCL)
- Earnings AD (EADCL)
- Upcoming Earnings (5)
Weekly Market Recap
Major Indices
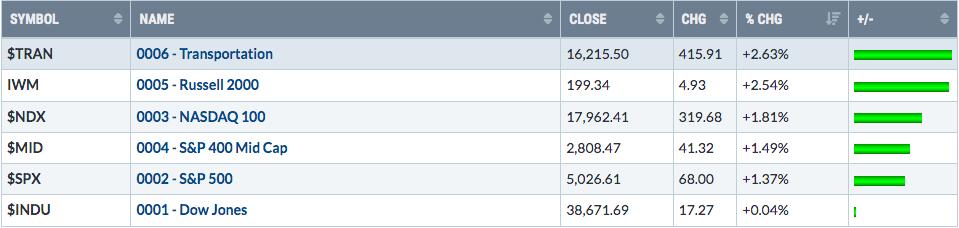
Transports ($TRAN) and small caps (IWM) tend to move together for somewhat obvious reasons. Primarily, it's due to the fact that both benefit from a strong, or strengthening, domestic economy. The following chart shows the IWM gaining ground of late, but in the bottom panel, check out the positive correlation between the IWM and the TRAN:
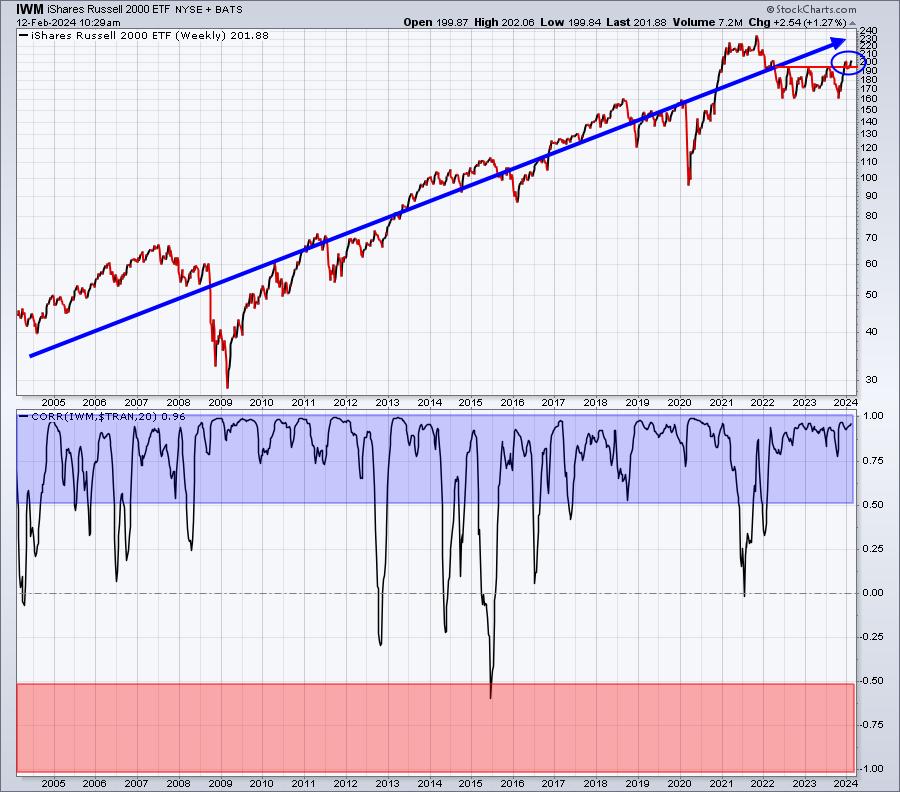
Investors have a very short-term memory. They know that small caps haven't performed well on a relative basis for over 2 years. That's a true statement, but everyone should also realize that the IWM remains in a long-term uptrend. Its relative strength varies over the years. Just because it's underperformed the past 2 years doesn't mean it'll continue to do so for the next 2 years. I still firmly believe that economic conditions will benefit small caps later in 2024, with the Fed's recent chatter delaying the inevitable - lower fed funds rate and a rapidly-improving environment for banks. Mid and small cap banks are heavily represented in the IWM.
Sectors
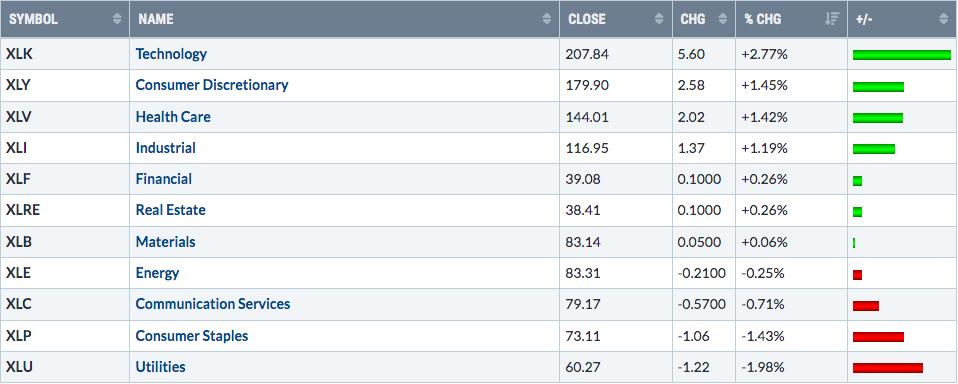
Bull market advances typically see strength across wide swaths of the stock market. Of our top 5 aggressive sectors, plus the somewhat aggressive health care (XLV), half have yet to set an all-time high - financials (XLF), communication services (XLC), and consumer discretionary (XLY). Here is a chart showing where each stands:
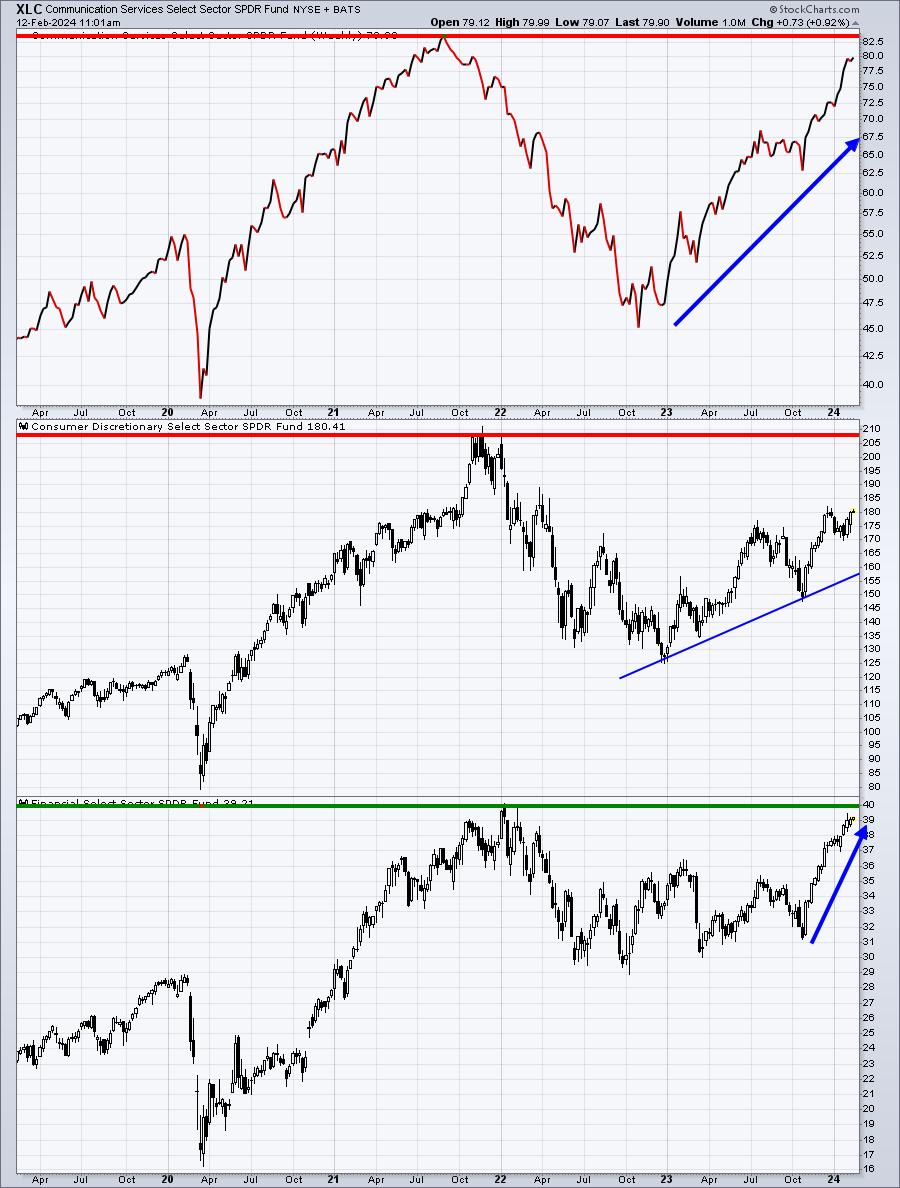
Note that the XLF and XLC are on the verge of joining technology (XLK), industrials (XLI), and health care (XLV). Consumer discretionary (XLY) is trending higher, but still has a ways to go. The more sectors that break to all-time highs, especially among the aggressive sectors, the less ability the bears have to regain control of the action.
To me, it remains full speed ahead for U.S. equities, with pullbacks along the way.
Top 10 Industries Last Week
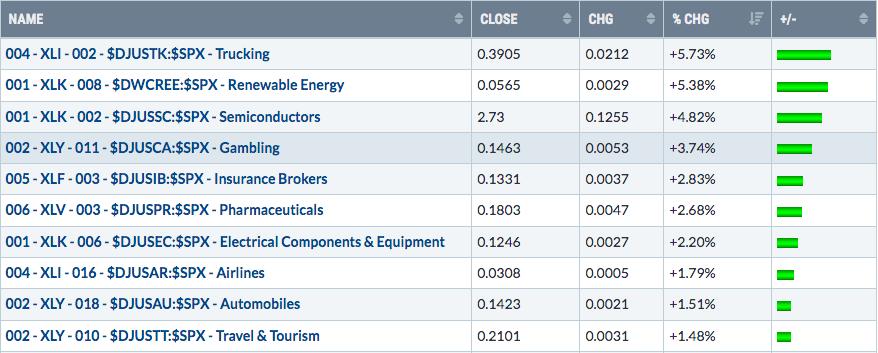
The bullish transportation theme is certainly shining through on this list. Trucking (#1) and airlines (#8) both helped to propel the transports higher last week. Electrical components have quietly gone along for the ride to the upside, but its breakout last week could trigger relative strength:
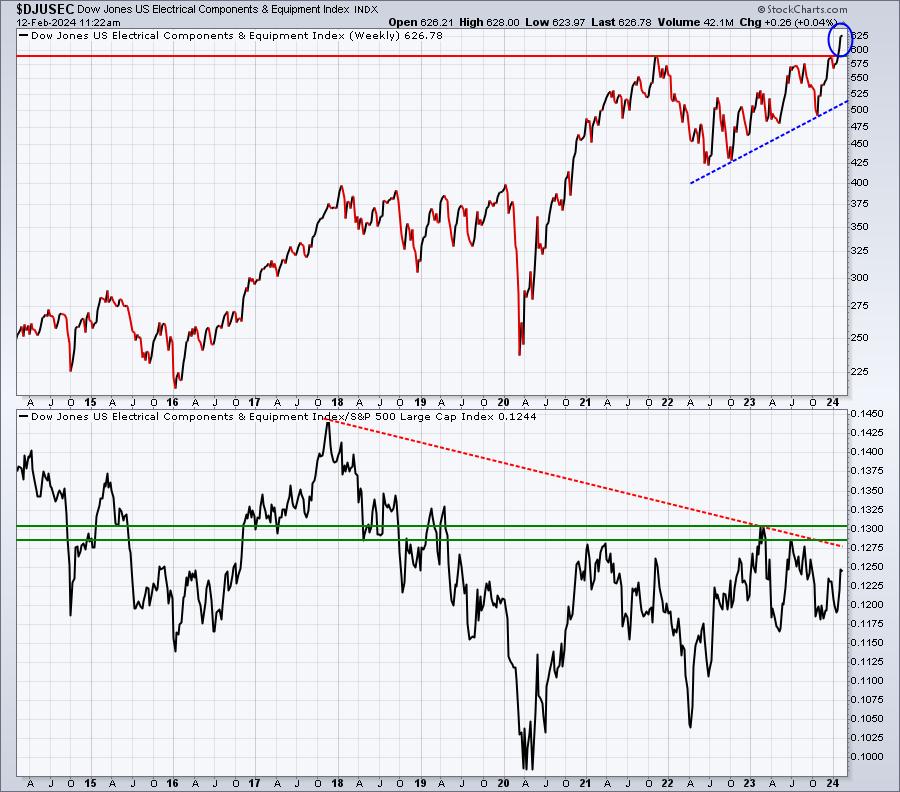
If the DJUSEC can clear the 0.1300 relative level, that combined with its absolute price breakout would be very bullish for the group.
Bottom 10 Industries Last Week
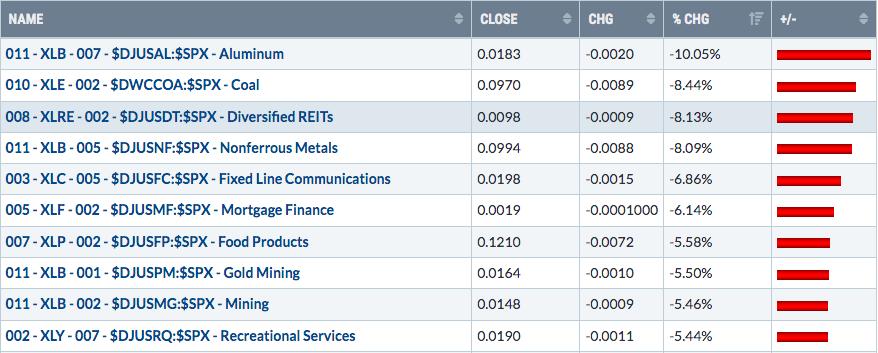
In the short-term, it's easy to get excited by a quick upside move in any area of the market. That's why it's important to keep things in context. Looking at aluminum is a perfect example. Last week's weakness lines up with the near two-year absolute and relative downtrends:
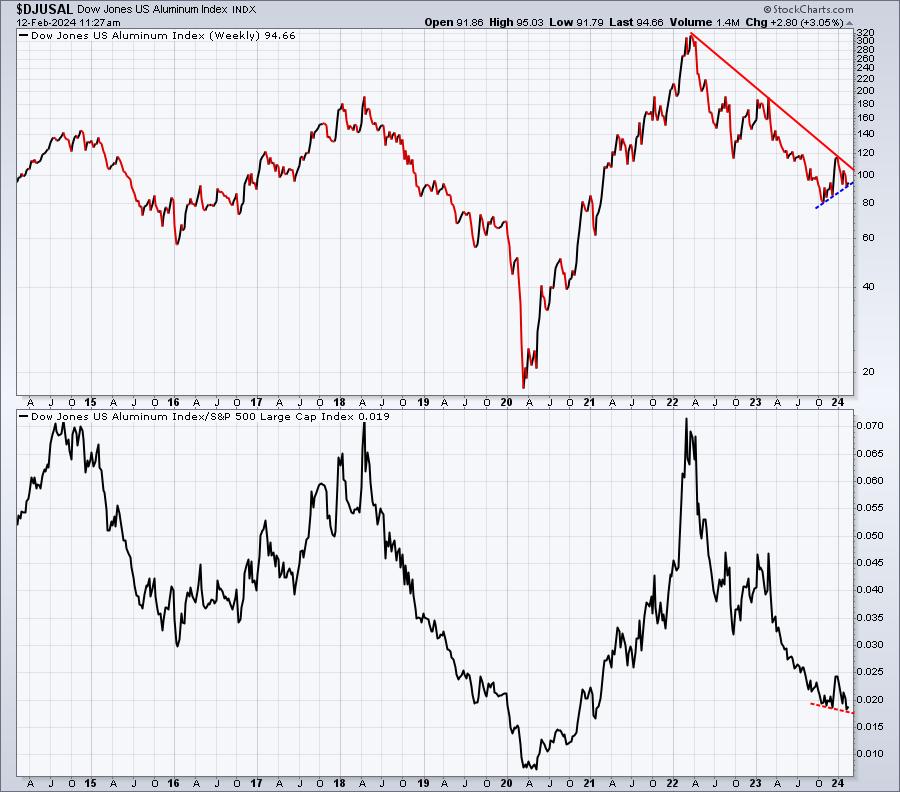
The interesting part here is that the short-term uptrend (blue-dotted line) in the DJUSAL is not matched by an uptrend in relative strength. Instead, that relative strength line is setting lower lows (red-dotted line). The long-term trend needs to turn more bullish before we can trust any rally here.
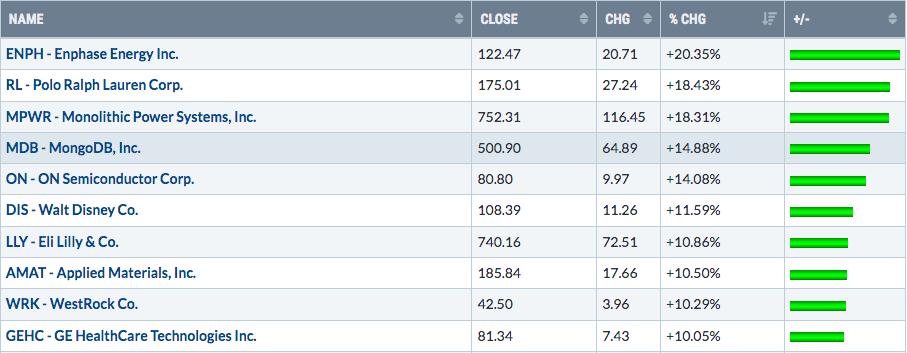
Top 10 Stocks - S&P 500/NASDAQ 100
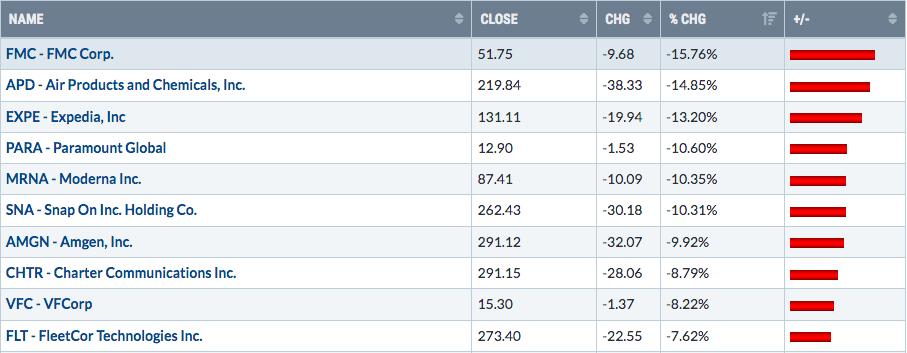
Bottom 10 Stocks - S&P 500/NASDAQ 100
Big Picture
If you find yourself always doubting a rising stock market, then you probably should look at this chart daily. For me, I think it's simply a great reminder how powerful bull markets can be. Reviewing it weekly is plenty enough for me. Current action looks much more like secular bull market action than it does secular bear market action, doesn't it?
Here's this week's reminder:
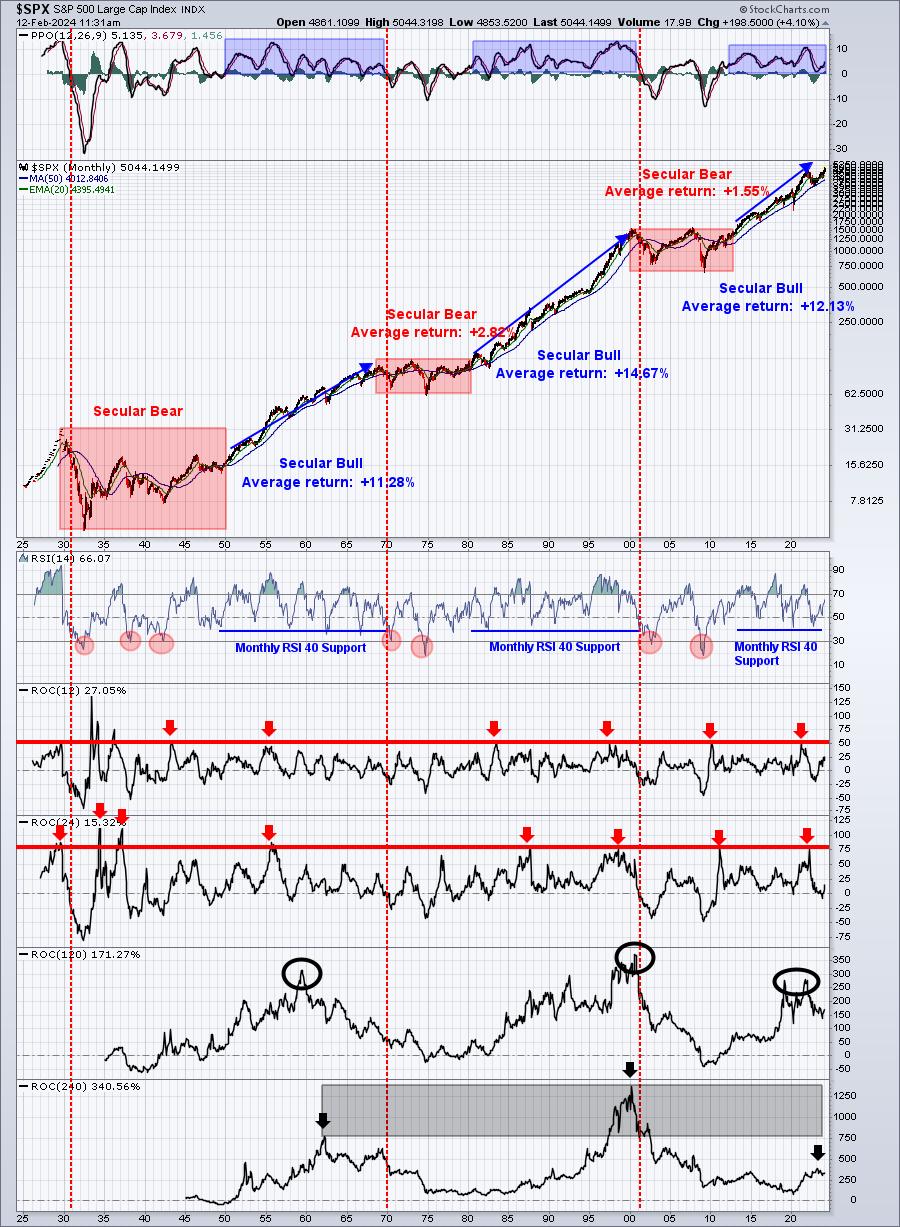
From a buy and hold perspective, holding during pullbacks is generally inevitable. From a trading perspective, I look for an overwhelming number of signals to all line up bearishly before I'd attempt to take any sort of stand against a runaway secular bull market advance. We've had signals that said we should switch to the bearish side and they simply haven't worked. It's the primary reason to keep looking at the chart above. Bull markets take no prisoners.
Sentiment
Let's look at 2 sentiment issues today. First, the Volatility Index ($VIX) had positively correlated with the S&P 500, an unusual development that can result in a sudden price reversal. So far, however, last week's top in positive correlation territory hasn't resulted in any selling and the current uptrend remains intact:
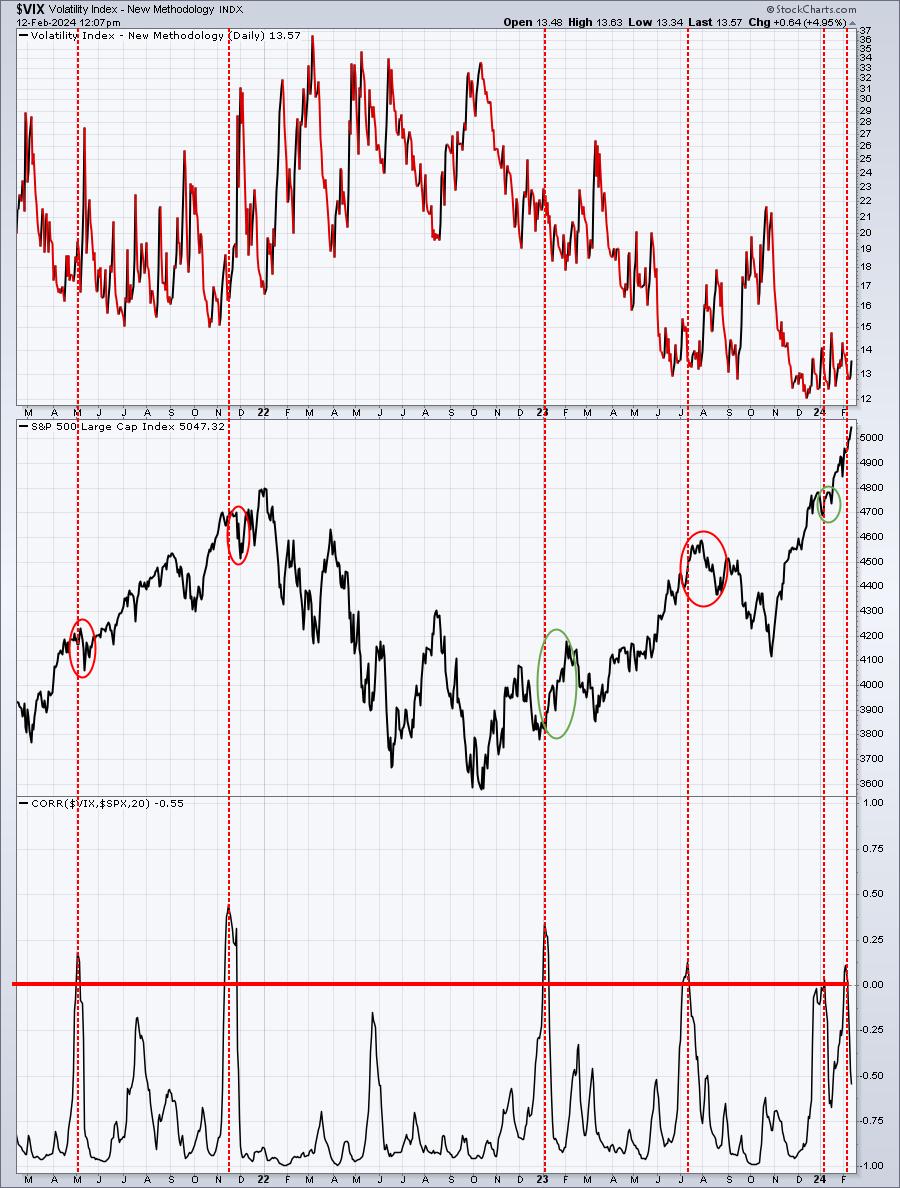
I mentioned this concern last week and what did the S&P 500 do? It broke above 5000 for the first time in history. These secondary signals should always be considered, but the fact that price action kept moving higher underscores one really big Wall Street adage. "Be careful betting against a secular bull market advance." Bears have been trying to rip apart this bull market for months, even years now, and the bulls' response has been to send prices soaring higher. This is why we must maintain a bullish bias. I see nothing longer-term that will unravel this bull market. Yes, short-term signals could derail the uptrend temporarily from time to time, but what type of investor/trader are you? How much time do you want to spend trying to call an exact top? And to save what? 3-5%? I would simply say this. If you do try to call a top, just make sure you have a place on the chart where you will give in and accept the bulls' resiliency, if necessary
There is one other sentiment signal that "bears" watching this week and it's the 5-day SMA of the equity only put call ratio ($CPCE). When it drops to a low level, perhaps .55 or .50, or even lower, a short-term top usually forms. Market makers have a way of wiping out both calls and puts from time to time. We saw a very complacent CPCE reading on Friday at .48. If we keep seeing higher highs on the S&P 500 this week and the CPCE remains in the .40s and .50s, that 5-day moving average could trigger a short-term market warning sign by Thursday, which interestingly, would be one day before February monthly options expire. Check out this chart and look at how accurate these 5-day CPCE readings can be when they hit extreme levels:
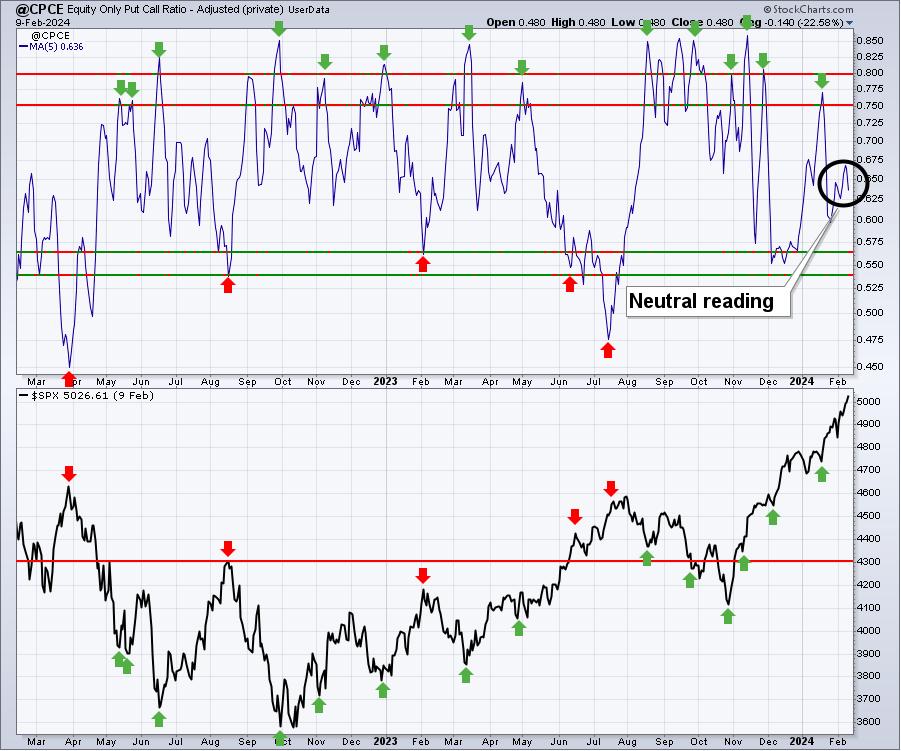
We ended last week with a neutral reading, but, as I pointed out above, bullish action this week could send this ratio back down to a level where prior S&P 500 tops have occurred. In my view, any top should be viewed as a near-term top, not a long-term one.
Rotation
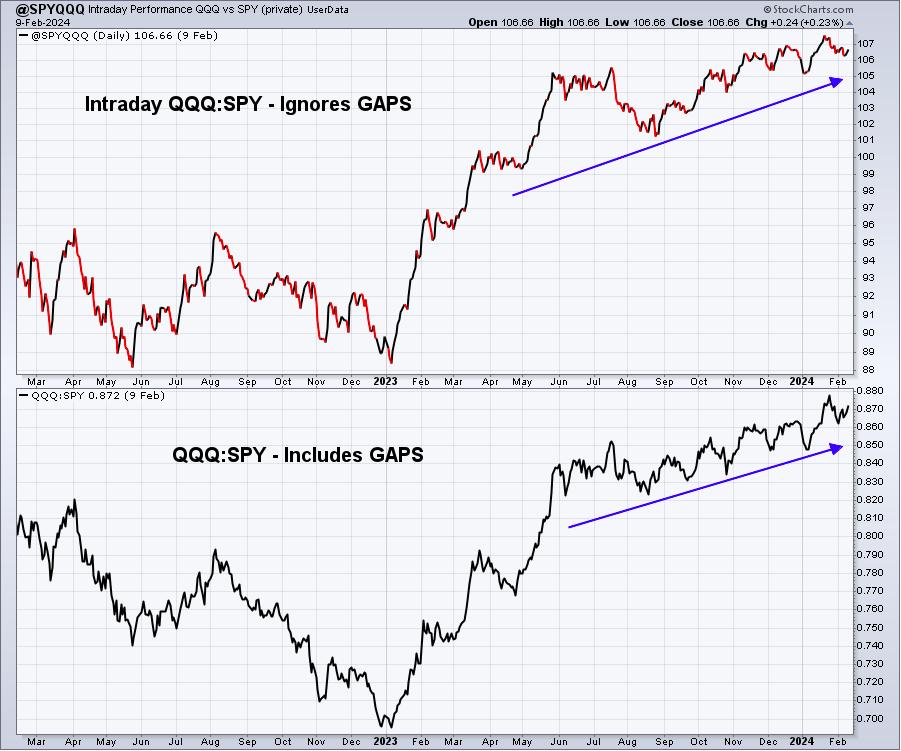
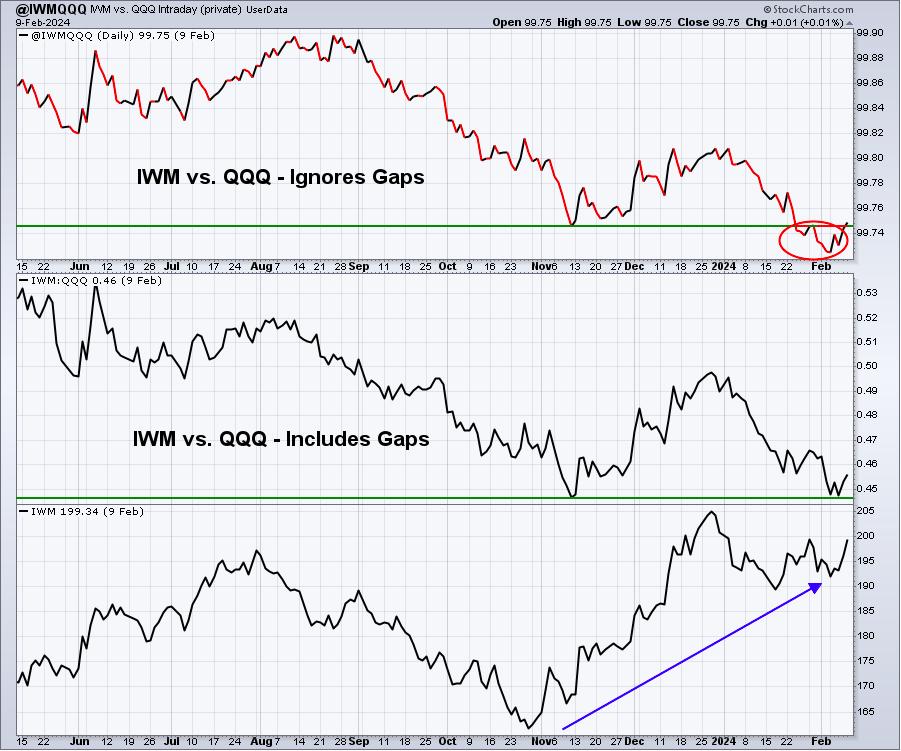
It's prudent to check in on various intraday rotation charts, so check out a few of our favorites:
QQQ:SPY
IWM:QQQ
XLY:XLP
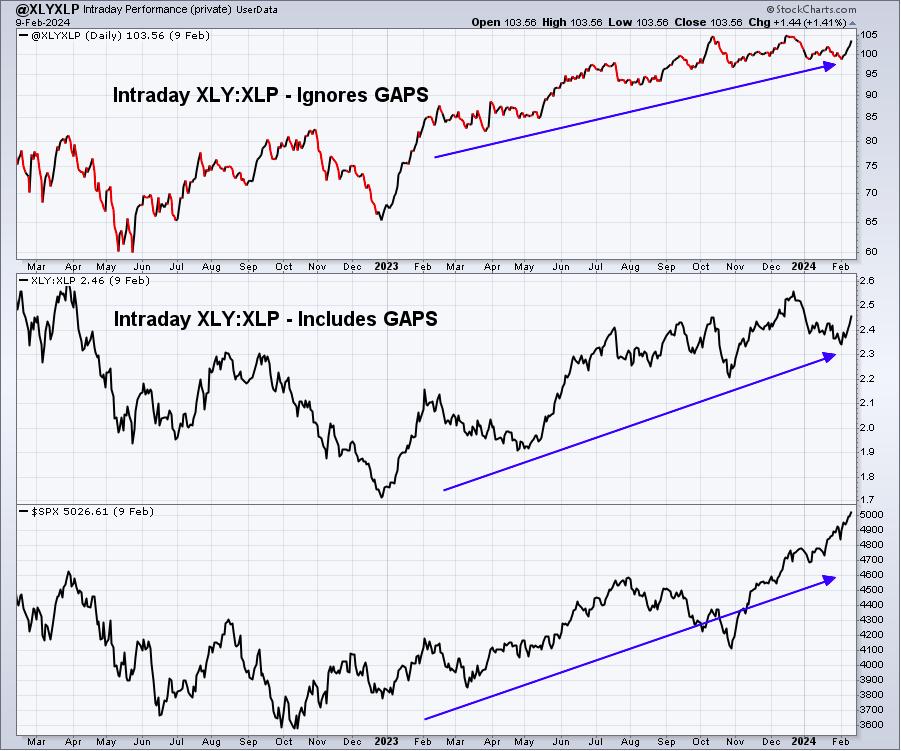
There really aren't any warning signals here. I do like seeing the XLY rallying higher vs. the XLP again. That was one intraday chart that had been struggling a bit. Last week certainly reversed that issue - at least for now.
It's also very encouraging to see the growth areas clearly outperforming the value areas at every level - large cap, mid cap, small cap:
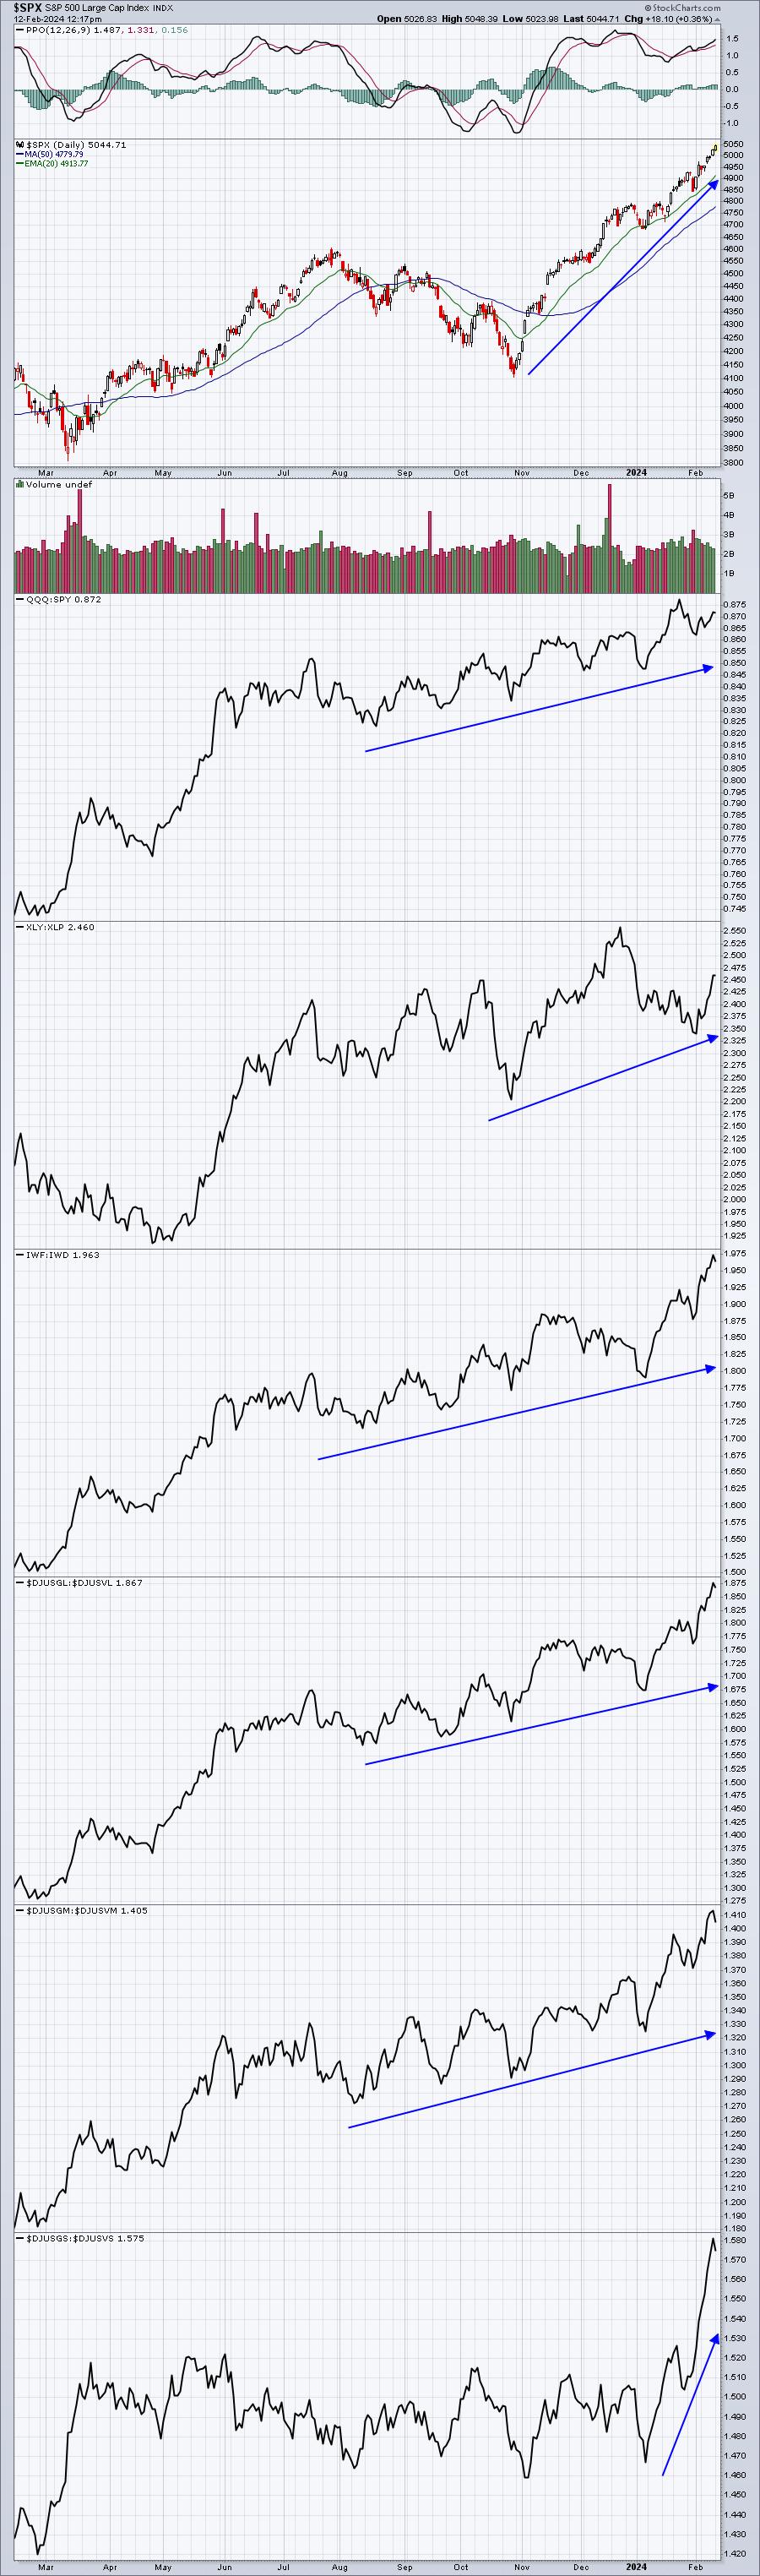
I view these as my key sustainability ratios. When these ratios are climbing along with the benchmark S&P 500, then I view the rally as sustainable and look for higher prices, albeit with pullbacks along the way.
The reason I believe these charts are powerful is that Wall Street looks ahead 6-9 months when it decides how it will weight its portfolios between growth and value. If we were likely to face a recession later in 2024, we should see these ratios begin to turn lower in a big, big way. After all, who wants to hold growth stocks during an economic contraction. That's a recipe for disaster as future earnings growth and growth rates are reduced, typically resulting in a massive decline in the growth names. Simply take a look at what happened to them in late 2021 and during the cyclical bear market of 2022. If Wall Street keeps buying growth stocks, I'm not going to spend my time worrying about a recession and possible bear market.
International ETFs
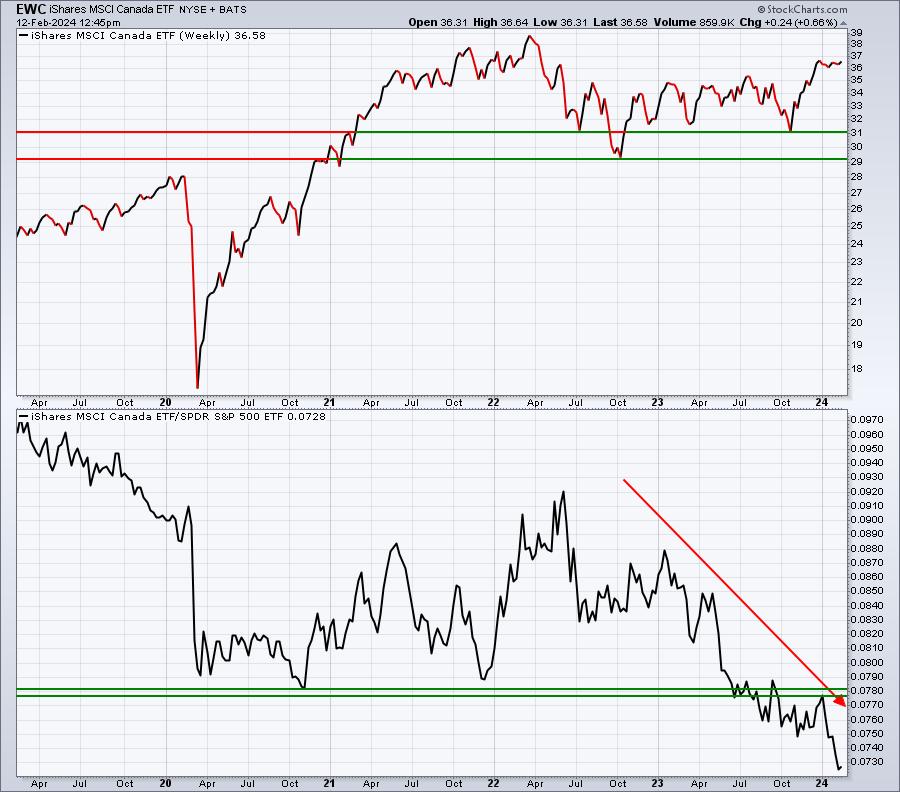
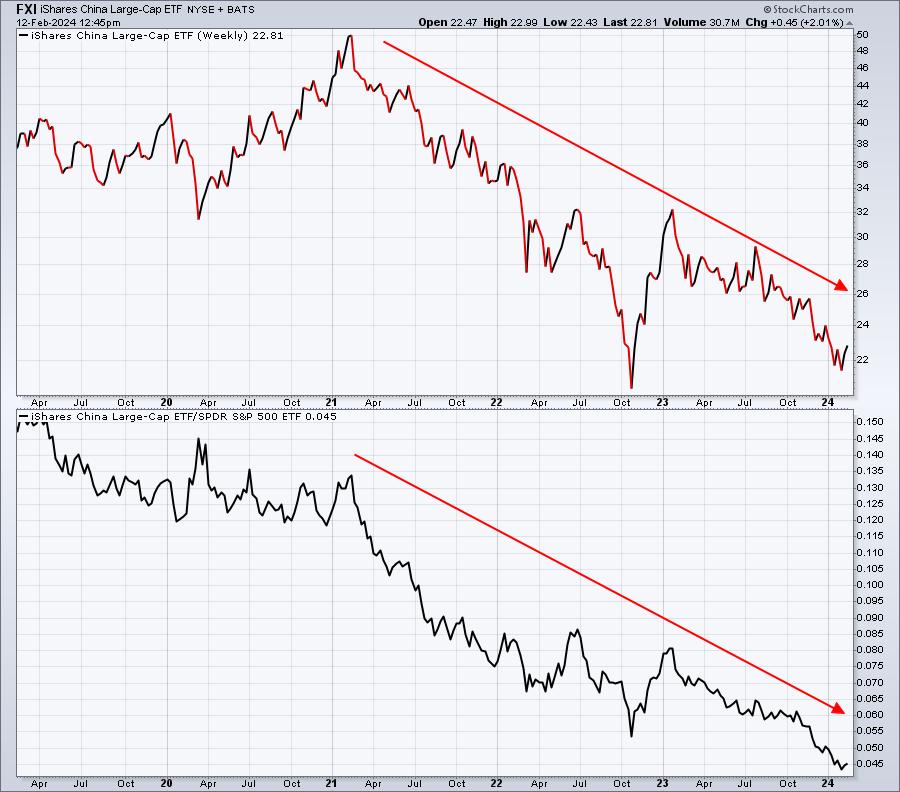
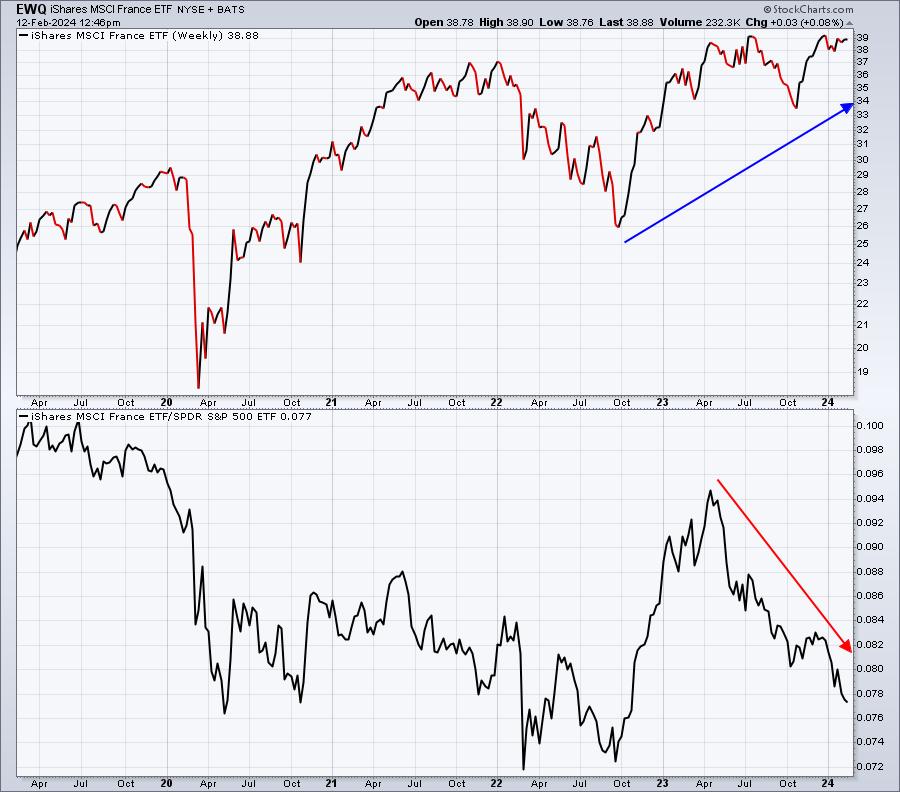
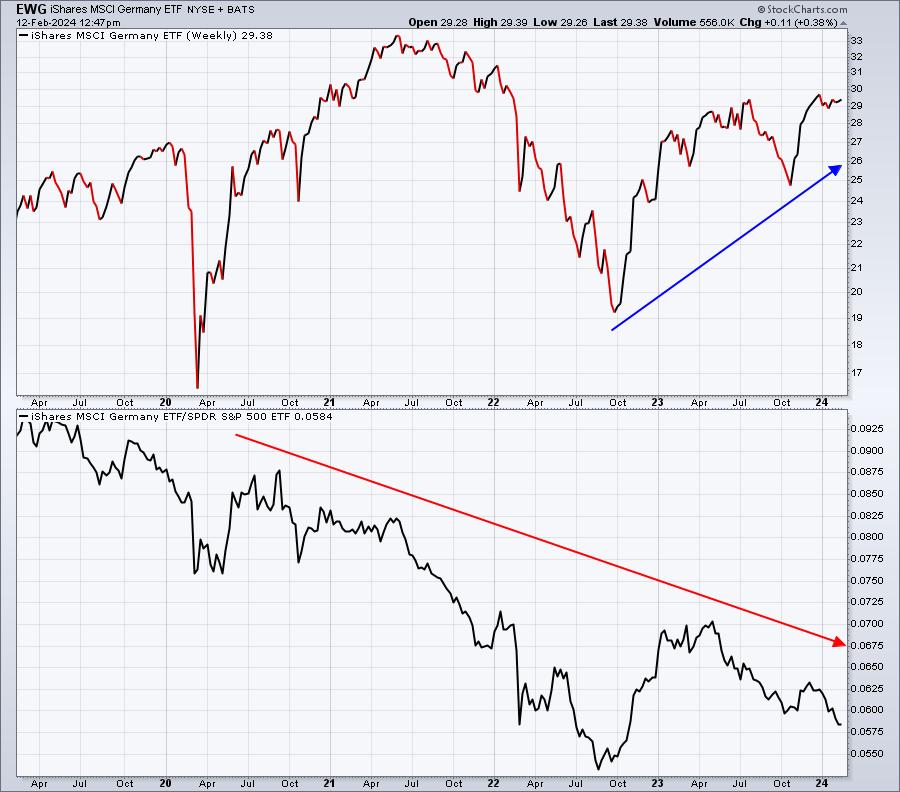
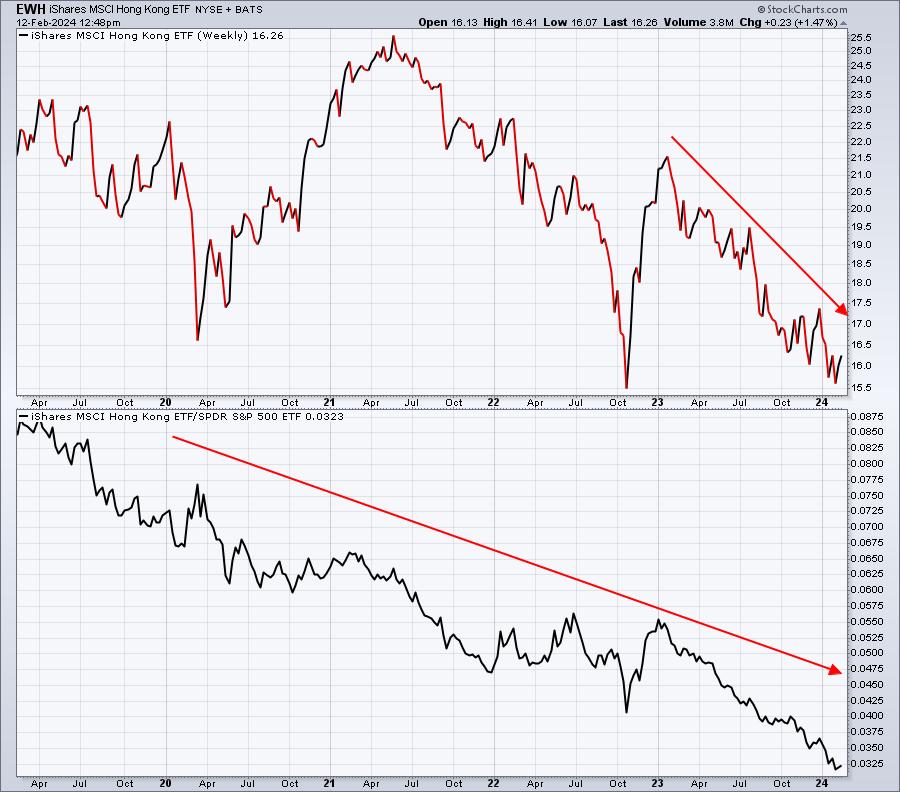
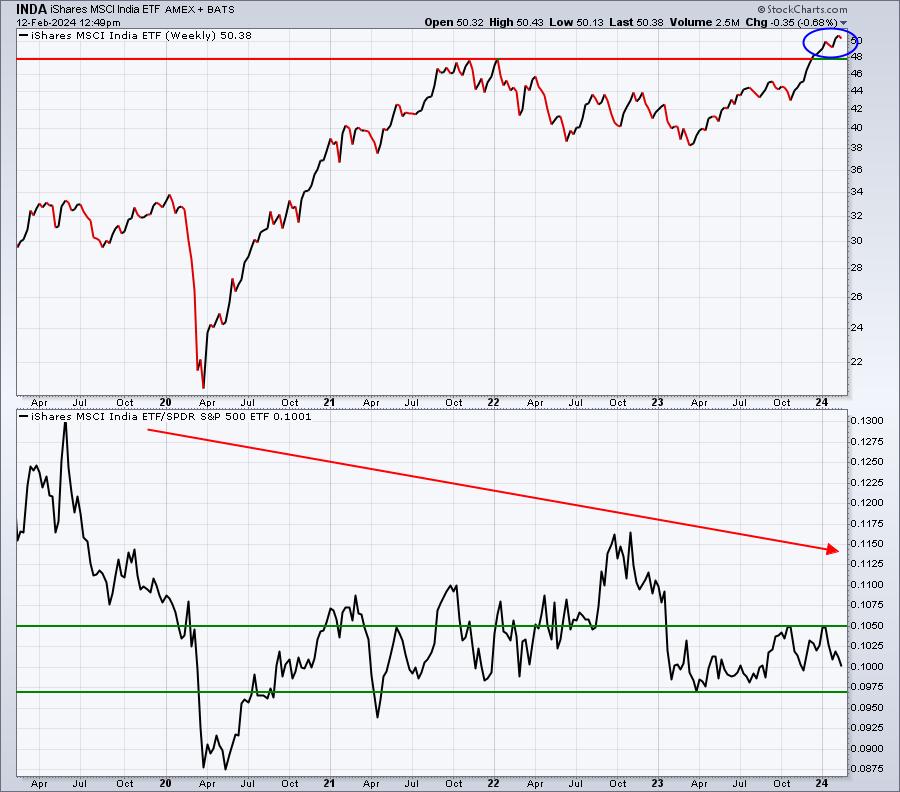
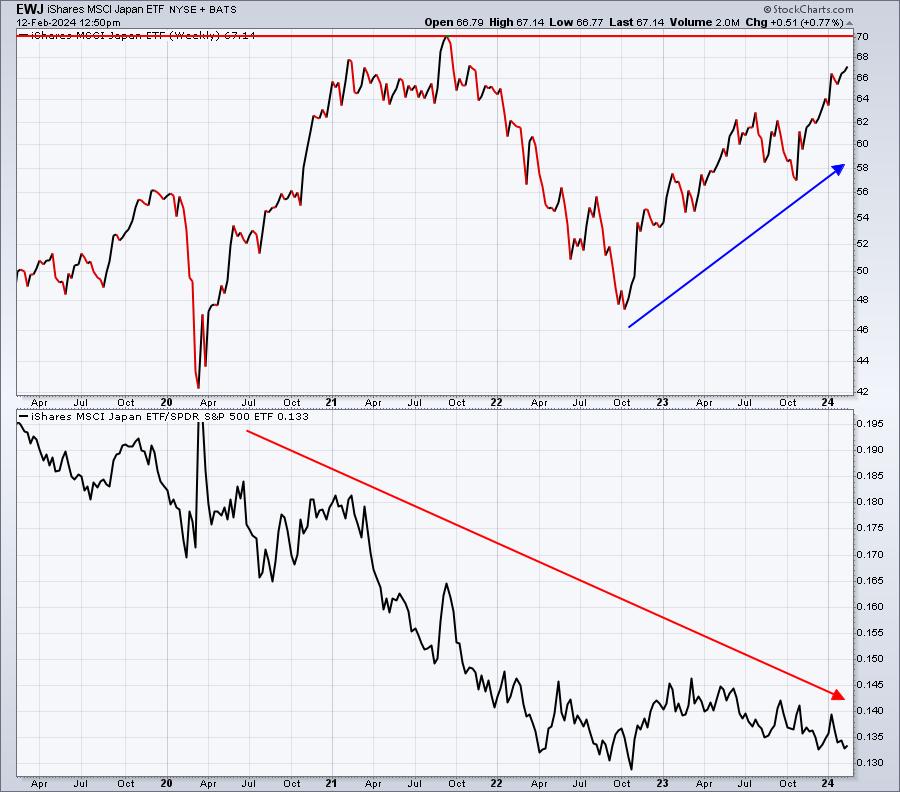
Let's take a look at a few international ETFs to see how they're performing relative to the S&P 500. Just keep in mind that the performance of these international ETFs do have a currency component. So when the U.S. Dollar ($USD) is strong, it will negatively impact the international ETF performance, relative to that country's index performance. For instance, if the dollar is rising, the EWG (Germany ETF) will underperform the German DAX ($DAX). Here are 8 international ETFs and their relative performance to the SPY (ETF tracking the S&P 500):
EWC (Canada):
FXI (China):
EWQ (France):
EWG (Germany):
EWH (Hong Kong):
INDA (India):
EWJ (Japan):
EWU (United Kingdom):
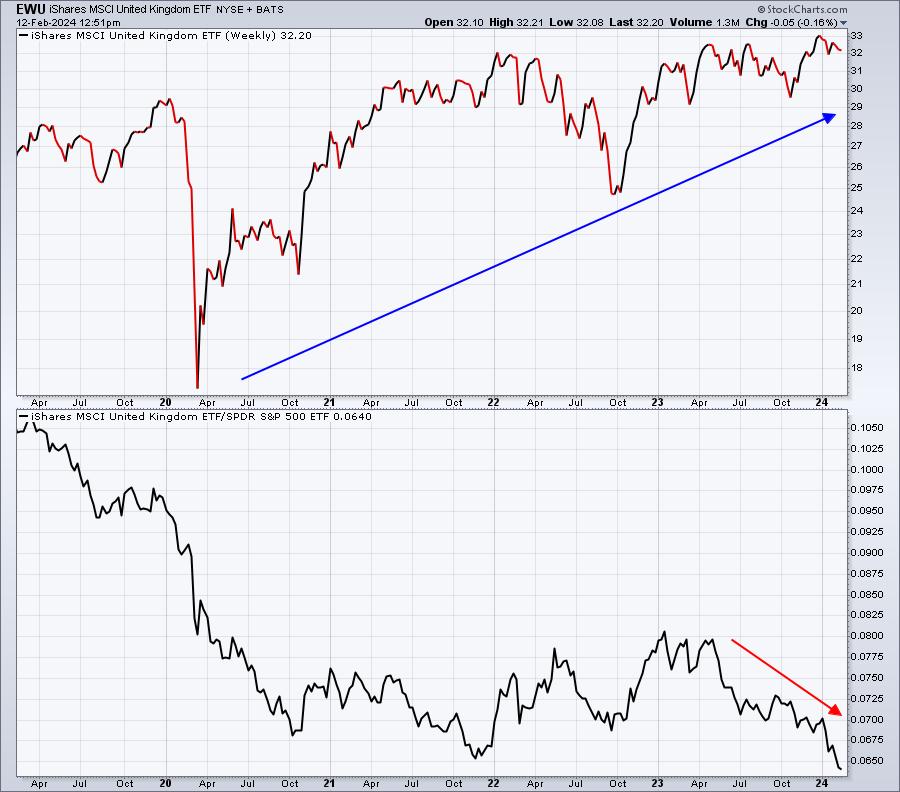
Look at these 8 5-year weekly charts of other parts of the world. I believe the conclusion is rather obvious. Despite a few pockets of absolute strength, I see nowhere else I'd want to invest outside the U.S. We'll continue monitoring this, but I wouldn't be rushing to allocate more money outside the U.S. right now, not while relative performance there is so weak.
Trade Setup
Since beginning this Weekly Market Report in early September, I've discussed the long-term trade candidates below that I really like. Generally, these stocks have excellent long-term track records. Only in very specific cases (exceptions) would I consider a long-term entry into a stock that has a poor or limited long-term track record. Check these out:
- JPM
- BA
- FFIV
- UPWK (exception, limited history) - a heavy volume push through 16 would be very bullish
- MA
- GS - breaking trendline resistance near 350-355 would be very bullish
- FDX
- AAPL
- CHRW
- JBHT
- STX
- HSY
- DIS
- MSCI
- SBUX
- KRE
Historically, during late February and throughout March, market performance can be not-so-great. As a result, I'll likely wait to see some weakness ahead before jumping into additional long-term trading candidates.
Looking Ahead
Upcoming Earnings:
Earnings remain on center stage, but the number of key companies reporting has begun to slow significantly now. I've identified what I believe are key companies that will report this week, with their respective market caps in parenthesis. This is NOT a list of ALL companies reporting this week, so please be sure to check for earnings of any companies that you own or add. Any companies in BOLD represents stocks in one of our Portfolios:
- Monday: ANET ($86 billion), CDNS ($84 billion)
- Tuesday: KO ($259 billion), SHOP ($113 billion), ABNB ($98 billion), DDOG ($43 billion)
- Wednesday: CSCO ($203 billion), OXY ($51 billion)
- Thursday: AMAT ($145 billion), DE ($108 billion), DASH ($47 billion), COIN ($32 billion)
- Friday: None
Key Economic Reports:
- Monday: None
- Tuesday: January CPI
- Wednesday: None
- Thursday: Initial jobless claims, January retail sales, February Philadelphia Fed manufacturing index, February empire state manufacturing index, January industrial production and capacity utilization, December business inventories, February housing market index
- Friday: January housing starts and building permits, January PPI, February consumer sentiment
Historical Data
I'm a true stock market historian. I am absolutely PASSIONATE about studying stock market history to provide us more clues about likely stock market direction and potential sectors/industries/stocks to trade. While I don't use history as a primary indicator, I'm always very aware of it as a secondary indicator. I love it when history lines up with my technical signals, providing me much more confidence to make particular trades.
I'm now providing a bigger window into the historical numbers ahead. Below you'll find the next two weeks of historical data and tendencies across the 3 key indices that I follow most closely:
S&P 500 (since 1950)
- February 12: +47.73%
- February 13: +51.93%
- February 14: +7.29%
- February 15: +56.39%
- February 16: -19.19%
- February 17: -31.56%
- February 18: +1.24%
- February 19: -26.20%
- February 20: +2.27%
- February 21: -55.64%
- February 22: -3.30%
- February 23: -35.86%
- February 24: +28.75%
- February 25: -8.95%
NASDAQ (since 1971)
- February 12: +56.77%
- February 13: +42.64%
- February 14: +53.64%
- February 15: +82.89%
- February 16: -34.54%
- February 17: -52.28%
- February 18: -13.59%
- February 19: -50.81%
- February 20: -11.97%
- February 21: -112.20%
- February 22: -31.03%
- February 23: -34.67%
- February 24: +64.89%
- February 25: +15.15%
Russell 2000 (since 1987)
- February 12: +89.84%
- February 13: +75.67%
- February 14: +20.46%
- February 15: +117.74%
- February 16: +51.47%
- February 17: -66.49%
- February 18: -39.52%
- February 19: -23.58%
- February 20: -37.86%
- February 21: -115.87%
- February 22: -10.90%
- February 23: -68.93%
- February 24: +76.34%
- February 25: +20.01%
The S&P 500 data dates back to 1950, while the NASDAQ and Russell 2000 information date back to 1971 and 1987, respectively.
This week in February tends to be a very bullish one historically and we're off to a good start today. Next week, however, is a totally different story as historical bears will come out of hibernation. This lines up with February options expiration on Friday and POTENTIALLY a 5-day SMA of the CPCE that turns very complacent. We'll know more about that complacency level as we work our way through this week.
Final Thoughts
This secular bull market is flexing its muscles. The S&P 500 cleared 5000 last week for the time in its history and there was very little resistance, despite it being a very significant psychological level.
Here are several things to consider this week:
- Inflation. Well, the next two big monthly inflation reports will be upon us this week. The January CPI will be released tomorrow morning at 8:30am ET. The January PPI will be released later this week on Friday morning. The Core CPI is currently estimated to be +0.3%. My educated guess is that we'll see a number slightly lower. If I'm correct, then I expect to see further gains in our major indices.
- Interest rates. We hit 4.20% on the 10-year treasury yield ($TNX) earlier today, but we've backed off to 4.17%. It's interesting to see the TNX near 4.20% with a big inflation report due out in the morning. If the January Core CPI comes in below +0.3%, then I'd expect to see investors flocking back into the bond market, sending the TNX plummeting. The opposite would be expected if the Core CPI comes in hotter than expected. We'll know tomorrow morning.
- History. This is our final week before we run into the much less bullish period during the 2nd half of Q1 (Feb 16 - Mar 31). This week tends to be extremely bullish as the numbers I provided above would attest. It's not a guarantee, but it's a signal that lines up with the current trend higher.
- Options expiration. Volatility ($VIX) will generally pick up as options expiration approaches. There are a TON of economic reports on Thursday morning, including January retail sales. This is a recipe for increased volatility and just as we are approaching options-expiration Friday.
- Sentiment. I'll be watching the 5-day SMA of the CPCE very, very closely. Should the bullish action continue over the next 3-4 days, we could see that 5-day reading drop to a level where we would need to take on a bit more caution, which might line up with other cautious signals as well.
- Secular bull market. We're in one, so do not "marry yourself" to any bearish signals. Any pullback, in my opinion, will likely be very short-term - maybe 1-3 weeks.
Feedback
If you'd like to share your thoughts on our Weekly Market Report, positive or negative, you can reach us at "[email protected]".
Happy trading!
Tom