
EB Weekly Market Report - Tuesday, February 20, 2024
No DMR Tuesday
Our Weekly Market Report (WMR) is typically provided on Mondays during the trading day in lieu of a Daily Market Report (DMR). I view the WMR as a bigger picture view of the stock market that we provide once a week. Since the stock market was closed on Monday in observance of President's Day, this WMR is being sent out in lieu of TUESDAY'S DMR.
ChartLists Updated
Several ChartLists have been updated on our website since Friday:
- Strong Earnings (SECL)
- Strong Future Earnings (SFECL)
- Raised Guidance (RGCL)
- Bullish Trifecta (BTCL)
- Upcoming Earnings (5)
Weekly Market Recap
Major Indices
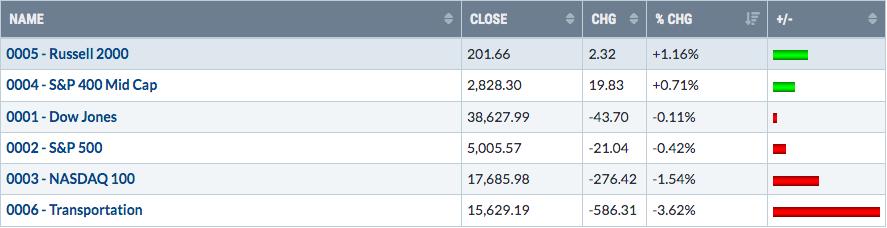
One week after illustrating the solid positive correlation between small caps (IWM) and transports ($TRAN), we saw probably the largest weekly INVERSE correlation between the two. Murphy's Law, right? Anyhow, it was good to see additional relative strength in both small and mid caps ($MID). While the IWM has completed a cup and is awaiting a key breakout, the $MID actually did make its breakout:
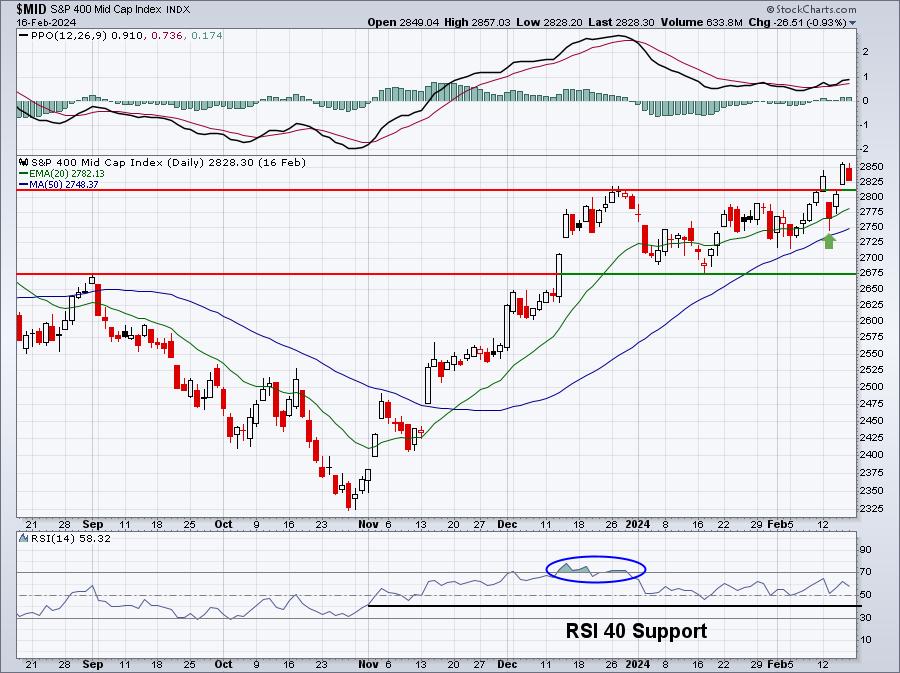
The breakout hasn't exactly been convincing just yet, but pullbacks do keep holding 20-day EMA support and the RSI is set up bullishly right now with the recent trip above 70 during the November-December uptrend. Throughout its subsequent consolidation period, RSI never dipped below 40. While none of this guarantees us anything, it's worth noting that this behavior is typical during secular bull market advances.
Sectors
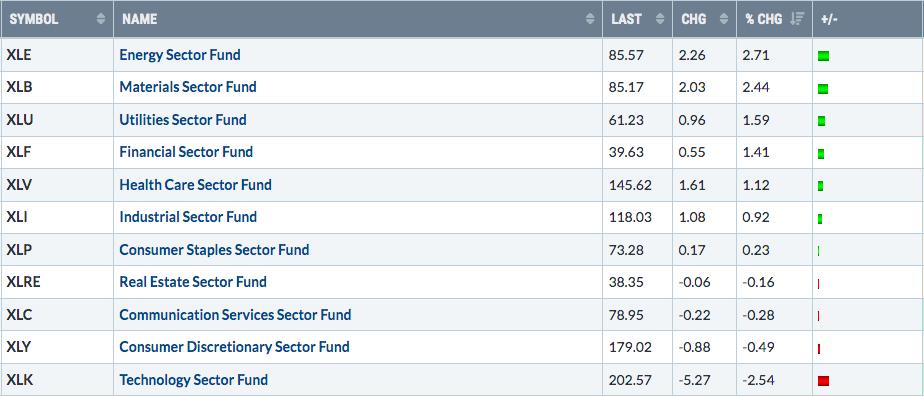
Last week's bifurcated action among our key indices resulted from this sector performance. Areas heavily represented in the small and mid cap space led the action last week, while the large cap names that dominate the S&P 500 and NASDAQ took the week off. The question now becomes, "are they prepping to take the next several weeks off?", because historically this is the case quite often.
Top 10 Industries Last Week
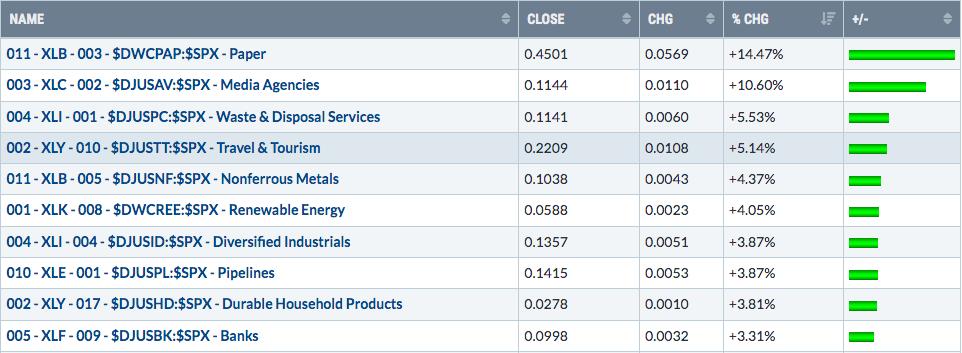
Diversified industrials ($DJUSID) performed well last week, but based on the long-term weekly chart, I'd say we should expect this type of strength to continue for the foreseeable future:
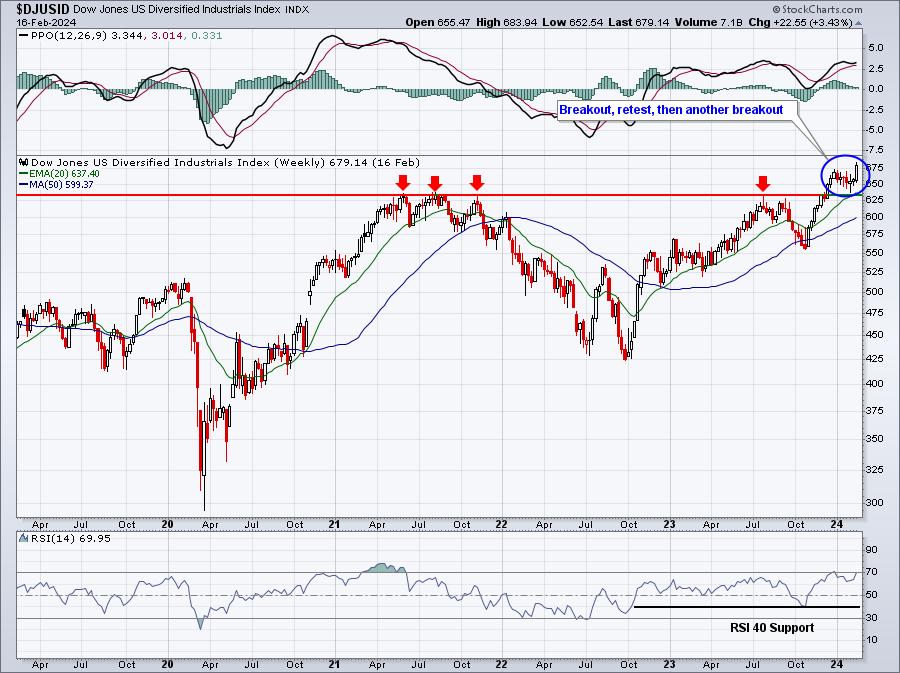
This is exactly the type of technical behavior I look for when seeking out strength in the stock market - a breakout from a lengthy base, followed by a successful retest of price/moving average support and then another breakout.
Perfect.
Bottom 10 Industries Last Week
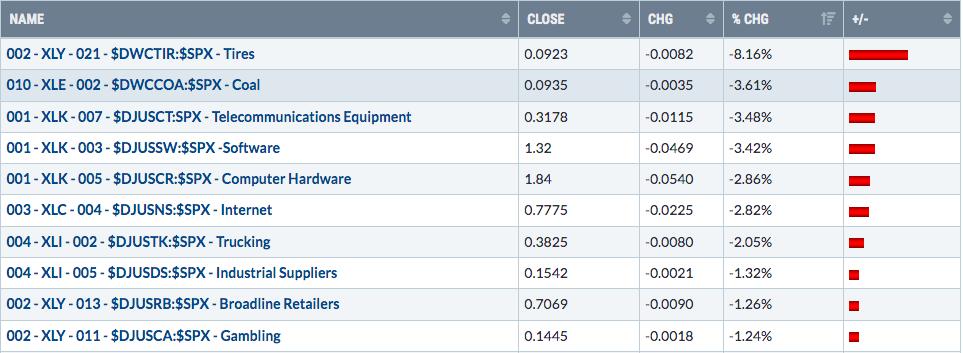
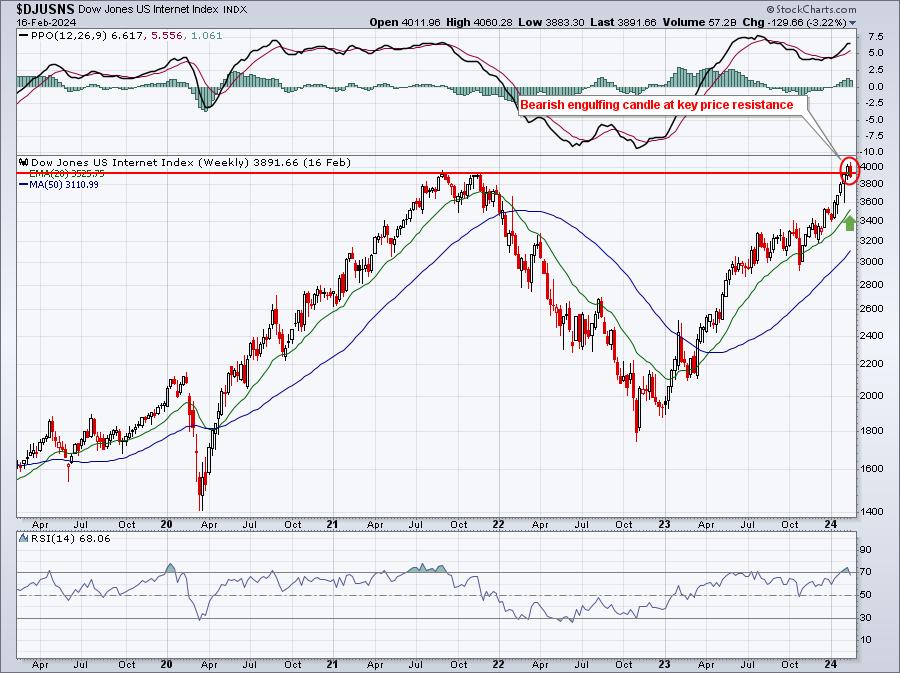
There are a number of recently-strong industry that lagged badly last week. But which one(s) might have seen its bullish advance run its course? I don't know if I'd be ready to claim that any of the strong industry groups are ready for any kind of meaningful decline, but since I asked which ones MIGHT struggle, I'd go with two that just reached MAJOR price resistance. A breakout would negate these thoughts, however, so please keep this in mind:
Internet ($DJUSNS):
Broadline Retail ($DJUSRB):
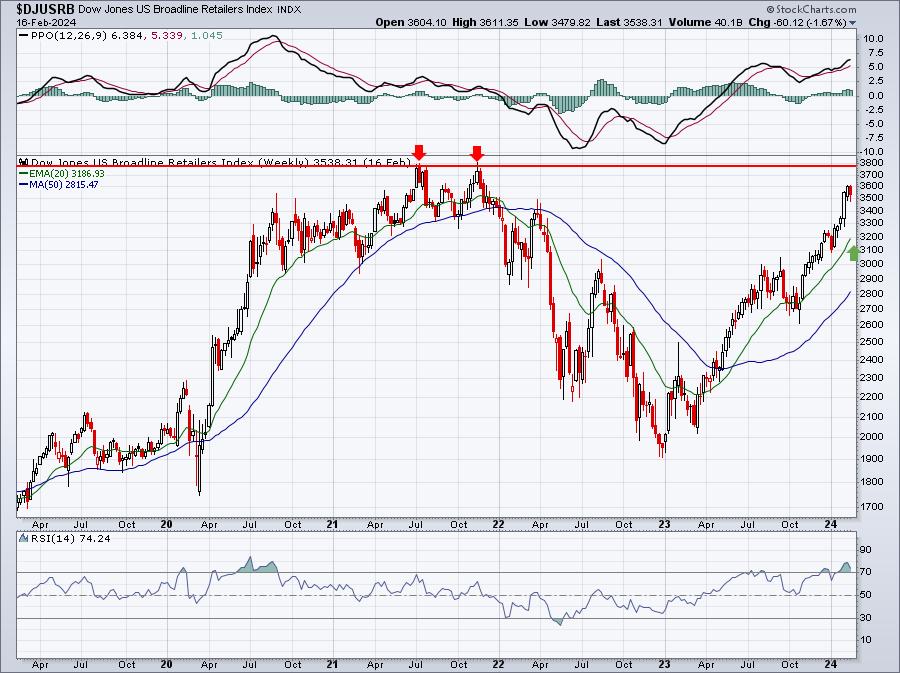
Listen, I wouldn't be rushing out to short stocks in either of these groups, but we do need to respect key overhead price resistance, especially when we reach these levels with a weekly RSI above 70. That's the case in both of these instances. A healthy pullback to the rising 20-week EMAs of both industries would be roughly a 10% selloff, maybe just a little less. If they both were to pullback to that degree, we would likely see our major indices hitting a rather rough patch, unless rotation was significant into other areas of the market to offset the potential losses here.
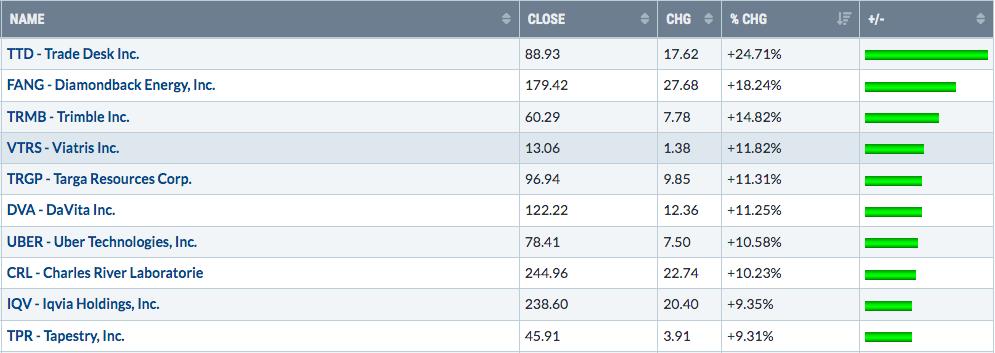
Top 10 Stocks - S&P 500/NASDAQ 100
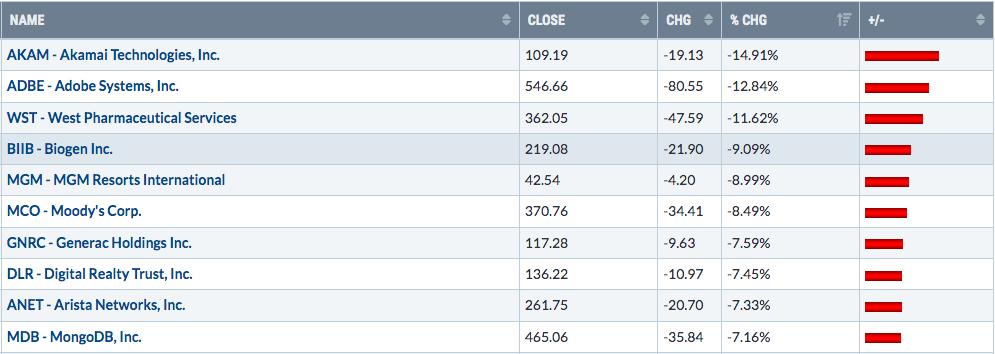
Bottom 10 Stocks - S&P 500/NASDAQ 100
Big Picture
This is my once a week staple chart to review. When I see it, I am instantly bullish. Those blue-shaded areas are reminding us every week that the monthly PPOs are screaming at us that we're in a secular bull market. This is just one great big price chart and always remember that the combination of price and volume is our #1 indicator - and #2 isn't even close. We recently broke above 5000 to an all-time high. Look at this chart closely to see how many times the S&P 500 has been in all-time high territory and trending higher. Now count how many times it ended in a secular bear market. Look at this chart weekly and PLEASE stick with a secular bull market theme until it's no longer worth the risk to do so. I know that varies by individual, but if you wake up believing the stock market will go higher, you'll be right so much more often than you'll be wrong.
Here's this week's friendly reminder:
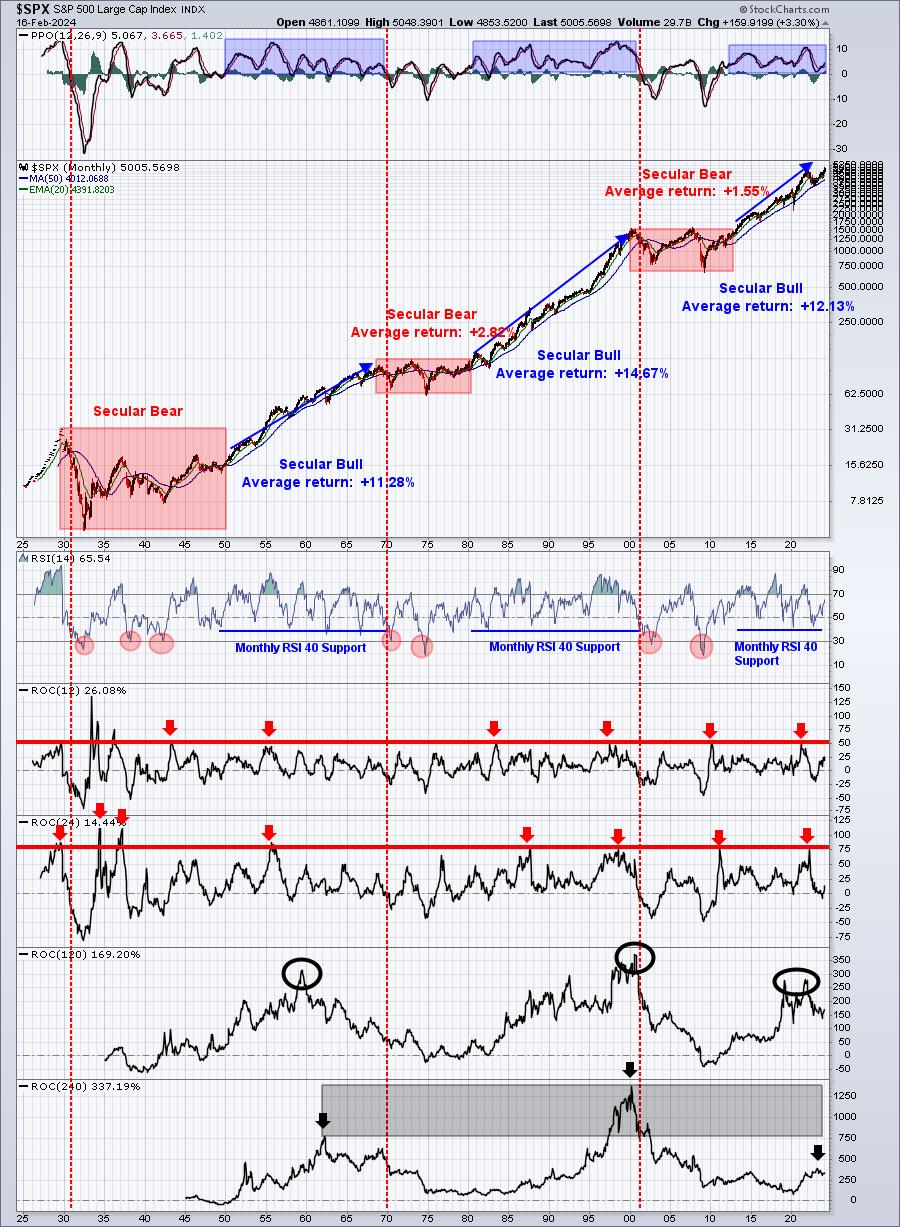
Bears have had to face a very stern reminder of what bull markets look like the past 18 months. This is a big reason why my approach to investing is to be LONG, unless you can find objective evidence, and lots of it, that suggests the odds of a decline are MUCH, MUCH greater than 50/50.
Sentiment
Big development here.
The 5-day SMA of the equity only put call ratio ($CPCE) has dropped to a level (.54-.57) where several recent market tops have occurred. Just keep in mind that a secular bull market call is a LONG-TERM call, while these types of bearish developments typically impact the SHORT-TERM only. Therefore, my approach to the major indices would be to expect higher prices ahead, but with short-term caution. Remember it's okay for the major indices to sell off for awhile, it's actually quite constructive. Here's where the CPCE 5-day SMA currently stands and what's happened in the past when we reach this level:
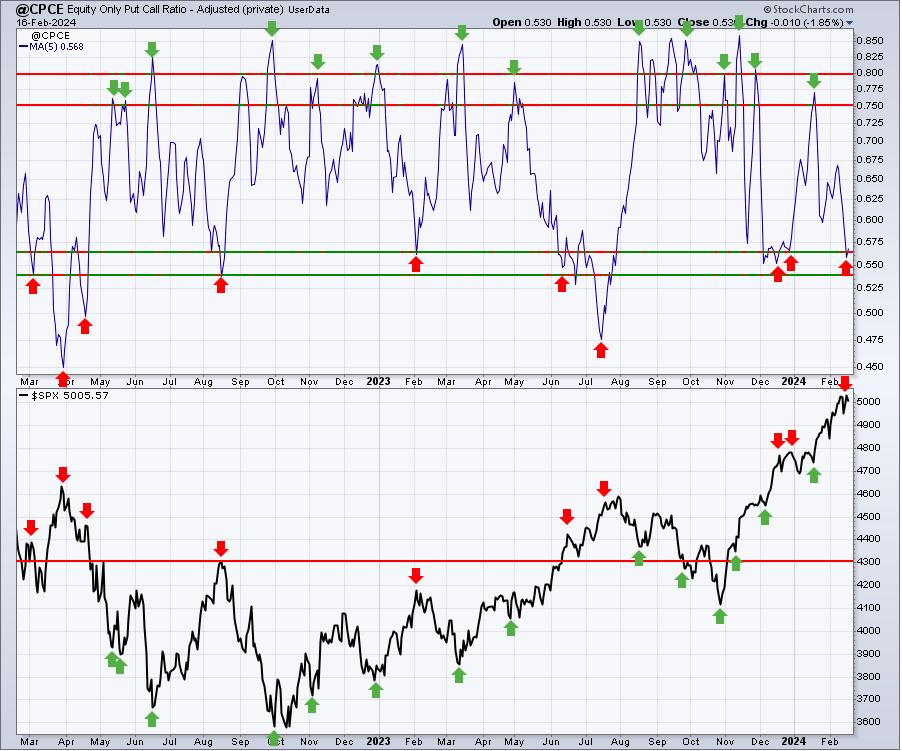
I can never provide any guarantee as to which way the stock market will go on a daily, weekly, monthly, or even yearly basis. But what I can do is evaluate the current market conditions and assess risk. When I see the 5-day SMA of the CPCE hit that .54-.57 range, I have history to BEAT ME OVER THE HEAD that short-term market risk is elevated. I may choose to do nothing about it and remain long, because I'm in a secular bull market advance, but I KNOW the short-term risk of being long is higher. That is the extent of what technical analysis is good for. That's it - to assess and manage risk.
Rotation
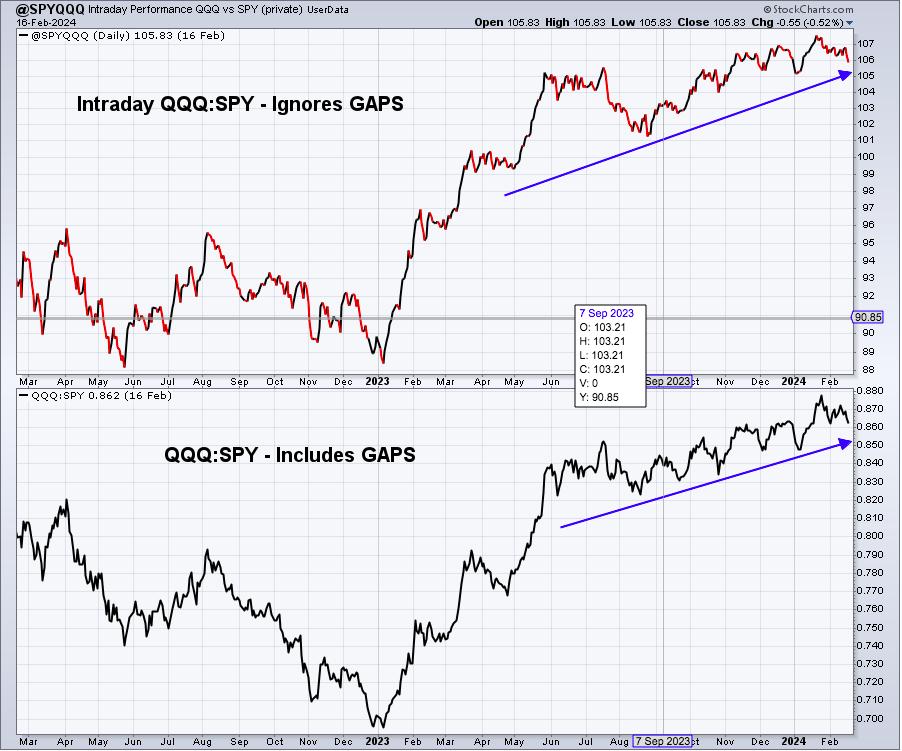
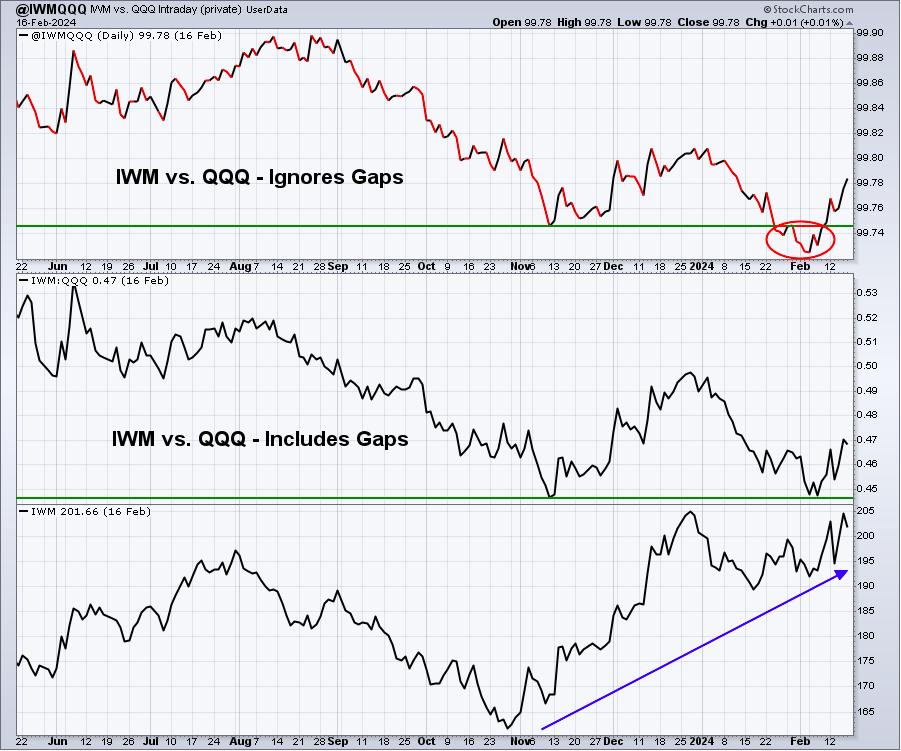
I like to show this intraday rotation in just about every Weekly Market Report, because it tells us a lot of where money is moving DURING THE TRADING DAY. The top part of these charts completely ignores manipulative gaps and essentially helps us see if the rotation, including gaps, is any different. Differences can then be evaluated in that risk assessment that I was just talking about in Sentiment. Check out the latest:
QQQ:SPY
IWM:QQQ
XLY:XLP
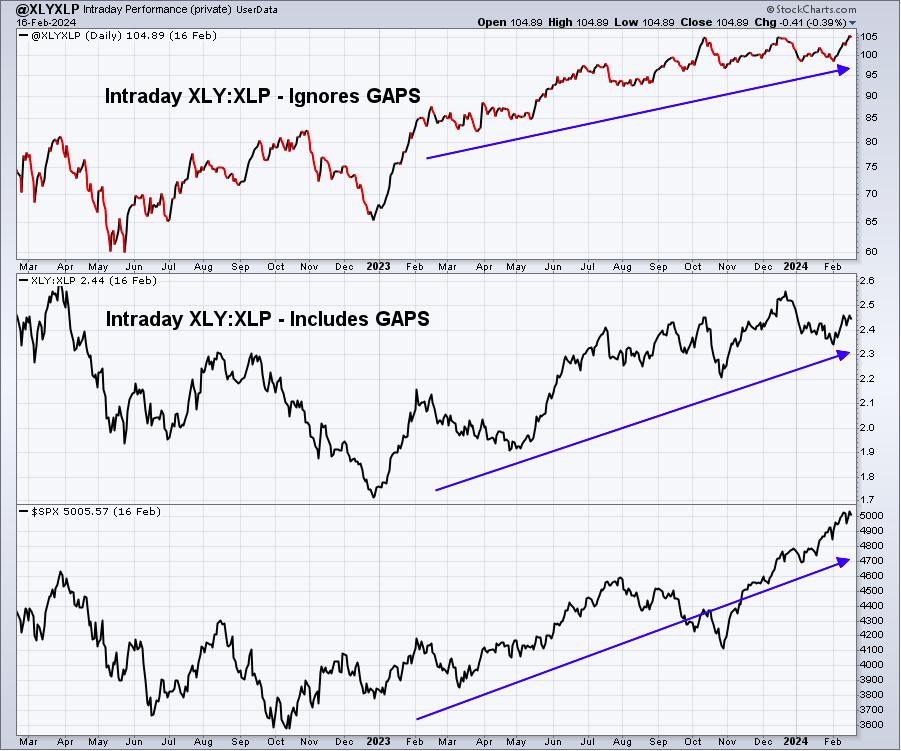
The XLY:XLP ratio is on the verge of breaking out on an intraday basis, suggesting that plenty of bullish activity is taking place here after the opening gaps. This is a very important signal that confirms the continuation of the secular bull market, even if we do see a period of consolidation or selling in the short-term.
The IWM:QQQ ratio will also be key to watch, because if the market does show short-term weakness from the QQQ, do we see rotation to other areas that can lead the market for awhile? The IWM hasn't really been a leader in the market since the beginning of the pandemic, but that leadership could return - and, of course, most of you are aware that I'm looking for that leadership again in 2024.
And here's a quick update on the growth vs. value ratios (sustainability ratios) that I like to follow:
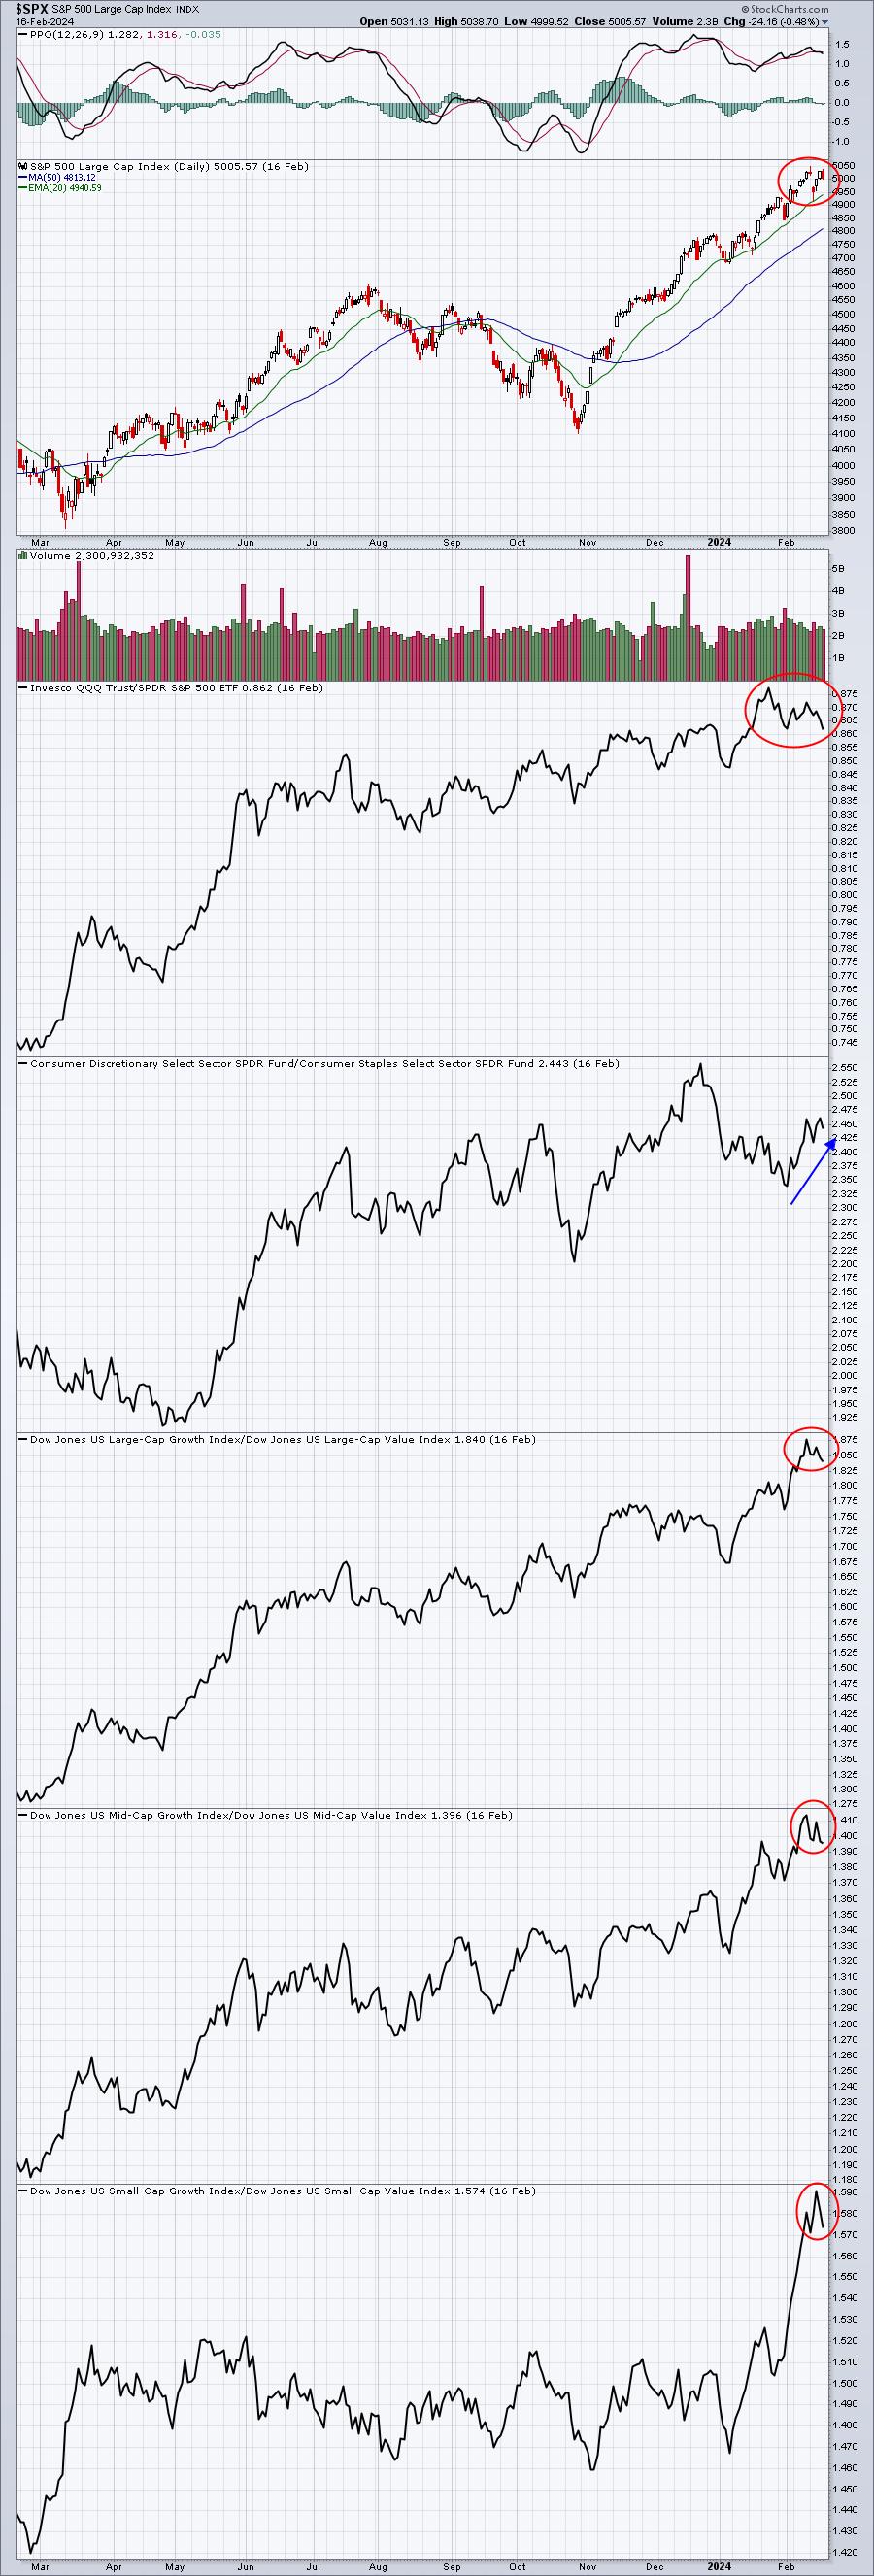
I see good news and bad news. The bad news is that the overall market appears to be shifting away from growth, which can lead to market downturns. The good news is that, so far, money leaving growth areas is finding a new home in value areas and not leaving the market completely. That's enabling the S&P 500 to hold up right now near all-time highs. But a prolonged period of weakness in growth will almost inevitably lead to weakness on the S&P 500.
Trade Setup
Since beginning this Weekly Market Report in early September, I've discussed the long-term trade candidates below that I really like. Generally, these stocks have excellent long-term track records. Only in very specific cases (exceptions) would I consider a long-term entry into a stock that has a poor or limited long-term track record. Check these out:
- JPM
- BA
- FFIV
- UPWK (exception, limited history) - a heavy volume push through 16 would be very bullish
- MA
- GS - breaking above previous trendline resistance near 350-355 was bullish
- FDX
- AAPL
- CHRW
- JBHT
- STX
- HSY
- DIS
- MSCI
- SBUX
- KRE
I'll continue to hold off adding additional stocks to this long-term buy list until we either pull back or move past the current historical bearish period. Also, I've decided to remove UPWK from this list. They reported earnings last week and was unable to clear important price resistance near 16. This was the one stock on the list without a proven long-term track record.
Finally, let's take a look at CHRW. This is an $8.43 billion industrial company that provides freight transportation services and related logistics and supply chain services. It also yields 3.38%. I'm mentioning it again as CHRW has reached a level of oversold that historically has represented an excellent entry. Check this out:
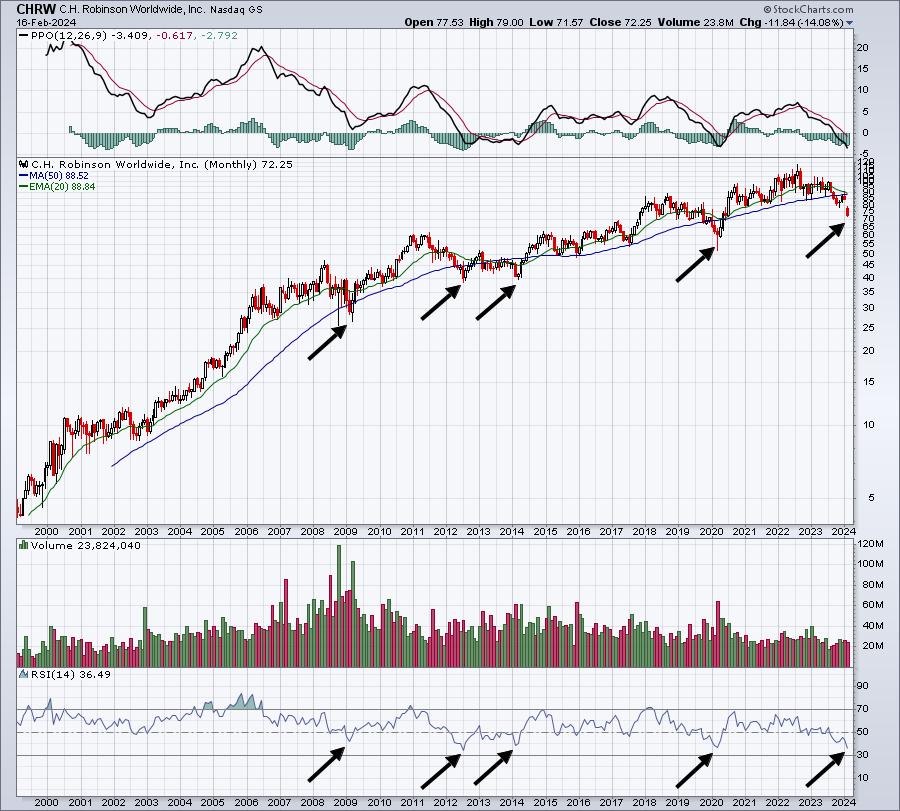
History says that CHRW's monthly RSI at or just below 40 is an opportune time to buy from a capital appreciation standpoint and the 3.38% only makes an investment here more attractive for the long-term.
Keep in mind that our Weekly Market Reports favor those more interested in the long-term market picture. Therefore, the list of stocks above are stocks that we believe are safer to own with the long-term in mind. Nearly everything else we do at EarningsBeats.com favors short-term momentum trading, so I wanted to provide an explanation of what we're doing with this list.
Looking Ahead
Upcoming Earnings:
Earnings remain on center stage, but the number of key companies reporting has begun to slow significantly now. I've identified what I believe are key companies that will report this week, with their respective market caps in parenthesis. This is NOT a list of ALL companies reporting this week, so please be sure to check for earnings of any companies that you own or add. Any companies in BOLD represents stocks in one of our Portfolios:
- Monday: None
- Tuesday: WMT ($456 billion), HD ($359 billion), PANW ($115 billion)
- Wednesday: NVDA ($1.79 trillion), ADI ($93 billion), SNPS ($85 billion)
- Thursday: INTU ($186 billion), BKNG ($131 billion)
- Friday: BRK/A ($877 billion)
Key Economic Reports:
- Monday: None
- Tuesday: January leading indicators
- Wednesday: FOMC minutes
- Thursday: Initial jobless claims, January existing home sales
- Friday: None
Historical Data
I'm a true stock market historian. I am absolutely PASSIONATE about studying stock market history to provide us more clues about likely stock market direction and potential sectors/industries/stocks to trade. While I don't use history as a primary indicator, I'm always very aware of it as a secondary indicator. I love it when history lines up with my technical signals, providing me much more confidence to make particular trades.
I'm now providing a bigger window into the historical numbers ahead. Below you'll find the next two weeks of historical data and tendencies across the 3 key indices that I follow most closely:
S&P 500 (since 1950)
- February 19: -26.20%
- February 20: +2.27%
- February 21: -55.64%
- February 22: -3.30%
- February 23: -35.86%
- February 24: +28.75%
- February 25: -8.95%
- February 26: +16.50%
- February 27: -61.89%
- February 28: -19.83%
- February 29: -15.19%
- March 1: +75.91%
- March 2: +39.20%
- March 3: +11.46%
NASDAQ (since 1971)
- February 19: -50.81%
- February 20: -11.97%
- February 21: -112.20%
- February 22: -31.03%
- February 23: -34.67%
- February 24: +64.89%
- February 25: +15.15%
- February 26: +19.04%
- February 27: -99.90%
- February 28: -25.64%
- February 29: +2.20%
- March 1: +128.14%
- March 2: +8.14%
- March 3: -7.22%
Russell 2000 (since 1987)
- February 19: -23.58%
- February 20: -37.86%
- February 21: -115.87%
- February 22: -10.90%
- February 23: -68.93%
- February 24: +76.34%
- February 25: +20.01%
- February 26: +25.91%
- February 27: -73.29%
- February 28: -58.90%
- February 29: +11.92%
- March 1: +141.87%
- March 2: -1.57%
- March 3: +4.06%
The S&P 500 data dates back to 1950, while the NASDAQ and Russell 2000 information date back to 1971 and 1987, respectively.
History is sending us a few cautious signals as our key indices do have a tendency to move lower this week. Of course, this is no guarantee, but it's interesting given the potential short-term top signal being sent by the 5-day SMA of the equity only put call ratio ($CPCE). Throw in the growth ratios possibly beginning to roll over and you can see why we move into this week on some shaky ground. We do remain in a secular bull market, however, and we know how resilient they can be. It'll be an interesting week ahead for sure.
Final Thoughts
It seemed to me as though the late week rally last week began to run out of steam. That's easy to rectify, though, as all it takes is another shot higher in the QQQ to support another S&P 500 breakout. But given all the signals I follow, I do have to give the edge to the bears this week.
Here are several things to consider in the week ahead:
- Earnings - Dow Jones. It's not a heavy dose of earnings, but we do have a few really important companies releasing their quarterly results this week. Right out of the gate tomorrow morning, the Dow Jones will be tested. Two of its component stocks, Walmart (WMT) and Home Depot (HD) will report results and I expect both to be solid, possibly lifting the Dow Jones. If the S&P 500 and the NASDAQ both see weakness from high octane growth stocks, the Dow Jones might be a beneficiary.
- Earnings - NASDAQ. Is there anyone around that's NOT interested in NVDA's quarterly results? NVDA is priced for absolute perfection and, if they don't see it, or say anything cautious about next quarter, we could a big selloff in NVDA, specifically, and the semiconductors ($DJUSSC) more generally. NVDA is clearly the undisputed leader in the semiconductor area and this group has been the best-performing group over the past year. NVDA reports Wednesday afternoon and let me be clear. I expect a BLOWOUT earnings report. But what if NVDA says anything cautious in their conference call? Buckle up!
- History. The upcoming week isn't a great one as I discussed above.
- Volatility ($VIX). I mentioned last week that we often see the VIX rally into options expiration week. Well, on Tuesday of last week, the VIX soared to 18 after the January CPI came in higher than expected. Don't be shocked by another big spike this week, especially if NVDA struggles after earnings.
- Sentiment. This might be the biggest news of the week. The CPCE 5-day SMA fell just below .57 and this level has triggered market weakness in the recent past.
Feedback
If you'd like to share your thoughts on our Weekly Market Report, positive or negative, you can reach us at "[email protected]".
Happy trading!
Tom