
EB Weekly Market Report - Monday, February 26, 2024
ChartLists Updated
Several ChartLists have been updated on our website since Friday:
- Strong Earnings (SECL)
- Strong Future Earnings (SFECL)
- Raised Guidance (RGCL)
- Bullish Trifecta (BTCL)
- Upcoming Earnings (5)
Weekly Market Recap
Major Indices
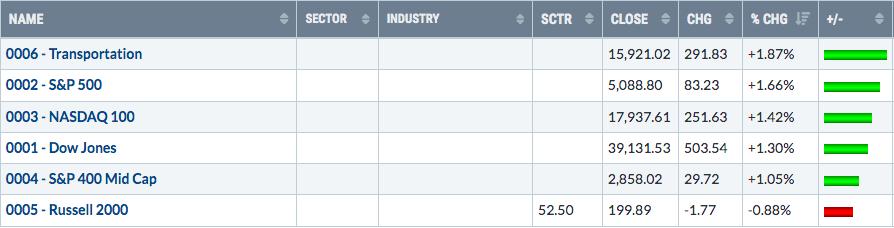
Last week, it was the Russell 2000 leading and transports lagging. One week later, and the script has flipped. Still, it was another positive week for U.S. equities as the S&P 500 has now had 15 weekly gains over the last 17 weeks. Both the Dow Jones and NASDAQ 100 have also gained ground during 15 of the last 17 weeks. It's been an amazing run. The weakest index has been the Russell 2000, but you can see that even the IWM (ETF that tracks the Russell 2000) remains quite bullish on its weekly chart, maintaining price action above its 20-week EMA:
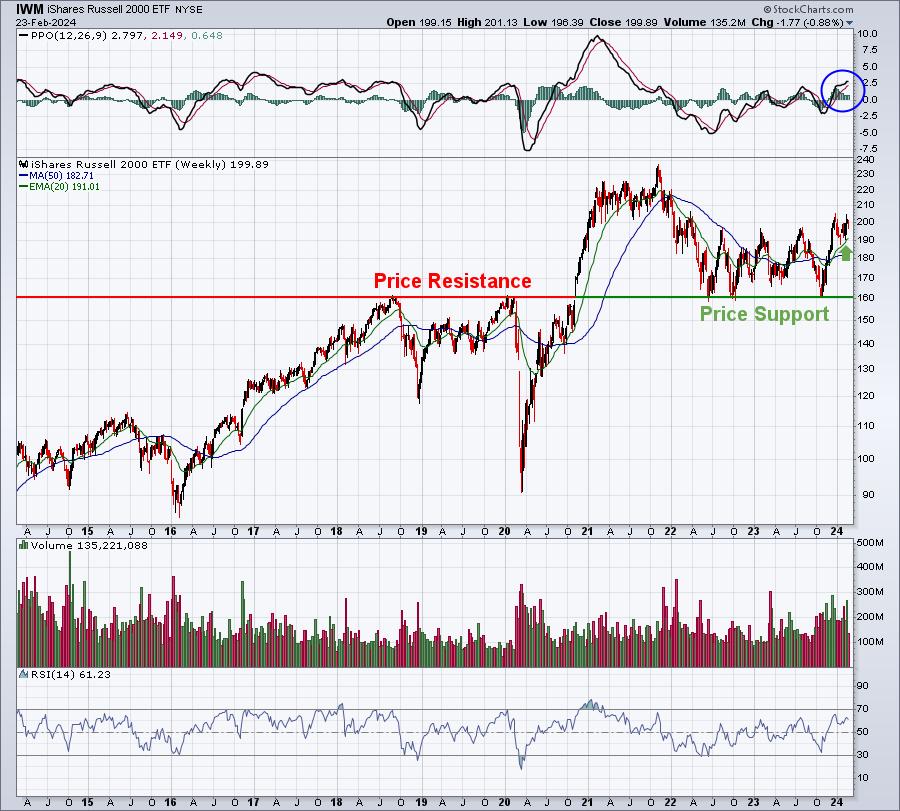
The story here on the IWM, to me, is one of renewed bullishness. First and foremost, when key price resistance was broken in 2020, it then formed major support at that same level. That support level has been tested on multiple occasions and it's held every time. The keys to breaking out of a period of consolidation is (1) clear overhead price resistance, (2) hold 20-week EMA support, and (3) break to another high. This 3-part series of events USUALLY starts a bull market leg and that's what I'm expecting to see with the IWM. Ultimately, I expect to see relative strength in the IWM, but that's still lacking.
Sectors
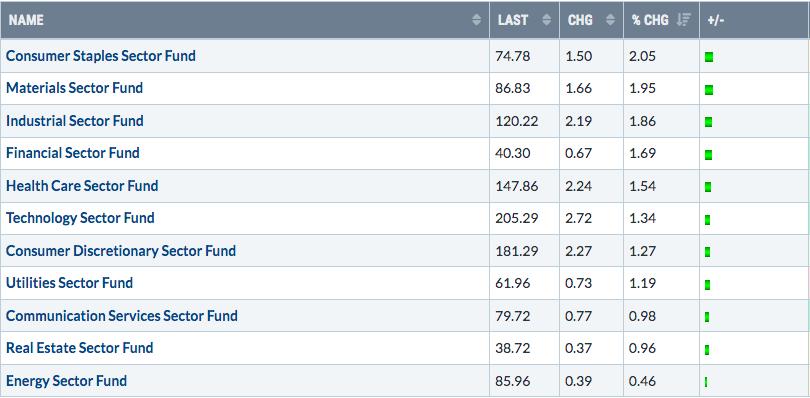
The good news is that all 11 sectors move higher last week to support the advance of our major indices. The bad news is that consumer staples led the advance. But when we look at the gains from last week, most sectors were closely bunched. Outside of energy (XLE), the other sectors mostly fell in the range of 1%-2% gains.
Top 10 Industries Last Week
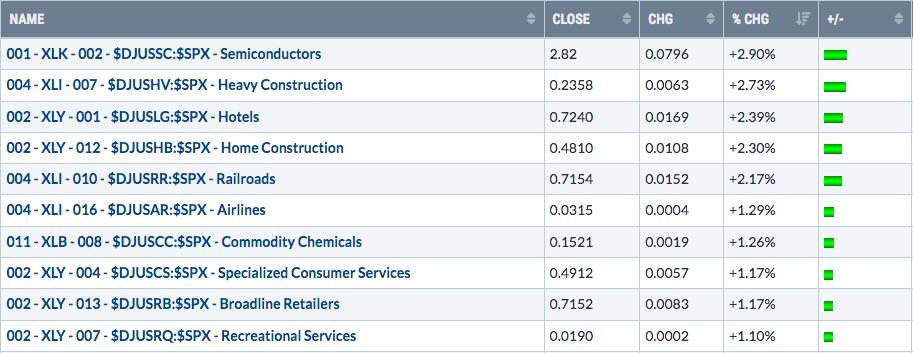
Heavy construction ($DJUSHV) could be set up for a very meaningful advance from here. I love the breakout of an inverse head & shoulders pattern on its weekly chart:
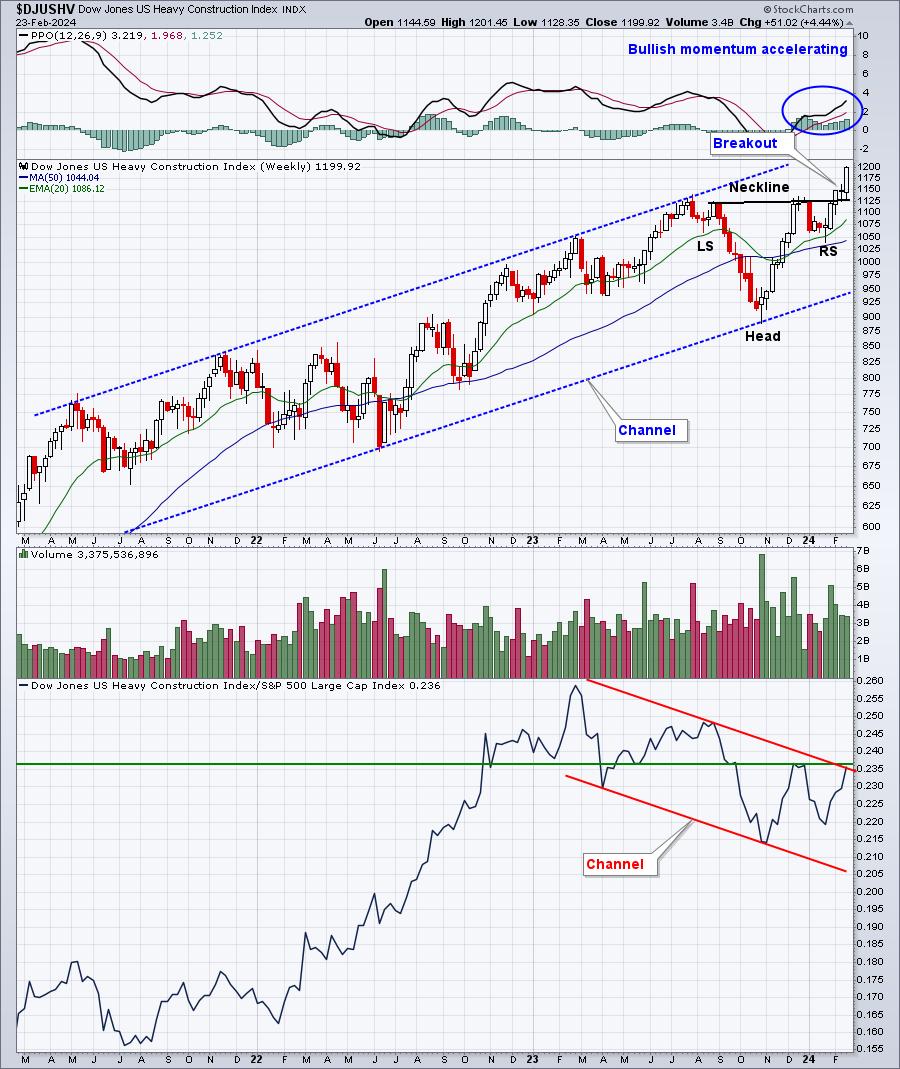
The rising 20-week EMA will now offer up excellent support on any extended period of selling. The next bullish signal to look for would be a relative strength breakout above 0.237 or thereabouts, clearing both the December relative high and the upper downtrend line in the relative channel.
Bottom 10 Industries Last Week
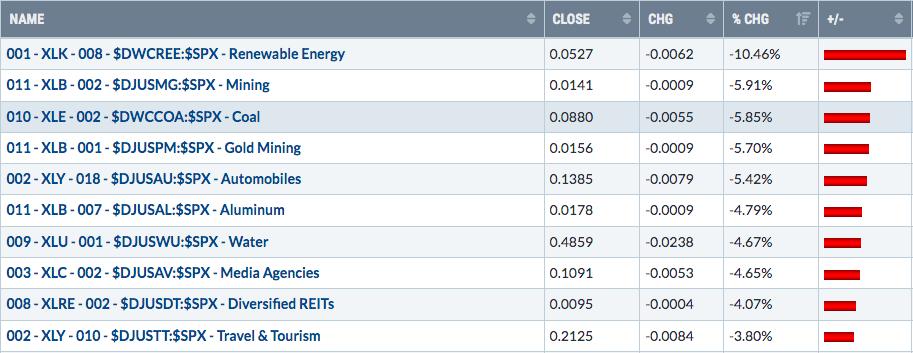
The DWCREE is POTENTIALLY setting up for a big move higher, but we're still awaiting confirmation. The current set up looks almost identical to the bottom in mid-2022, but you can see the weekly candle I circled that provided confirmation:
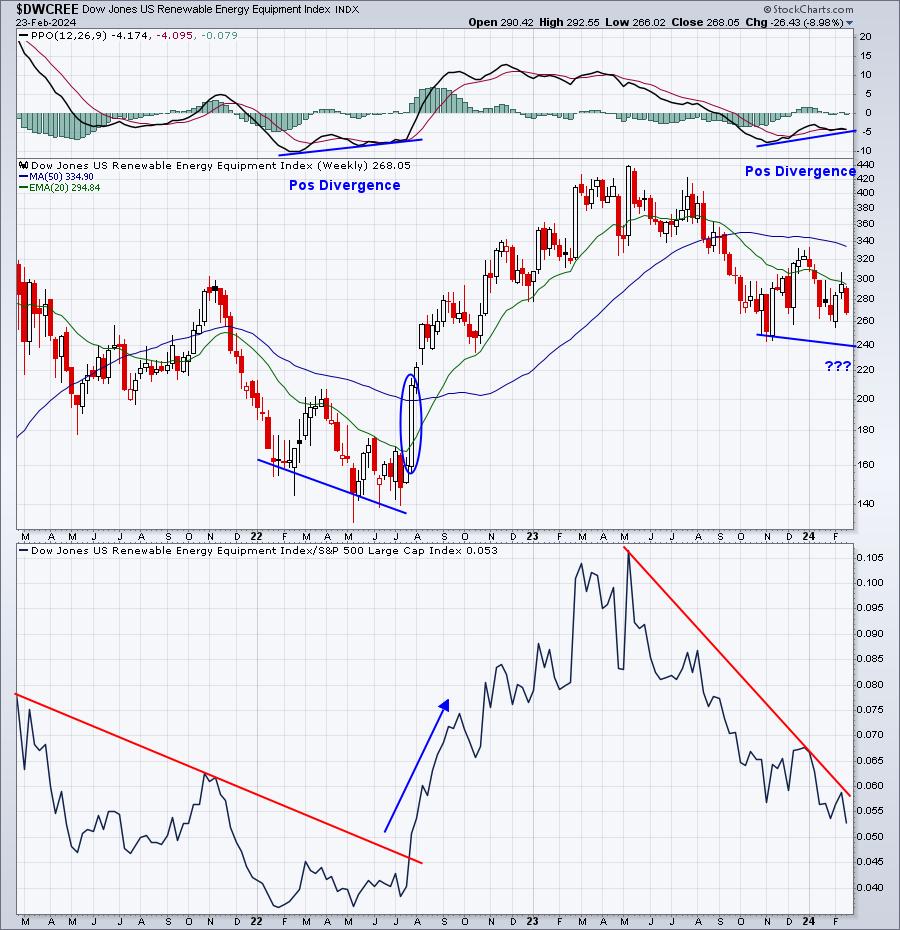
The relative strength line forged to a new low last week, so it's too early to jump in. Keep in mind that when this group gets running, it typically moves a lot higher and does it quickly. So there'll be opportunities to make money AFTER we see a big reversal. Give it a bit more time.
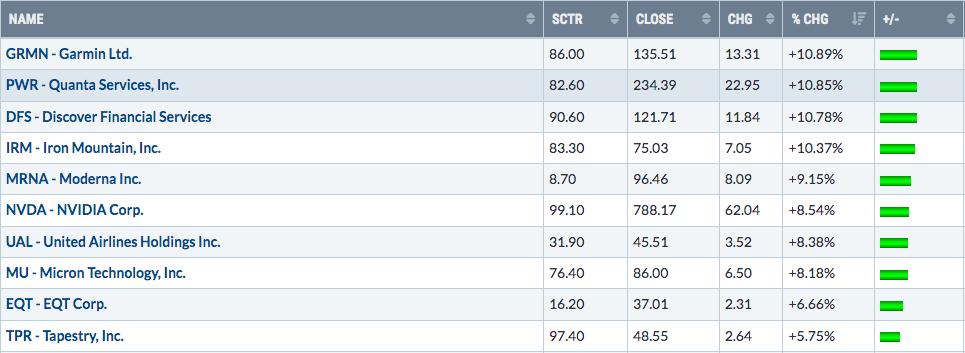
Top 10 Stocks - S&P 500/NASDAQ 100
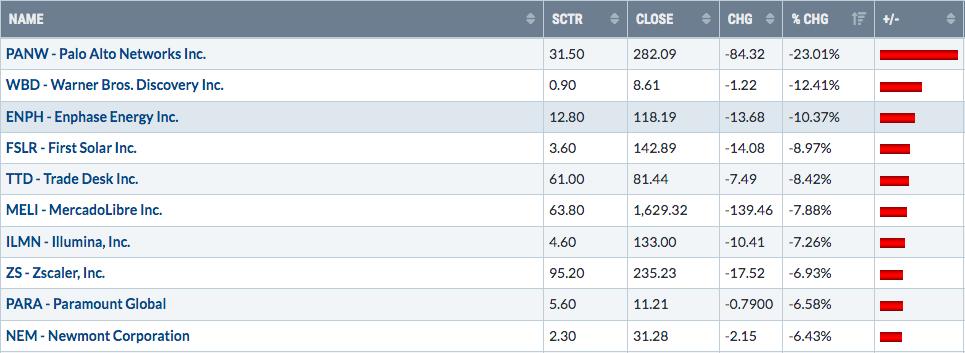
Bottom 10 Stocks - S&P 500/NASDAQ 100
Big Picture
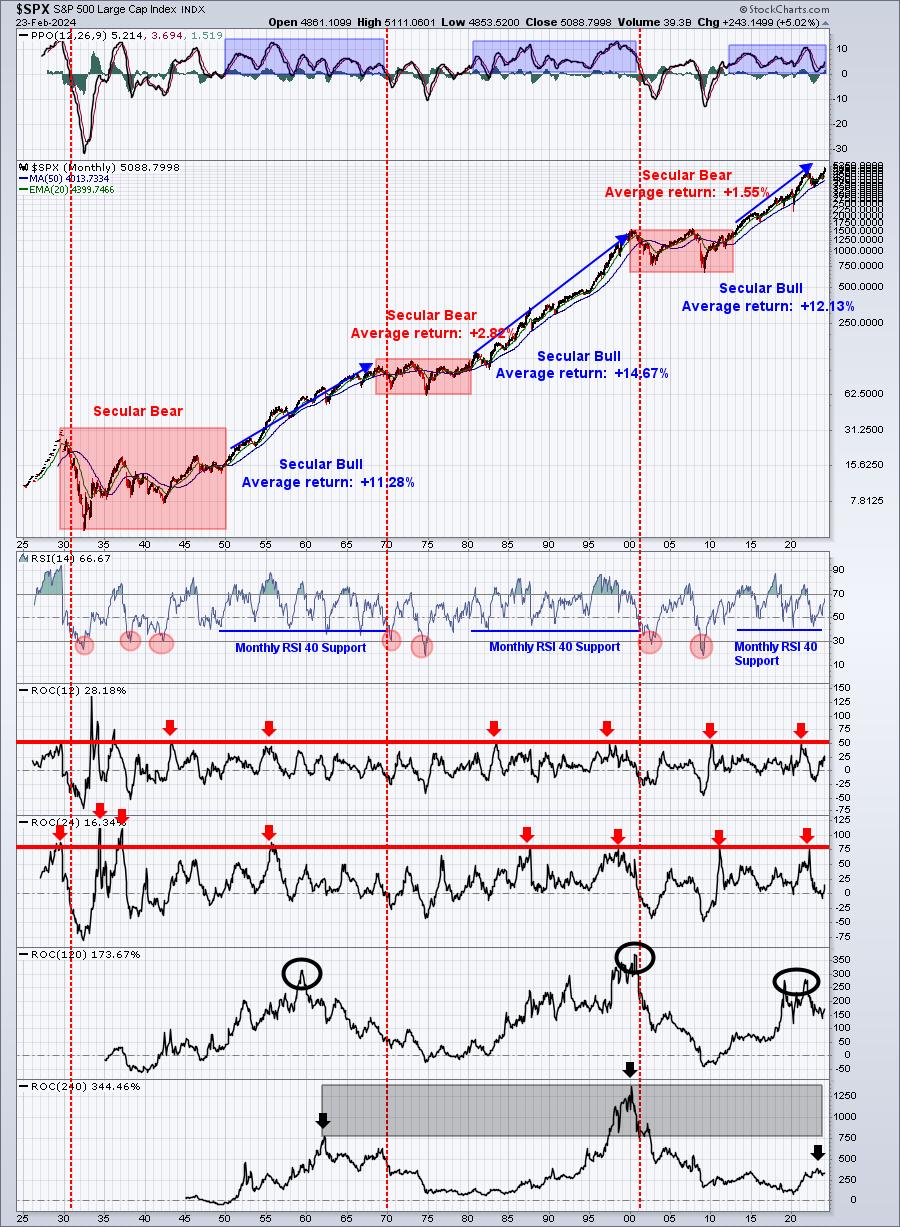
Constantly calling for a bear market during a secular bull market is so painful and expensive, yet there are plenty of analysts and traders alike who do nothing but try to call bear markets. If history is any guide, it's likely we will not see a SECULAR bear market until we move into the 2030s. Yes, we'll be required to suffer through a CYCLICAL bear market from time to time, but I'm seeing no signs of any sort of intermediate-term trouble. We're overbought, in a period (2nd half of a calendar quarter) where gains tend to be more difficult, and showing short-term signs of complacency, but nothing that I'd consider too serious. Many times, bull markets simply put their head down and bulldoze their way to higher highs. Betting against it can be painful, as I mentioned.
Here's this week's look at more bullish action:
Sentiment
Last week's short-term warning was primarily due to a very accurate sentiment indicator that suggested a top was likely. We did see a couple of days of mild weakness, but after NVIDIA Corp's (NVDA) quarterly earnings release on Wednesday after the closing bell, prices shot higher again. The semiconductors' ($DJUSSC) strength has been relentless. We'll likely need to see a period of profit taking in that group before we'll see any meaningful in the major indices.
The 5-day SMA of the equity only put call ratio ($CPCE) dropped to a key level (.54-.57) where several recent market tops have occurred. Just keep in mind that a secular bull market call is a LONG-TERM call, while these types of bearish developments typically impact the SHORT-TERM only. Therefore, my approach to the major indices would be to expect higher prices ahead, but with short-term caution. Remember it's okay for the major indices to sell off for awhile, it's actually quite constructive. Here's what happened to the CPCE 5-day SMA last week:
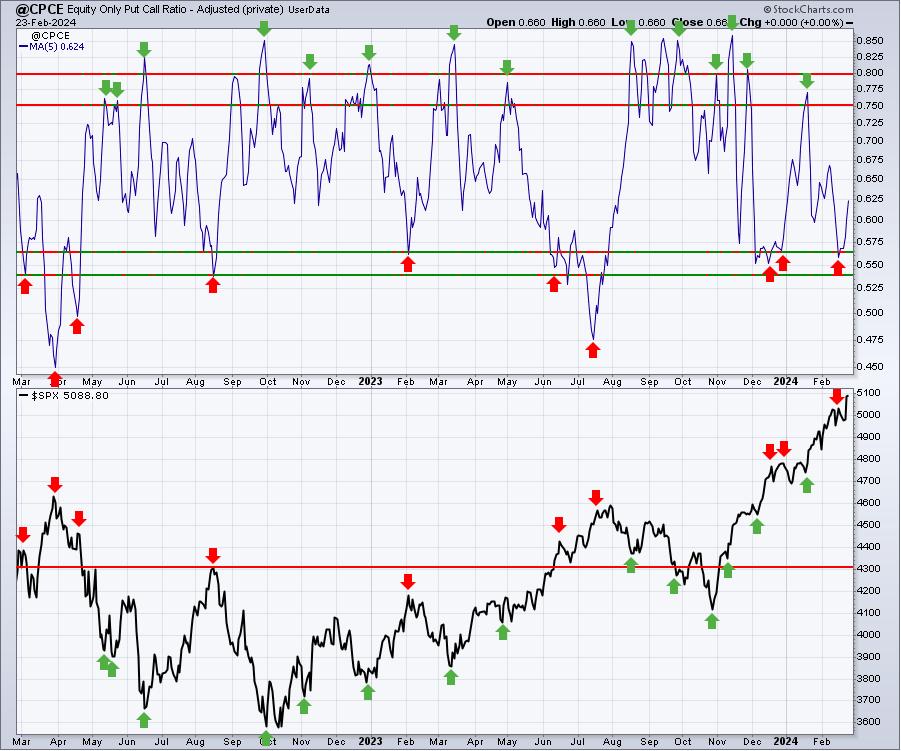
While we saw little weakness last week, I still place significant value on this indicator. Nothing will be right every time and we also know that the CPCE is not useful in predicting long-term tops and bottoms - at least not this 5-day CPCE.
In order to view the long-term signal of the CPCE, I use the 253-day SMA. There are roughly 253 trading days in a year, so when this 253-day moving average reaches extreme levels, it's SCREAMING at us that we're very likely to see a long-term reversal. The extreme complacency reversed over the past few months and that's signaled a market bottom and a secular bull market advance, which is exactly what we're seeing. Check this chart out:
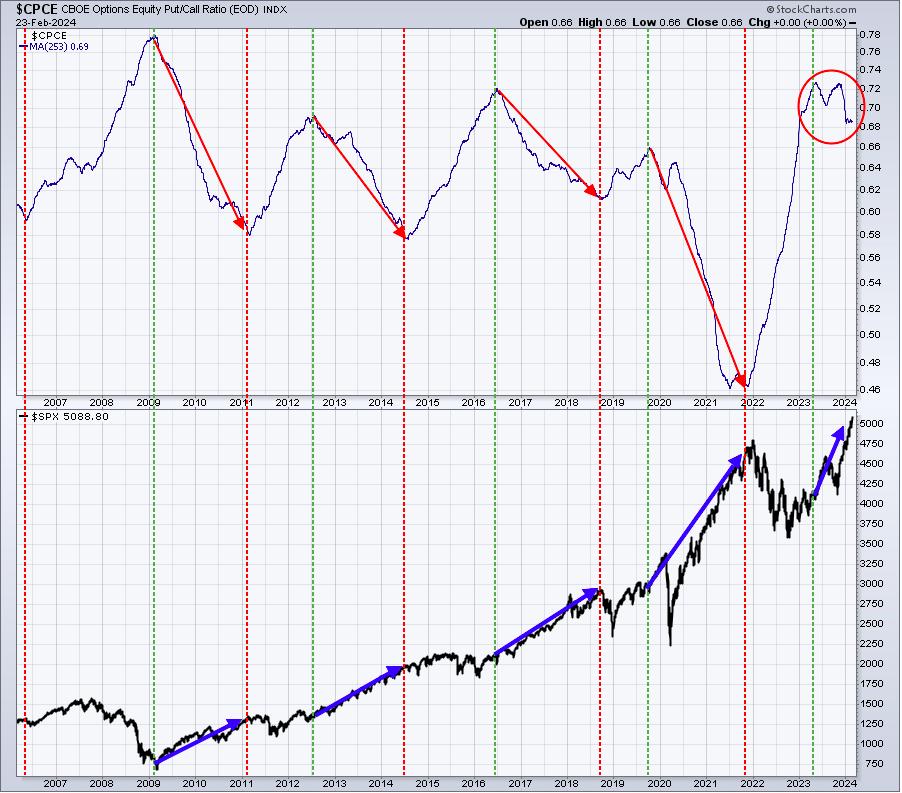
When fear has run rampant for an extended period of time, there are few sellers left. Everyone who wanted out got out. I LOVE the fact that the 253-day SMA remains above .68. That's a recipe for higher S&P 500 prices ahead and fully supports my belief that we'll see prices MUCH, MUCH higher over the next 2-3 years.
Rotation/Intermarket Analysis
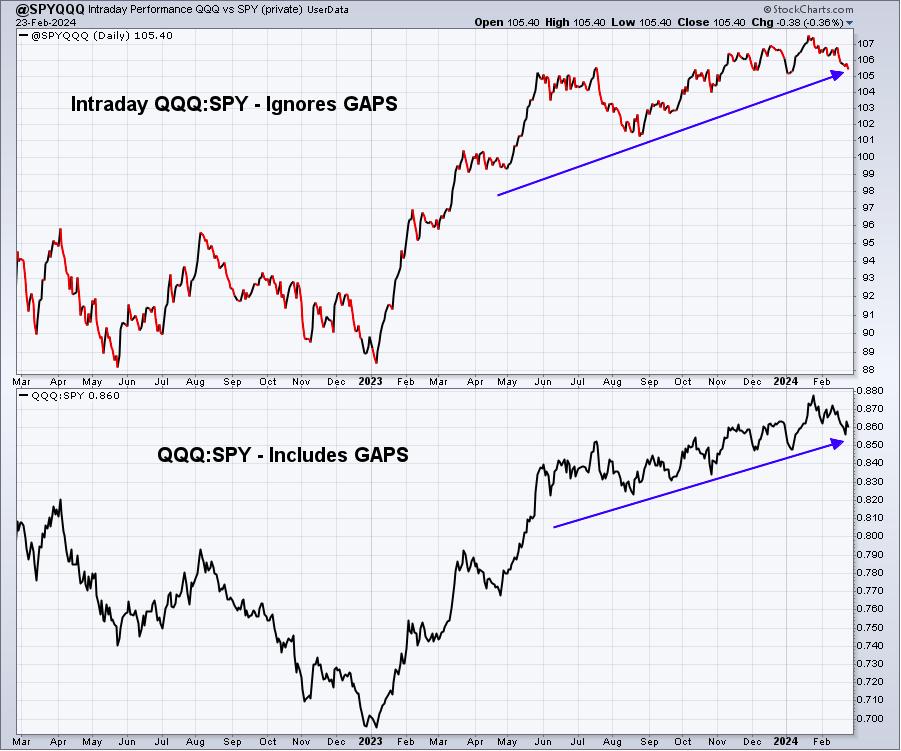
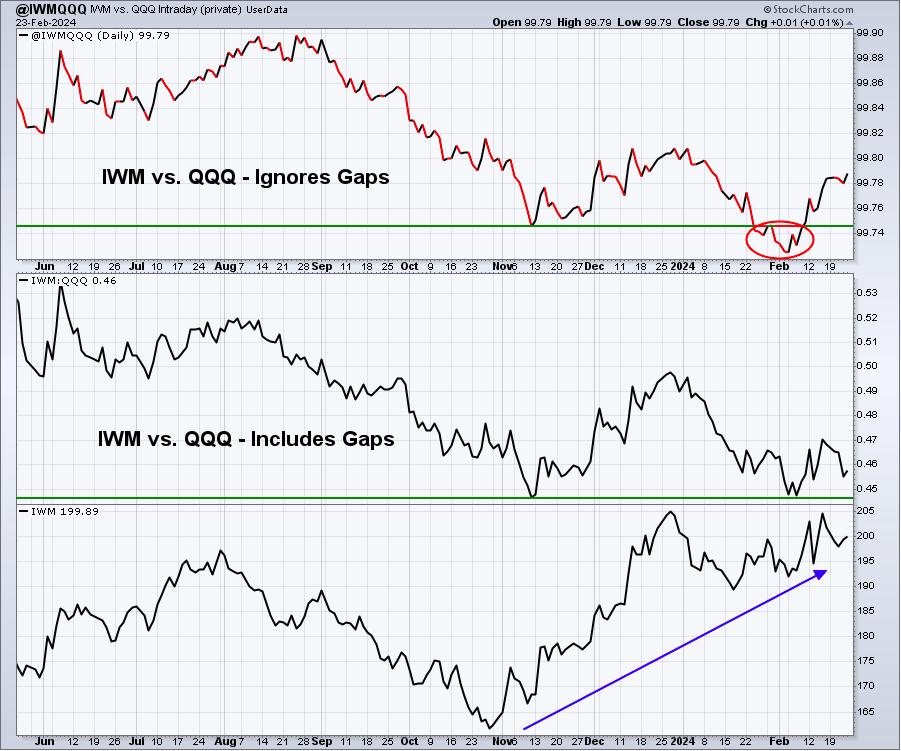
I like to show this intraday rotation in just about every Weekly Market Report, because it tells us a lot of where money is moving DURING THE TRADING DAY. The top part of these charts completely ignores manipulative gaps and essentially helps us see if the rotation, including gaps, is any different. Differences can then be evaluated in that risk assessment that I was just talking about in Sentiment. Check out the latest:
QQQ:SPY
IWM:QQQ
XLY:XLP
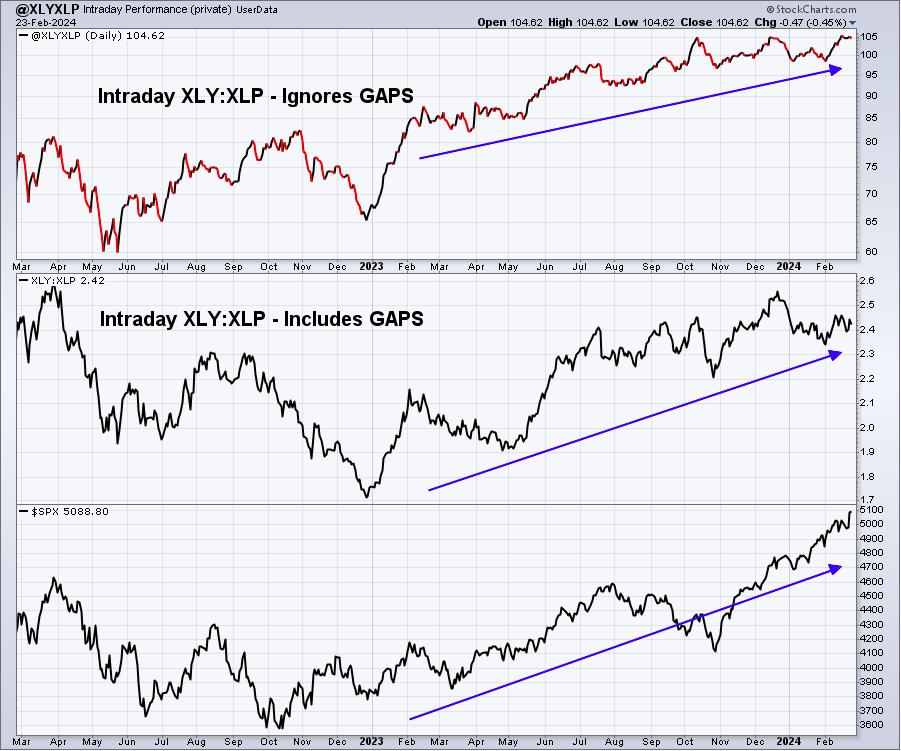
The XLY:XLP ratio is on the verge of breaking out of a triple top on an intraday basis, suggesting that plenty of bullish activity is taking place here after the opening gaps. Such a breakout would be VERY bullish and technically constructive. This would be a very important breakout that would confirm the continuation of the secular bull market, even if we do see a period of consolidation or selling in the short-term.
The IWM:QQQ ratio will also be key to watch, because if the market does show short-term weakness from the QQQ, do we see rotation to other areas that can lead the market for awhile? The IWM hasn't really been a leader in the market since the beginning of the pandemic, but that leadership could return - and, of course, most of you are aware that I'm looking for that leadership again in 2024.
There are several ratios and intermarket analysis that helps us determine the sustainability of an S&P 500 advance. Two GLOBAL charts that I like to follow are as follows:
Crude Oil Prices ($WTIC):
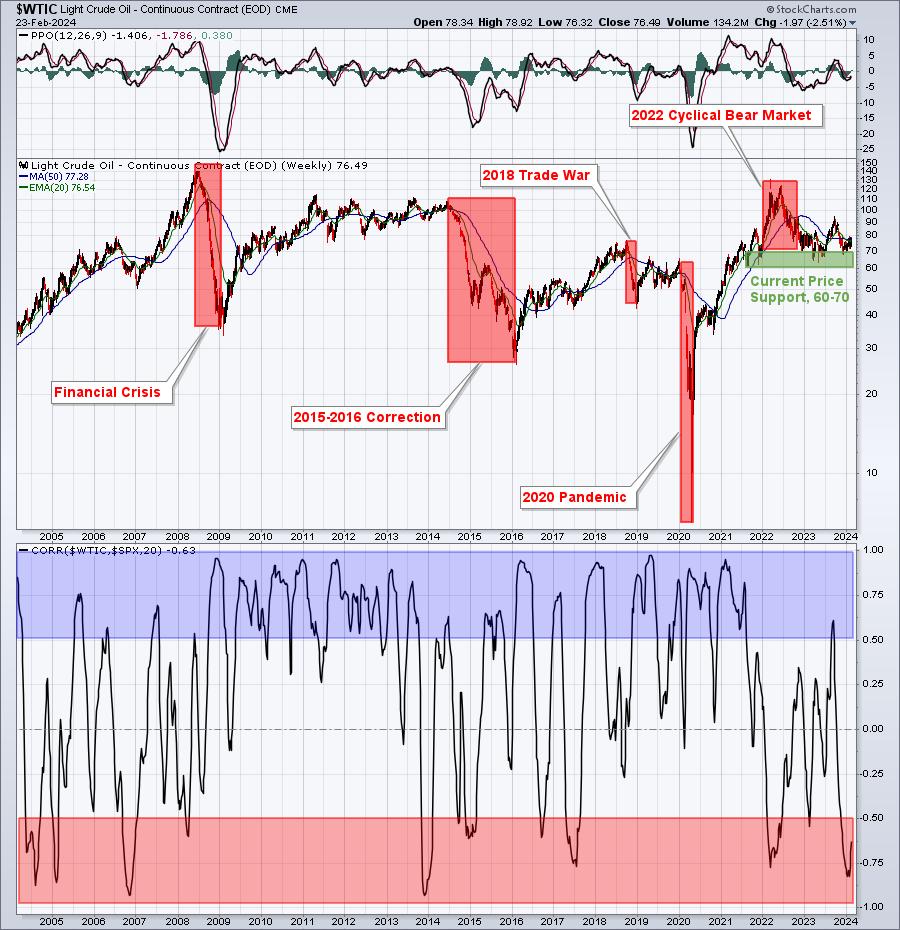
You can see the reaction in crude oil prices when the stock market goes through a period of difficulty. They tend to struggle together. While this correlation isn't perfect, I highlighted the positive correlation with blue shading and inverse correlation with red shading. More often than not, the S&P 500 and crude oil prices ($WTIC) move together. So a breakdown in crude below the recent $60-$70 price per barrel could be a big issue for the S&P 500.
Copper vs. Gold ($COPPER:$GOLD):
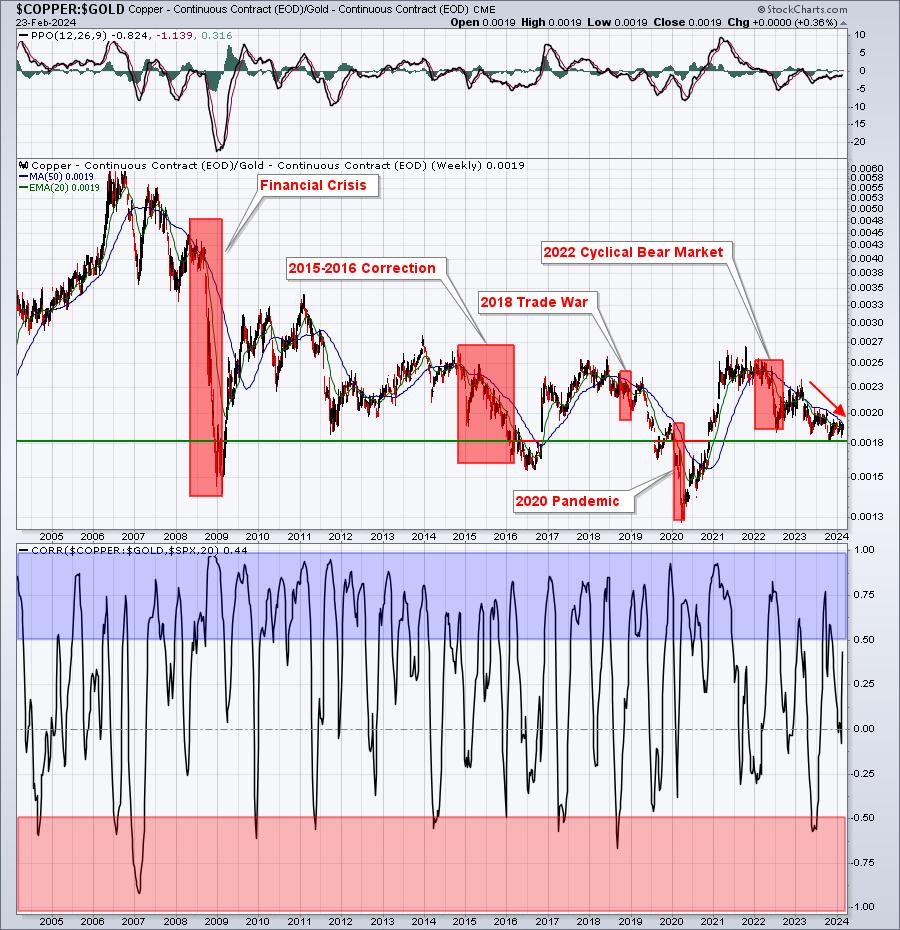
This is another chart that doesn't have perfect correlation with the S&P 500, but clearly they have a tendency to move together. Currently, this copper to gold ratio is declining, not supporting/confirming the S&P 500 move higher. I believe, in part, that crude oil and copper:gold aren't moving higher with the S&P 500, because global economies are not particularly strong - at least not as strong as the U.S. economy. If we see breakouts to the upside in both of these charts, then I believe we'll see better relative performance in foreign markets.
Trade Setup
Since beginning this Weekly Market Report in early September, I've discussed the long-term trade candidates below that I really like. Generally, these stocks have excellent long-term track records and many pay nice dividends that mostly grow every year. Only in very specific cases (exceptions) would I consider a long-term entry into a stock that has a poor or limited long-term track record. Check these out:
- JPM
- BA
- FFIV
- MA
- GS - breaking above previous trendline resistance near 350-355 was bullish
- FDX
- AAPL
- CHRW
- JBHT
- STX
- HSY
- DIS
- MSCI
- SBUX
- KRE
I'm still waiting to add other long-term trade candidates.
Keep in mind that our Weekly Market Reports favor those more interested in the long-term market picture. Therefore, the list of stocks above are stocks that we believe are safer to own with the long-term in mind. Nearly everything else we do at EarningsBeats.com favors short-term momentum trading, so I wanted to provide an explanation of what we're doing with this list.
Looking Ahead
Upcoming Earnings:
Earnings remain on center stage, but the number of key companies reporting has begun to slow significantly now. I've identified what I believe are key companies that will report this week, with their respective market caps in parenthesis. This is NOT a list of ALL companies reporting this week, so please be sure to check for earnings of any companies that you own or add. Any companies in BOLD represents stocks in one of our Portfolios:
- Monday: WDAY ($81 billion), ZM ($19 billion)
- Tuesday: LOW ($133 billion), AZO ($48 billion), A ($39 billion)
- Wednesday: CRM ($284 billion), TJX ($113 billion), SNOW ($74 billion)
- Thursday: NTES ($70 billion), ADSK ($55 billion), VEEV ($36 billion)
- Friday: None
Key Economic Reports:
- Monday: January new home sales
- Tuesday: January durable goods, January Case-Shiller home price index, February consumer confidence
- Wednesday: Q4 GDP (2nd estimate), January retail inventories, January wholesale inventories
- Thursday: Initial jobless claims, January personal income & spending, PCE index, February Chicago PMI, January pending home sales
- Friday: February PMI manufacturing, February ISM manufacturing, January construction spending, February consumer sentiment
Historical Data
I'm a true stock market historian. I am absolutely PASSIONATE about studying stock market history to provide us more clues about likely stock market direction and potential sectors/industries/stocks to trade. While I don't use history as a primary indicator, I'm always very aware of it as a secondary indicator. I love it when history lines up with my technical signals, providing me much more confidence to make particular trades.
I'm now providing a bigger window into the historical numbers ahead. Below you'll find the next two weeks of historical data and tendencies across the 3 key indices that I follow most closely:
S&P 500 (since 1950)
- February 26: +16.50%
- February 27: -61.89%
- February 28: -19.83%
- February 29: -15.19%
- March 1: +75.91%
- March 2: +39.20%
- March 3: +11.46%
- March 4: +52.43%
- March 5: +24.57%
- March 6: -19.08%
- March 7: -65.68%
- March 8: +3.73%
- March 9: -18.01%
- March 10: +41.86%
NASDAQ (since 1971)
- February 26: +19.04%
- February 27: -99.90%
- February 28: -25.64%
- February 29: +2.20%
- March 1: +128.14%
- March 2: +8.14%
- March 3: -7.22%
- March 4: +81.27%
- March 5: -2.45%
- March 6: -27.03%
- March 7: -65.06%
- March 8: +15.37%
- March 9: -39.99%
- March 10: +42.11%
Russell 2000 (since 1987)
- February 26: +25.91%
- February 27: -73.29%
- February 28: -58.90%
- February 29: +11.92%
- March 1: +141.87%
- March 2: -1.57%
- March 3: +4.06%
- March 4: +100.91%
- March 5: -32.60%
- March 6: -52.45%
- March 7: -33.62%
- March 8: +15.13%
- March 9: -76.04%
- March 10: +10.07%
The S&P 500 data dates back to 1950, while the NASDAQ and Russell 2000 information date back to 1971 and 1987, respectively.
February tends to end on a sour note, but the first week of March is typically bullish - similar to most calendar months as new money pours in to open the month.
Final Thoughts
It seemed to me as though the late week rally last week began to run out of steam. That's easy to rectify, though, as all it takes is another shot higher in the QQQ to support another S&P 500 breakout. But given all the signals I follow, I do have to give the edge to the bears this week.
Here are several things to consider in the week ahead:
- Earnings. We'll be seeing plenty of quarterly earnings reports this week. While they've slowed down considerably, there are still plenty of medium- to large-cap names that will be reporting. Several software ($DJUSSW) companies are due to report. While software continues to climb, relative strength has slowed a bit in recent weeks. I expect strong reports from WDAY and CRM, while ADSK and VEEV are a bit more worrisome. I'd put SNOW somewhere in the middle, but I'd probably lean towards a solid report.
- Interest rates. The 10-year treasury yield ($TNX) is trending higher, but I don't expect it to last. The rising 20-day EMA on the TNX is now at 4.20%, exactly where yield support resides as well.
- Volatility ($VIX). The S&P 500 keeps climbing, but the VIX has subtly been rising too. It tells me that the market has grown a bit more fearful, despite rising equity prices. Should the VIX fall back down to 12.00-12.50, then I'd no longer worry about the VIX. But if the S&P 500 rises again this week with the VIX back up above 14, I'd grow more nervous.
- Sustainability. The Dow Jones, S&P 500, and NASDAQ 100 have all produced weekly gains in 15 of the last 17 weeks - since late October. I was looking at my Presidential Election cycle work and we typically see a Presidential Election year low close to March 10th, which is only two weeks away. This guarantees us nothing, I'm simply providing historical facts.
- Rotation. The sustainability ratios that I like to follow ALL suggest the S&P 500 will be heading higher this year. That's my long-term view, but we know short-term consolidation and selloffs can occur at any time - usually when we least suspect it.
Feedback
If you'd like to share your thoughts on our Weekly Market Report, positive or negative, you can reach us at "[email protected]".
Happy trading!
Tom